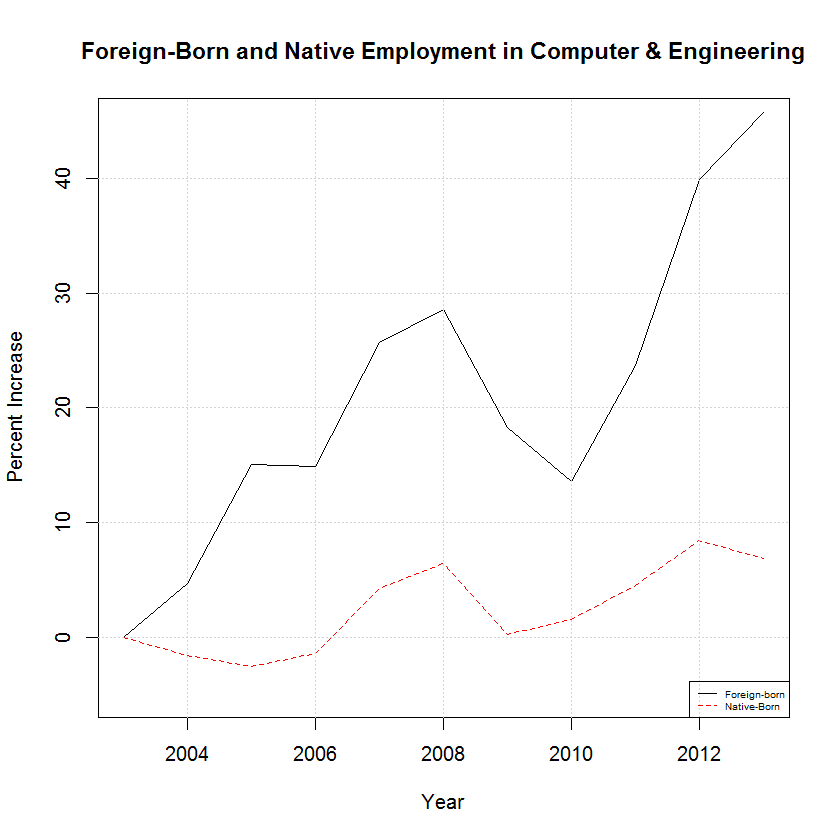
Foreign-Born and Native-Born Employment in Top H-1B Occupations
       Total Employed     Computer and    Architecture and             Computer and Engineering
        (thousands)       Mathematical      Engineering         (total numbers)       (percent increase)
      ----------------  ----------------  ----------------  -------------------------  ----------------
Year  Foreign   Native  Foreign   Native  Foreign   Native  Foreign   Native   Total   Foreign   Native
----  -------  -------  -------  -------  -------  -------  -------  -------  -------  -------  -------
2003    19731   118005    3.0      2.2      2.0      2.0     986550  4956210  5942760   0.0000   0.0000
2004    20255   118997    3.0      2.1      2.1      2.0    1033005  4878877  5911882   4.7088  -1.5603
2005    21022   120708    3.2      2.1      2.2      1.9    1135188  4828320  5963508  15.0664  -2.5804
2006    22225   122202    3.1      2.1      2.0      1.9    1133475  4888080  6021555  14.8928  -1.3746
2007    22967   123079    3.4      2.2      2.0      2.0    1240218  5169318  6409536  25.7126   4.2998
2008    22660   122703    3.6      2.3      2.0      2.0    1268960  5276229  6545189  28.6260   6.4569
2009    21608   118269    3.3      2.3      2.1      1.9    1166832  4967298  6134130  18.2740   0.2237
2010    21969   117095    3.3      2.4      1.8      1.9    1120419  5035085  6155504  13.5694   1.5914
2011    22183   117686    3.5      2.4      2.0      2.0    1220065  5178184  6398249  23.6699   4.4787
2012    23006   119464    3.8      2.5      2.2      2.0    1380360  5375880  6756240  39.9179   8.4676
2013    23582   120348    3.9      2.5      2.2      1.9    1438502  5295312  6733814  45.8113   6.8420

Source: Foreign-born Workers: Labor Force Characteristics, Bureau of Labor Statistics,
        (referenced by study titled H-1Bs Don’t Replace U.S. Workers, by David Bier)
Information on H-1B Visas
Commentary on the Skills Gap
Go to Budget Home Page