On June 12, 2018, Fortune Magazine posted an article titled The Unemployment Rate for U.S. Tech Workers Just Hit the Lowest Number Ever Recorded. That article states:
According to CompTIA, the unemployment rate for America's technology workers hit 1.3 percent in May. It's come close to touching these lows before, most recently in March, 2018 and again in April 2007, a year before the global financial crisis wreaked havoc on markets. At those moments, the rate reached 1.4 percent.
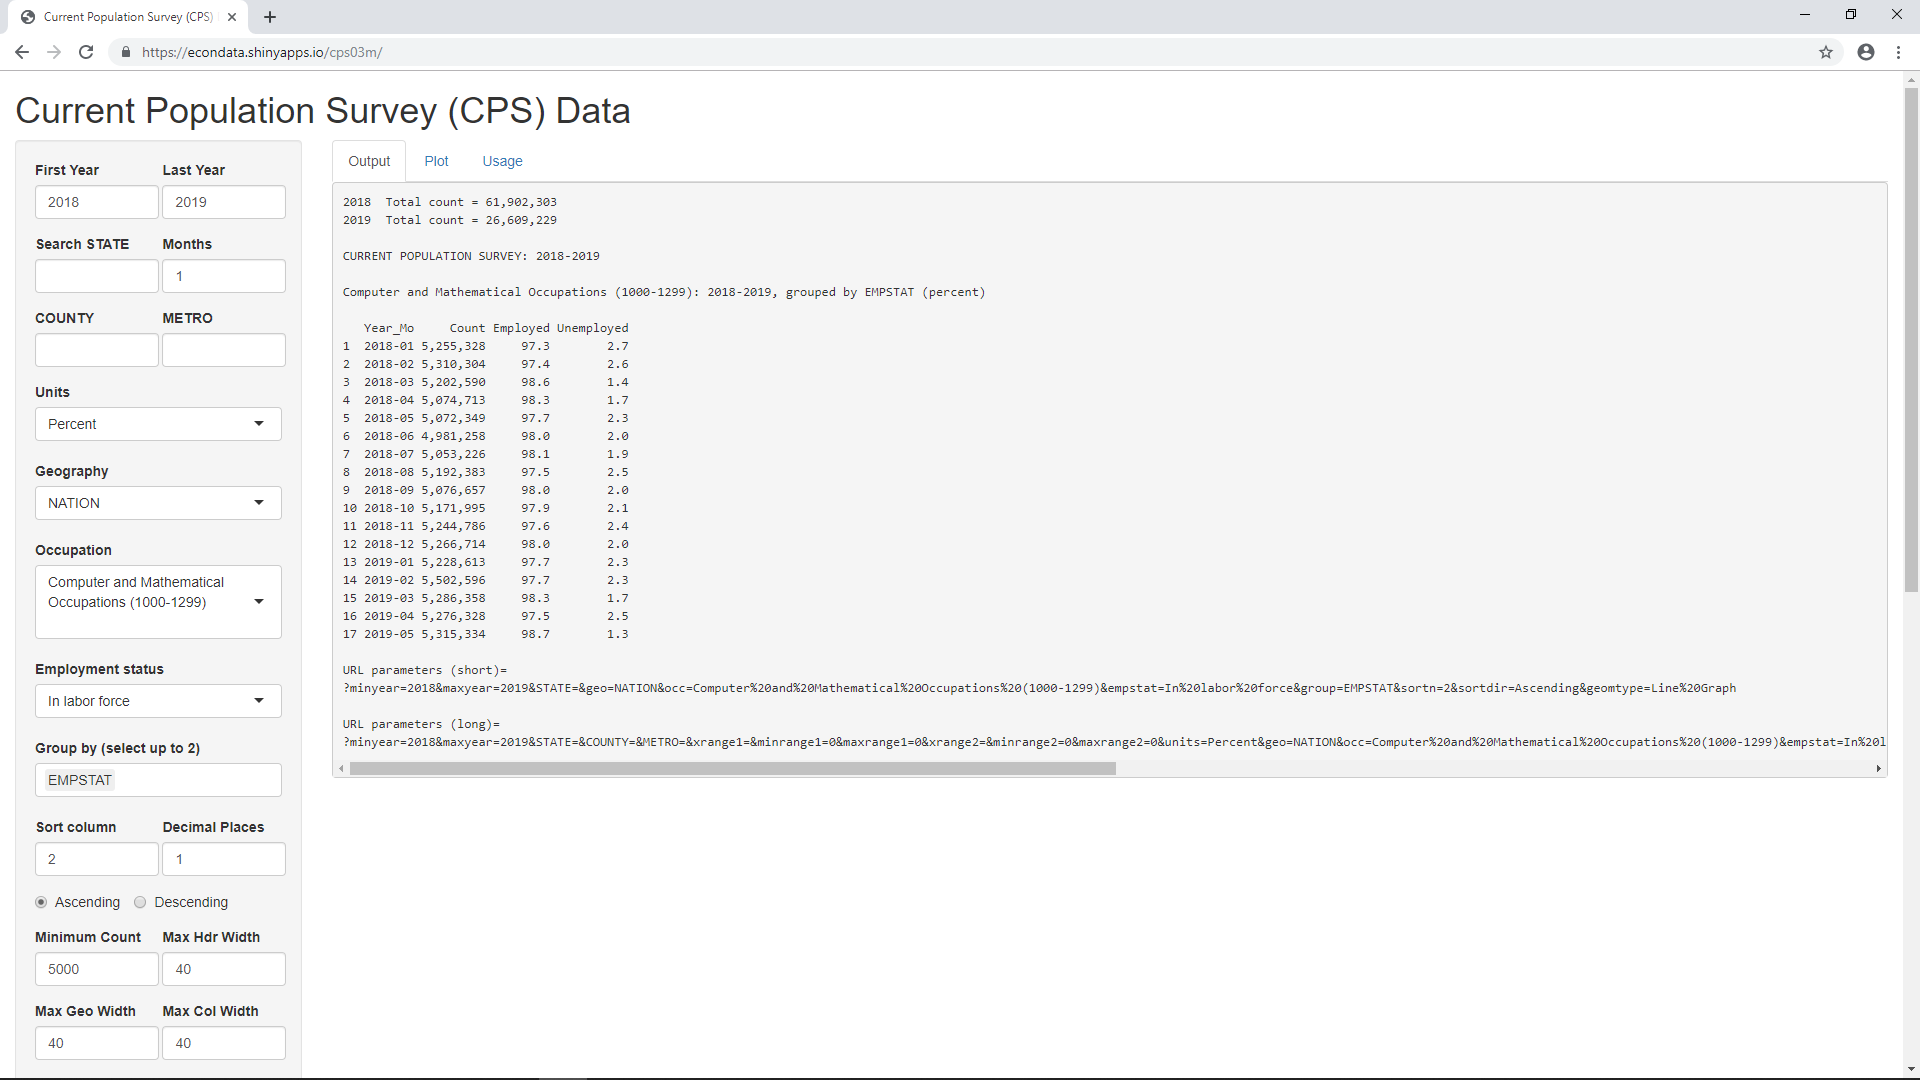
In fact, it is possible to check these numbers in the Shiny application at https://econdata.shinyapps.io/cps03m/. Going to the URL and setting "First Year" to 2018 will display the following screen:
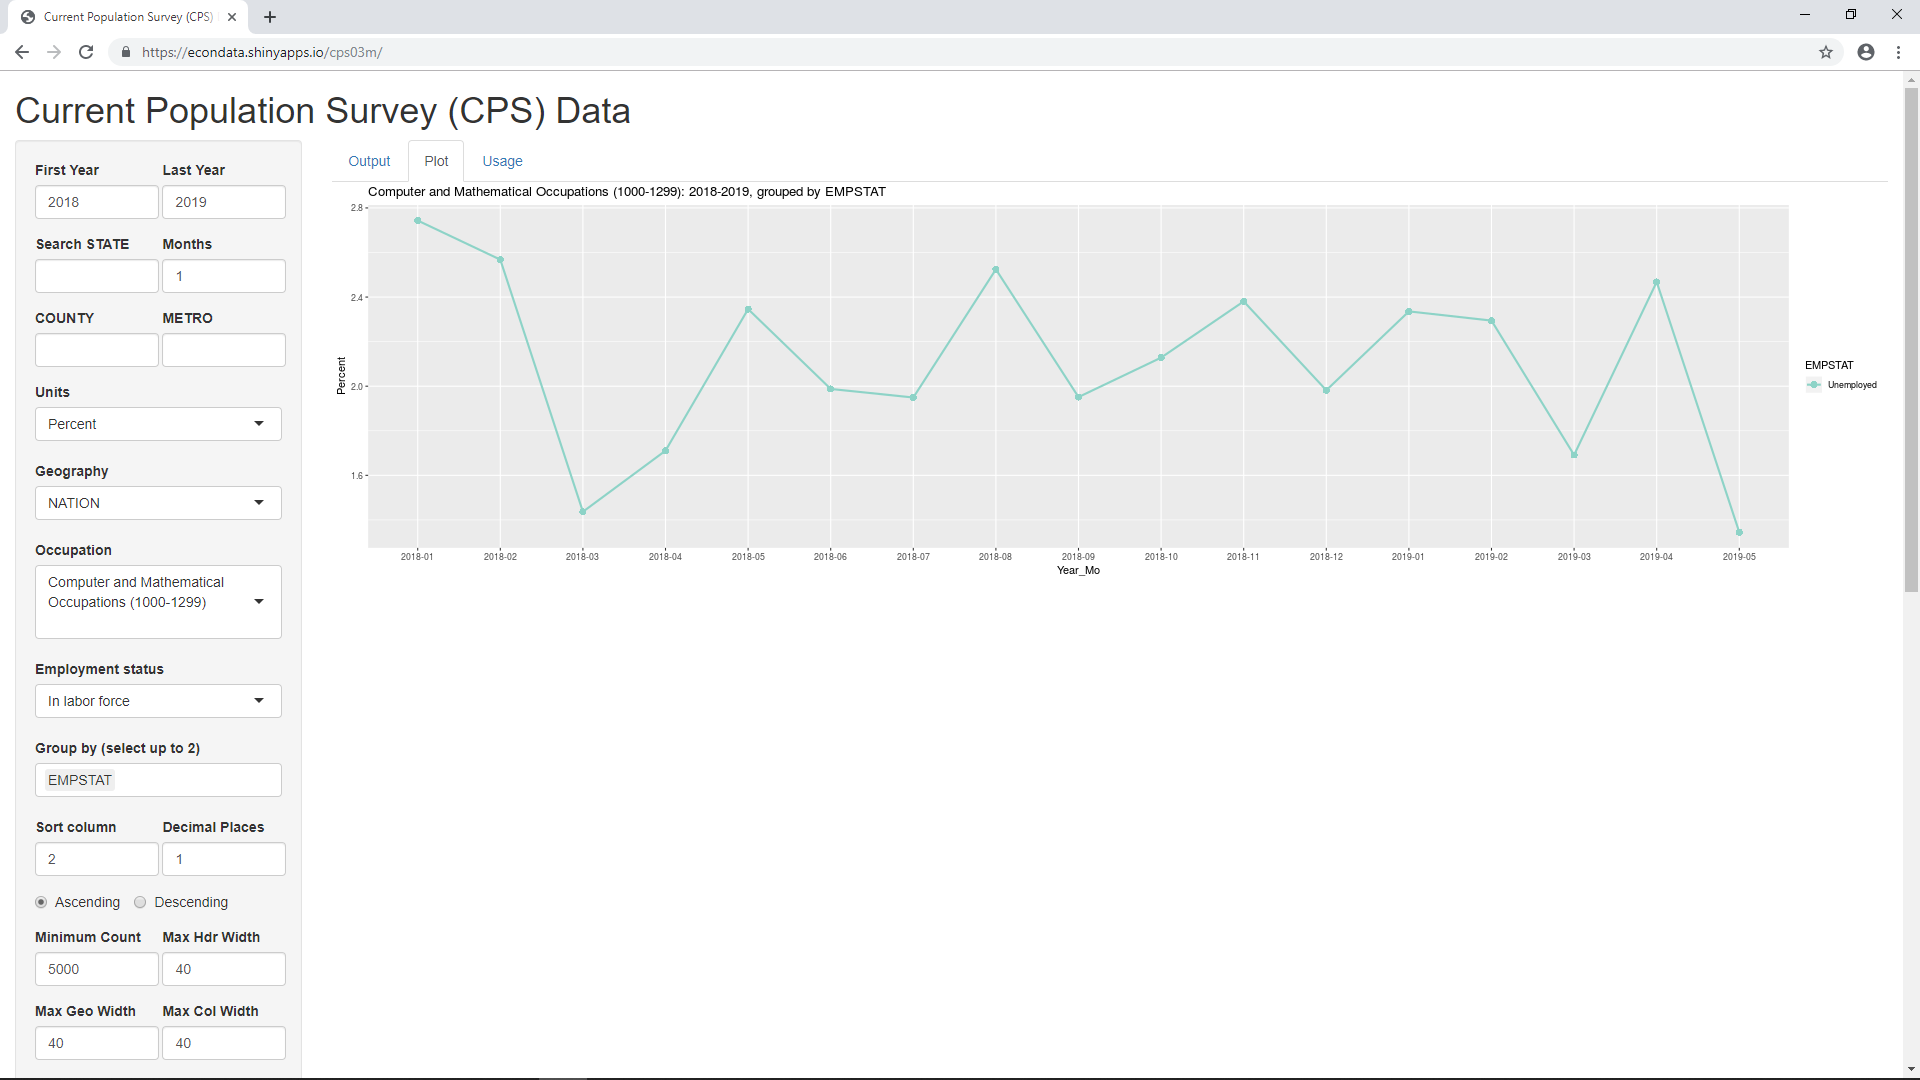
A line graph of this data can be seen by clicking on the Plot tab and ensuring that "Plot Type" (near the bottom of the left tab) is set to "Line Graph". In order to focus just on the unemployment rate, set "X Min" and "X Max" to 2. This works because EMPSTAT is a factor variable in which 2 specifies "Unemployed". As a result, the following plot is displayed:
The data displayed comes from the monthly Current Population Survey (CPS) and can be obtained by going to https://cps.ipums.org/cps/, clicking "LOG IN" (signing up first, if necessary), and requesting a specific data extract. For the Shiny application, a data extract of the BASIC MONTHLY data was requested for each year from 2003 to 2019 for the following variables:
Variable    Variable Label                             Typ Dec Nov Oct Sep Aug Jul Jun May Apr Mar Feb Jan
                                                           18  18  18  18  18  18  18  18  18  18  18  18

YEAR        Survey year [preselected].................. H   X   X   X   X   X   X   X   X   X   X   X   X
SERIAL      Household serial number [preselected]...... H   X   X   X   X   X   X   X   X   X   X   X   X
MONTH       Month [preselected]........................ H   X   X   X   X   X   X   X   X   X   X   X   X
HWTFINL     Household weight, Basic Monthly [preselect] H   X   X   X   X   X   X   X   X   X   X   X   X
CPSID       CPSID, household record [preselected]...... H   X   X   X   X   X   X   X   X   X   X   X   X
ASECFLAG    Flag for ASEC [preselected]................ H   .   .   .   .   .   .   .   .   .   X   .   .
PERNUM      Person number in sample unit [preselected]. P   X   X   X   X   X   X   X   X   X   X   X   X
WTFINL      Final Basic Weight [preselected]........... P   X   X   X   X   X   X   X   X   X   X   X   X
CPSIDP      CPSID, person record [preselected]......... P   X   X   X   X   X   X   X   X   X   X   X   X
STATEFIP    State (FIPS code).......................... H   X   X   X   X   X   X   X   X   X   X   X   X
METAREA     Metropolitan area.......................... H   X   X   X   X   X   X   X   X   X   X   X   X
COUNTY      FIPS county code........................... H   X   X   X   X   X   X   X   X   X   X   X   X
AGE         Age........................................ P   X   X   X   X   X   X   X   X   X   X   X   X
SEX         Sex........................................ P   X   X   X   X   X   X   X   X   X   X   X   X
RACE        Race....................................... P   X   X   X   X   X   X   X   X   X   X   X   X
BPL         Birthplace................................. P   X   X   X   X   X   X   X   X   X   X   X   X
YRIMMIG     Year of immigration........................ P   X   X   X   X   X   X   X   X   X   X   X   X
CITIZEN     Citizenship status......................... P   X   X   X   X   X   X   X   X   X   X   X   X
HISPAN      Hispanic origin............................ P   X   X   X   X   X   X   X   X   X   X   X   X
EMPSTAT     Employment status.......................... P   X   X   X   X   X   X   X   X   X   X   X   X
OCC         Occupation................................. P   X   X   X   X   X   X   X   X   X   X   X   X
OCC1990     Occupation, 1990 basis..................... P   X   X   X   X   X   X   X   X   X   X   X   X
CLASSWKR    Class of worker............................ P   X   X   X   X   X   X   X   X   X   X   X   X
UHRSWORKT   Hours usually worked per week at all jobs.. P   X   X   X   X   X   X   X   X   X   X   X   X
AHRSWORKT   Hours worked last week..................... P   X   X   X   X   X   X   X   X   X   X   X   X
DURUNEMP    Continuous weeks unemployed................ P   X   X   X   X   X   X   X   X   X   X   X   X
WHYUNEMP    Reason for unemployment.................... P   X   X   X   X   X   X   X   X   X   X   X   X
WHYPTLWK    Reason for working part time last week..... P   X   X   X   X   X   X   X   X   X   X   X   X
WNLOOK      Reason not looking for work last 4 weeks... P   X   X   X   X   X   X   X   X   X   X   X   X
WKSTAT      Full or part time status................... P   X   X   X   X   X   X   X   X   X   X   X   X
EDUC        Educational attainment recode.............. P   X   X   X   X   X   X   X   X   X   X   X   X
As can be seen in the above screenshots, the unemployment rate for Computer and Mathematical Occupations in May matches the "unemployment rate for America's technology workers" given in the article. However, the table and graph show that there is a fair amount of noise in the data as it was 2.5 percent in the prior month and the unemployment rate has bounced between these two numbers since early 2018. Hence, it seems extremely premature to suggest that the unemployment rate has reached a new permanent low.
In addition, there are certain limitations in the usefulness of the unemployment rate. A June 7, 2018 article titled "Americans need to stop obsessing over the unemployment rate" states the following:
So when the unemployment rate is falling, it could be for two reasons (or, more likely a combination of both). More people could be getting hired. Or more people might be giving up on trying to find work.
The article goes on to show that the U.S. labor force participation rate has been generally dropping since 2000. However, there is an additional problem when looking at the unemployment rate for a segment of the working population. That is that there is no easy way to measure the labor force participation rate of that segment. If a worker is unable to find a job, they will appear in the unemployment stats. If they go on to drop out of the labor force, they will then show up in a lower labor force participation rate. However, if a tech worker is unable to get hired in their field and takes a job as a waiter, they will not appear in the unemployment stats. If they should go on to eventually drop out of the labor force, it's unclear if this will be detectable in the stats. After all, they may list their profession on surveys as waiter instead of tech worker.
There are other limitations of the unemployment rate listed in an article titled Top 5 Problems With the Unemployment Rate. These include the fact that it doesn't separate part-time and full-time workers or consider low-paying jobs. But, for the reasons listed in the prior paragraph, it would seem that the unemployment has even more limitations when applied to a segment of the working population rather than the entire population.
In any event, the following graph shows the measured unemployment rate of Computer and Mathematical Occupations since 2003:
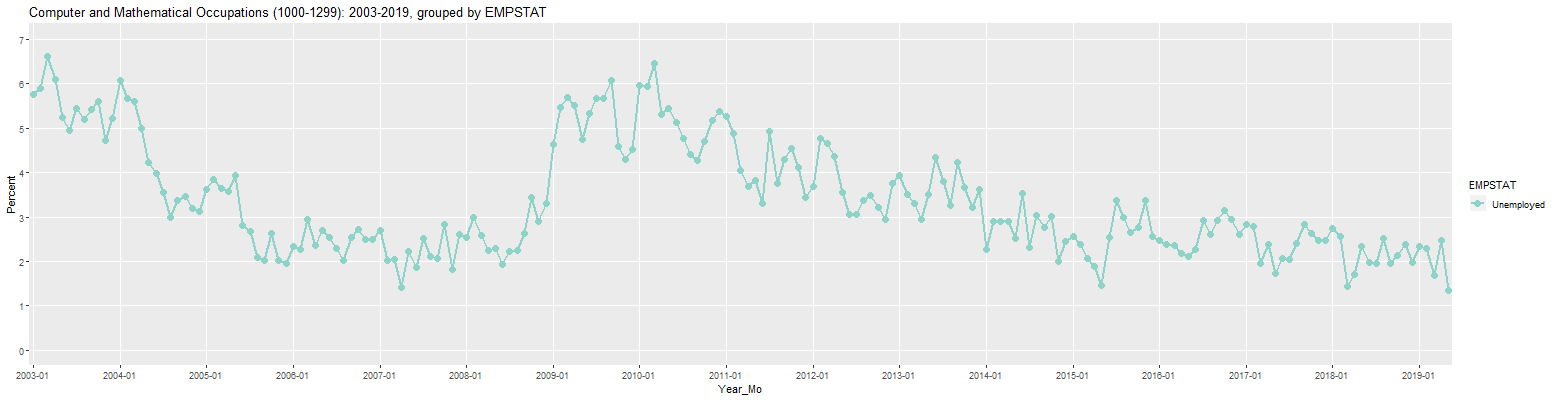
The graph shows that the unemployment rate reached similarly low levels in April 2007 and March 2018, as mentioned in the article. Also, this graph appears to match the one pictured at this link (from mid-2014 on). Hence, these references all seem to be to the same set of numbers. In any event, this graph was created from the prior graph by setting "First Year" to 2003, setting "X Step" to 12, and setting "Y Min", "Y Max", and "Y Step" to 0, 7, and 1, respectively.
Simply changing "Months" to 12 will cause the monthly unemployment data to be averaged over each year, resulting in the following graph:
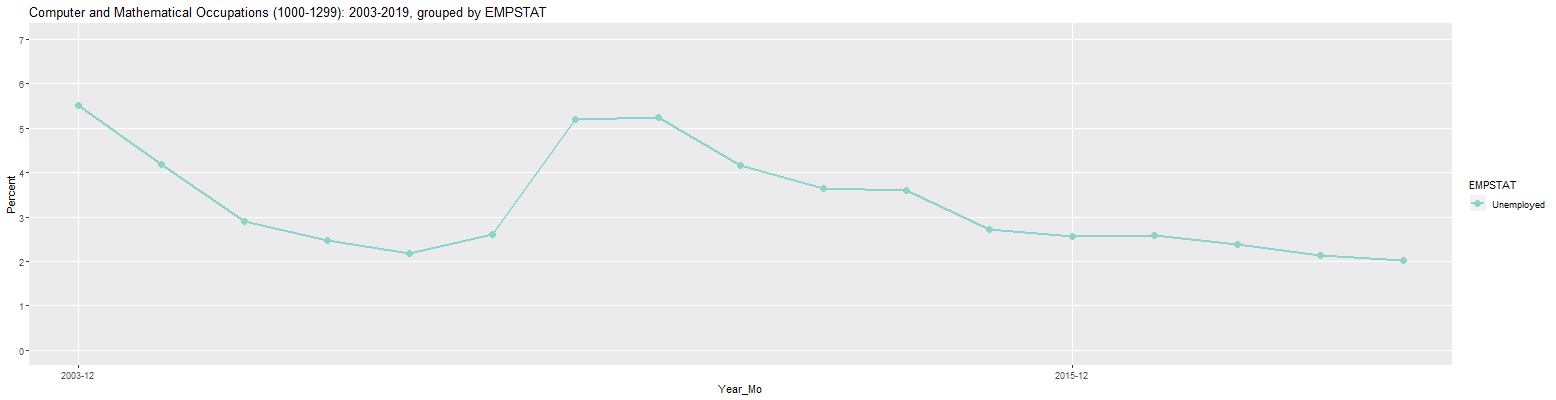
As seen above, the average monthly unemployment over 2019 has been about 2 percent, much higher than the reported 1.3 percent.
Note: The online version of this Shiny app has some trouble handling data beyond 2018 to 2019 due to a memory constraint. The surest way to process data before 2018 is to set all of the parameters in the left panel in the desired way with "First Year" and "Last Year" set to 2019. Then set "First Year" to the desired first year. If you only intend to look at data in the 2018 to 2019 range, it's best to set "Min Year in Memory" (near the bottom of the left panel) to 2018. If you then leave "First Year" and "Last Year" to 2018 and 2019, respectively, you should have no trouble when changing any other parameters.
The Current Population Survey (CPS) contains much of the same data as the American Community Survey (ACS). Many of the differences between the two surveys are listed on this page. One benefit of looking at the monthly CPS data is that it is more up-to-date than the ACS data. The most recent ACS data currently is for 2017 but the CPS data is released each month. In addition, calculations from the CPS can be used to verify calculations from the ACS and vice-versa. For example, following is citizenship and gender data for software developers, taken from the monthly CPS data:
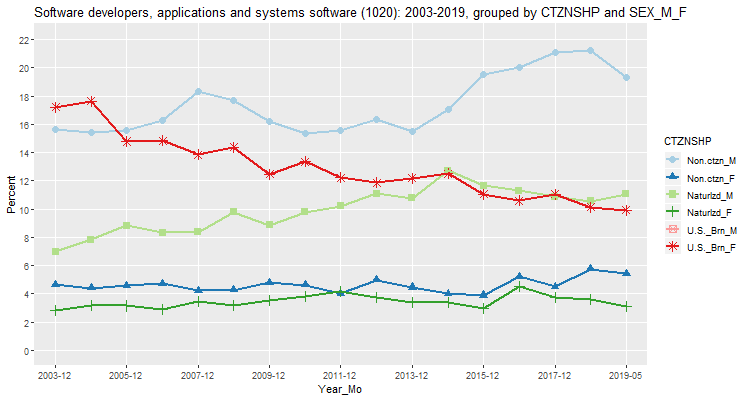
CURRENT POPULATION SURVEY: 2003-2019

Software developers, applications and systems software (1020): 2003-2019, grouped by CTZNSHP and SEX_M_F (percent)

   Year_Mo       Count Non.ctzn_M Non.ctzn_F Naturlzd_M Naturlzd_F U.S._Brn_M U.S._Brn_F
1  2003-12   789,300.4       15.7        4.6        7.0        2.8       52.7       17.2
2  2004-12   826,012.9       15.4        4.4        7.8        3.2       51.6       17.6
3  2005-12   829,376.7       15.5        4.6        8.8        3.1       53.1       14.8
4  2006-12   840,951.6       16.2        4.7        8.3        2.9       53.0       14.8
5  2007-12   897,492.7       18.3        4.2        8.4        3.5       51.8       13.8
6  2008-12 1,022,126.3       17.7        4.3        9.8        3.2       50.7       14.4
7  2009-12   977,798.8       16.2        4.8        8.8        3.5       54.2       12.4
8  2010-12 1,058,265.1       15.4        4.6        9.8        3.8       53.1       13.4
9  2011-12 1,057,407.3       15.6        4.0       10.2        4.2       53.9       12.2
10 2012-12 1,099,318.2       16.3        5.0       11.1        3.8       52.0       11.9
11 2013-12 1,127,604.3       15.5        4.4       10.8        3.4       53.8       12.2
12 2014-12 1,257,474.0       17.0        4.0       12.7        3.4       50.4       12.5
13 2015-12 1,369,566.0       19.6        3.9       11.7        2.9       50.9       11.1
14 2016-12 1,492,461.4       20.0        5.2       11.3        4.5       48.4       10.6
15 2017-12 1,550,126.0       21.1        4.5       10.9        3.8       48.8       11.0
16 2018-12 1,700,895.9       21.3        5.7       10.5        3.6       48.8       10.1
17 2019-05 1,786,337.7       19.3        5.4       11.1        3.1       51.1        9.9

URL parameters (short)=
?minyear=2003&maxyear=2019&STATE=&geo=NATION&occ=Software%20developers,%20applications%20and%20systems%20software%20(1020)&empstat=In%20labor%20force&group=CTZNSHP|SEX_M_F&sortn=2&sortdir=Ascending&ymax=22&color=Paired&geomtype=Line%20Graph
Following are the changes to the default settings in the left panel to create these numbers and graph:
First Year: 2003
Last Year:  2019
Months: 12 (this causes all 12 months of data to be treated as one set of data, labelled as the final month)
Occupation: Software developers, applications and system software (1020)
Group by: CTZNSHP|SEX_M_F
X Step: 2 (this causes every other label to be printed on the x-axis)
Y Min: 0
Y Max: 22
Y Step: 2
Color: Paired
Plot Type: Line Graph
Following is the line for 2017, followed by the corresponding data taken from the 2017 ACS:
   Year_Mo       Count Non.ctzn_M Non.ctzn_F Naturlzd_M Naturlzd_F U.S._Brn_M U.S._Brn_F
15 2017-12 1,550,126.0       21.1        4.5       10.9        3.8       48.8       11.0
ACS 2017   1,165,574         19.1        5.1       11.5        3.6       50.0       10.7
The main difference between the numbers is the Count. It differs by about 33 percent and the reason for this large of a difference is not totally clear. It could be something about the way that the CPS and ACS ask the survey-taker to identify their occupation causes more takers of the CPS to identify themselves as software developers. In any event, the differences in the percentages are much smaller, the largest being about 13 percent for non-citizen females. These smaller observed differences in the percentages are likely due to the fact that they come from different surveys with different methodologies.
As can be seen in the above graph, one of the most observable trends is that the percentage of software developers who are US-born females continues to go down, dropping steadily from about 17 percent of software developers in 2003 to about 10 percent now. Also observable is the increase in naturalized male developers from about 7 percent in 2003 to 11 percent in 2012 at which point it stabilized. Finally, the percentage of non-citizen males seemed to be fairly stable until 2013 but then increased to about 21 percent in 2018. It did drop back to about 19 percent in 2019. The graph does omit US-born males in order to focus on the other categories. However, the table showed that their percentage declined very slightly from about 53 to about 51 percent.
This application is under continuing development. If anyone should run into any issues or have any suggestions for additional features, feel free to let me know via the Contact box at the bottom of this page.