If you google "tech unemployment" (without the quotes), you'll find a number of articles written in June and July of 2019 which refer to tech unemployment reaching a record low. The publications which posted the articles include The Wall Street Journal, Fortune, Yahoo Finance (quoting Fortune), Dice Insights and many others. The original source for the data appears to be the Computing Technology Industry Association (CompTIA), self-described as "a leading voice and advocate for the $5 trillion global information technology ecosystem". The The Wall Street Journal article states:
Tech trade group CompTIA estimates that the unemployment rate for IT occupations in the U.S. dropped to 1.3% in May, a 20-year low, according to an analysis of the latest Labor Department jobs data.
As a result, employers are competing for a diminishing pool of talent. “The demand for tech talent has reached historic levels,” said Tim Herbert, the group’s executive vice president for research and market intelligence.
The CompTIA article gives some prior numbers, stating:
At 1.3 percent tech occupation unemployment is at its lowest rate going back to January 2000, the earliest available detailed occupation-level data from the BLS. The previous low of 1.4 percent occurred in March 2018 and April 2007.
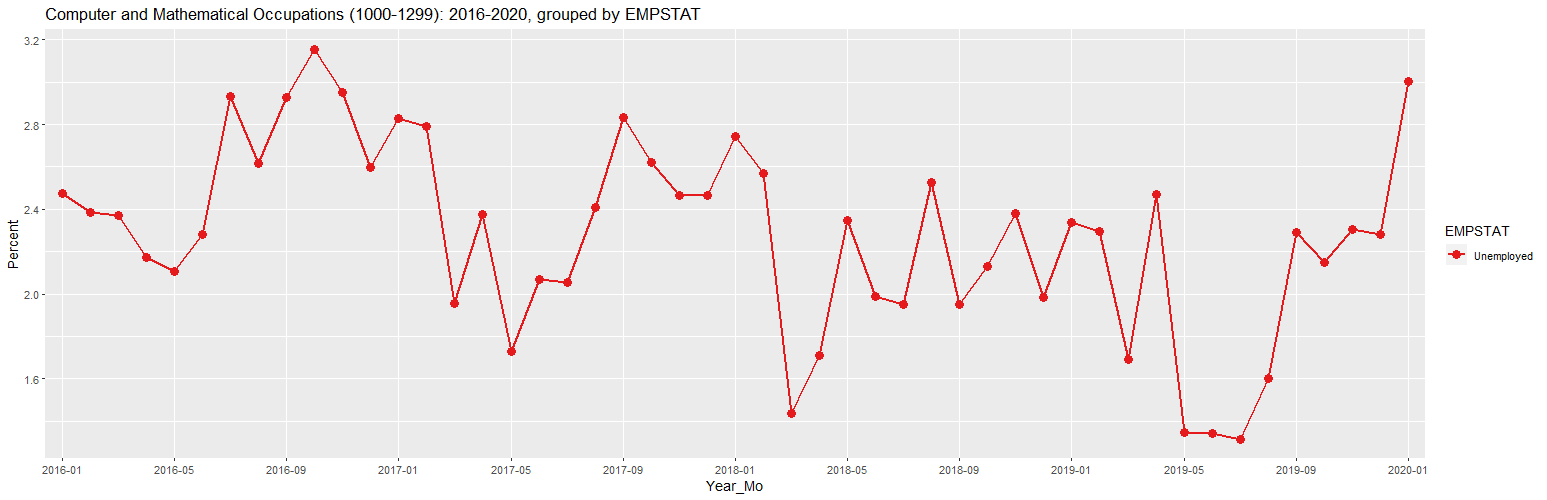
The following graph and table were generated using data from the IPUMS Current Population Survey (CPS) website:
CURRENT POPULATION SURVEY: 2016-2020

Computer and Mathematical Occupations (1000-1299): 2016-2020, grouped by EMPSTAT (percent)

   Year_Mo     Count Employed Unemployed
1  2016-01 4,644,692     97.5        2.5
2  2016-02 4,800,642     97.6        2.4
3  2016-03 4,702,703     97.6        2.4
4  2016-04 4,558,115     97.8        2.2
5  2016-05 4,457,227     97.9        2.1
6  2016-06 4,558,584     97.7        2.3
7  2016-07 4,502,332     97.1        2.9
8  2016-08 4,679,768     97.4        2.6
9  2016-09 4,570,992     97.1        2.9
10 2016-10 4,673,003     96.8        3.2
11 2016-11 4,804,564     97.0        3.0
12 2016-12 4,914,852     97.4        2.6
13 2017-01 4,821,896     97.2        2.8
14 2017-02 4,736,217     97.2        2.8
15 2017-03 4,664,857     98.0        2.0
16 2017-04 4,797,708     97.6        2.4
17 2017-05 4,675,877     98.3        1.7
18 2017-06 4,787,297     97.9        2.1
19 2017-07 4,718,601     97.9        2.1
20 2017-08 4,842,177     97.6        2.4
21 2017-09 4,959,509     97.2        2.8
22 2017-10 4,897,268     97.4        2.6
23 2017-11 5,110,318     97.5        2.5
24 2017-12 5,087,143     97.5        2.5
25 2018-01 5,255,328     97.3        2.7
26 2018-02 5,310,304     97.4        2.6
27 2018-03 5,202,590     98.6        1.4
28 2018-04 5,074,713     98.3        1.7
29 2018-05 5,072,349     97.7        2.3
30 2018-06 4,981,258     98.0        2.0
31 2018-07 5,053,226     98.1        1.9
32 2018-08 5,192,383     97.5        2.5
33 2018-09 5,076,657     98.0        2.0
34 2018-10 5,171,995     97.9        2.1
35 2018-11 5,244,786     97.6        2.4
36 2018-12 5,266,714     98.0        2.0
37 2019-01 5,228,613     97.7        2.3
38 2019-02 5,502,596     97.7        2.3
39 2019-03 5,286,358     98.3        1.7
40 2019-04 5,276,328     97.5        2.5
41 2019-05 5,315,334     98.7        1.3
42 2019-06 5,408,982     98.7        1.3
43 2019-07 5,557,570     98.7        1.3
44 2019-08 5,630,812     98.4        1.6
45 2019-09 5,476,433     97.7        2.3
46 2019-10 5,333,382     97.9        2.1
47 2019-11 5,264,513     97.7        2.3
48 2019-12 5,306,613     97.7        2.3
49 2020-01 5,693,551     97.0        3.0

URL parameters (short)=
?minyear=2016&maxyear=2020&STATE=&geo=NATION&occ=Computer%20and%20Mathematical%20Occupations%20(1000-1299)&empstat=In%20labor%20force&group=EMPSTAT&sortn=2&sortdir=Ascending&color=Set1&geomtype=Line%20Graph
The graph and table show the unemployment rate for the "Computer and Mathematical Occupations" as defined at ACS OCCUPATION CODES (OCC) - 2000-2017 and OCCUPATION CODES: 2011+. This seems to be the "tech occupations" referred to by the CompTIA article resulting in unemployment rates of 1.4 percent for March 2018 and 1.3 percent for May of 2019, identical to those given in the article. However, the graph and table show that this unemployment rate had risen to 3.0 percent by January 2020, the highest level since November of 2016. I could not find any CompTIA article that reports the 3.0 unemployment rate. In fact, a Feb 7th press release is titled "US Tech Hiring Rebounds in January, CompTIA Analysis Reveals" but makes no mention of the 3.0 percent unemployment rate. However, a Jan 10th press release did mention the 2.3 percent unemployment rate in December. But judging from the original google of "tech unemployment" above, few, if any, major publications reported it.
The Feb 7th CompTIA press release does include a footnote that states "[1] The IT occupation data should be viewed as a directional indicator, as there tends to be a higher degree of variance with monthly Bureau of Labor Statistics data at the occupation level." This variance can be better seen in the following graph which shows to tech unemployment rate since 2003:
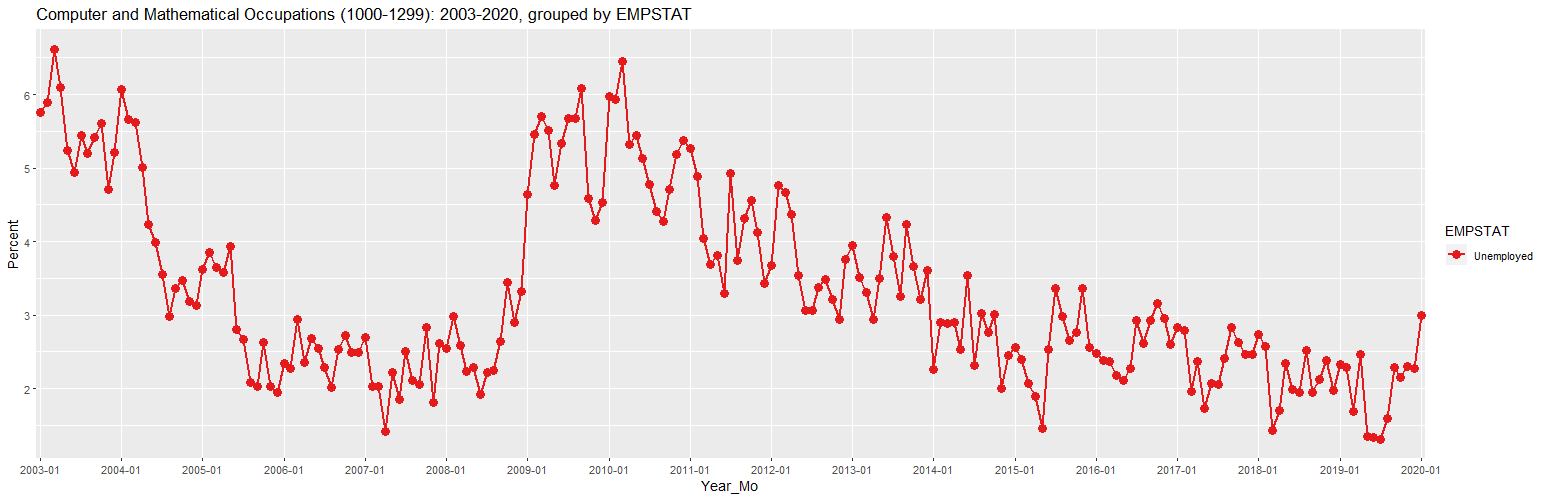
As can be seen, tech unemployment did drop following the tech crash in 2001 and then grew sharply during the financial crisis of 2008. Since then, it has generally dropped though there appears to be something of a recent uptick. Hence, it does appear that the unemployment data needs to be viewed over several months at least to give perspective. Instead, all of the major publications seemed to focus on the low figure of a single month and then ignore the numbers as they increased in the following months.
In fact, there is an additional limitation in looking at the unemployment rate of a specific occupation versus looking at the overall unemployment rate. If a recent tech graduate is unable to find a job in their field, they may continue to look exclusively in their field for a time but they will likely accept a job outside their field within a few months, even if they keep looking for a job within their field. Likewise, and older worker who is laid off may look for a job in their field exclusively for a time but will likely eventually accept a job outside their field or, if they can afford it, retire. Neither of these groups will show up in the tech unemployment numbers once they find a job outside their field or retire. Hence, the unemployment rates for an occupation give little indication of how many workers may have been driven out of their field.
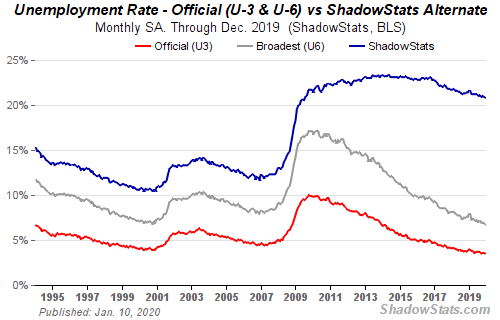
Another problem is that there is no one definition of unemployment that captures everything that is happening in the employment market. The following graph from John Williams' Shadow Government Statistics shows the official U-3 and the broadest U-6 government measures of unemployment. It also shows John William's "Shadow Stats Alternate" which he says "reflects current unemployment reporting methodology adjusted for SGS-estimated long-term discouraged workers, who were defined out of official existence in 1994." This measure is especially interesting as it suggests that employment never fully recovered following the financial crisis. Of course, this is not an official government measure and is debatable. But even the official government measure suggest that the unemployment rate is not a simple measurement that summarizes the entire employment situation.