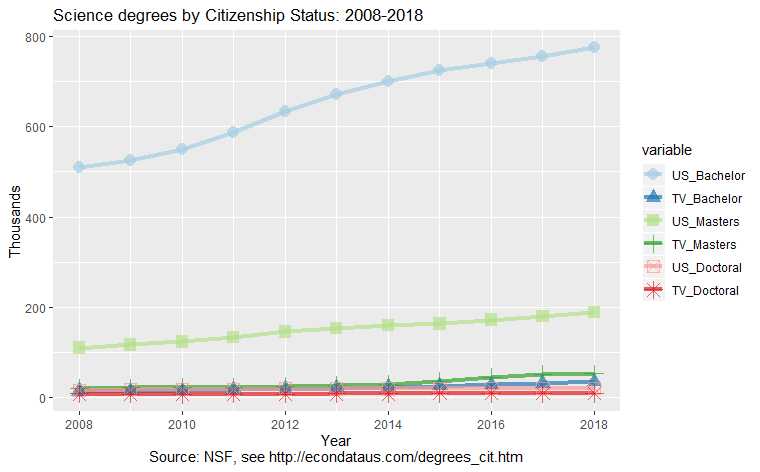
             U.S.   Temp Visa        U.S.   Temp Visa        U.S.   Temp Visa
 Year    Bachelor    Bachelor     Masters     Masters    Doctoral    Doctoral
 ----  ----------  ----------  ----------  ----------  ----------  ----------
 2008     508,721      13,848     110,233      20,261      16,911       8,553
 2009     524,525      14,700     116,899      22,087      17,937       8,349
 2010     549,620      15,424     123,610      22,458      18,074       7,809
 2011     588,000      17,363     133,686      23,949      18,613       8,021
 2012     633,816      19,530     145,824      25,548      19,278       8,374
 2013     671,975      21,761     153,648      27,576      19,694       8,676
 2014     700,271      23,777     159,658      29,681      19,818       8,764
 2015     723,735      26,117     163,480      36,427      20,299       8,902
 2016     739,166      29,247     172,114      46,063      20,877       9,469
 2017     754,929      32,201     180,144      52,139      21,135       9,086
 2018     774,136      35,846     188,586      52,815      21,255       9,640

Sources: National Science Foundation:  Bachelor's degrees, Master's degrees, Doctoral degrees
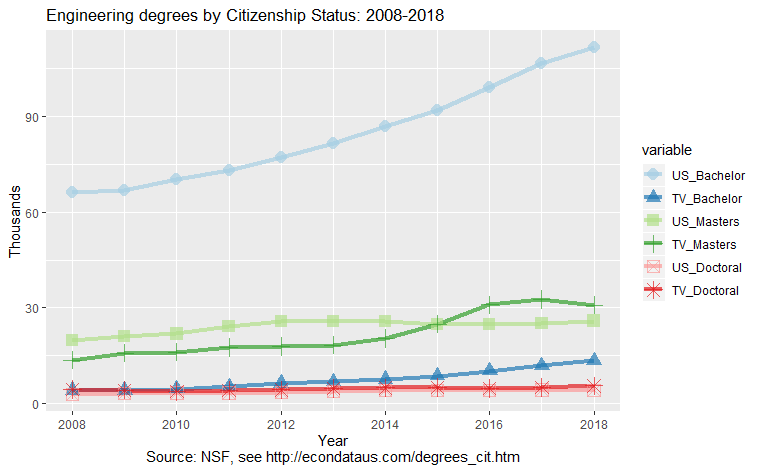
             U.S.   Temp Visa        U.S.   Temp Visa        U.S.   Temp Visa
 Year    Bachelor    Bachelor     Masters     Masters    Doctoral    Doctoral
 ----  ----------  ----------  ----------  ----------  ----------  ----------
 2008      66,009       4,223      19,903      13,610       2,958       4,492
 2009      66,863       4,128      21,100      15,809       3,166       4,221
 2010      70,209       4,569      21,840      16,189       3,332       3,866
 2011      73,172       5,330      24,093      17,658       3,350       4,164
 2012      77,233       6,403      25,777      17,988       3,579       4,355
 2013      81,372       6,829      25,671      18,366       3,767       4,759
 2014      86,748       7,638      25,658      20,371       4,066       4,961
 2015      91,669       8,647      24,918      24,937       4,219       5,108
 2016      99,167      10,206      24,902      31,005       4,180       4,842
 2017     106,471      11,908      25,126      32,628       4,311       5,038
 2018     111,402      13,392      25,888      30,868       4,218       5,583

Sources: National Science Foundation:  Bachelor's degrees, Master's degrees, Doctoral degrees
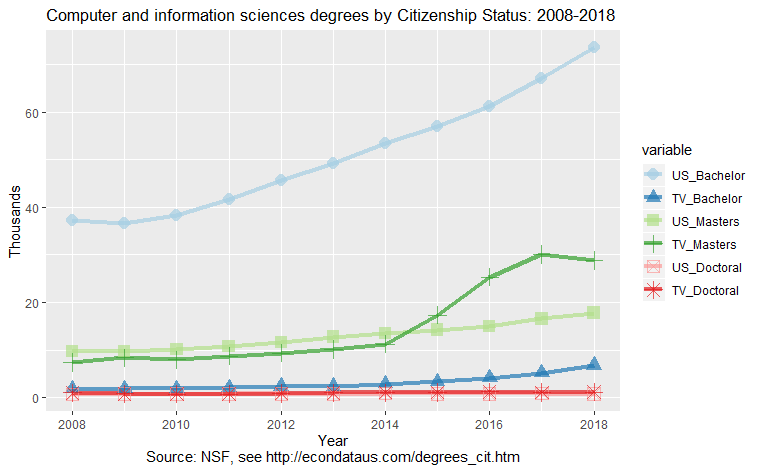
             U.S.   Temp Visa        U.S.   Temp Visa        U.S.   Temp Visa
 Year    Bachelor    Bachelor     Masters     Masters    Doctoral    Doctoral
 ----  ----------  ----------  ----------  ----------  ----------  ----------
 2008      37,118       1,804       9,746       7,405         697       1,005
 2009      36,677       1,819       9,641       8,347         734         791
 2010      38,240       1,867      10,066       7,955         761         760
 2011      41,558       2,028      10,786       8,733         790         759
 2012      45,672       2,362      11,650       9,365         785         870
 2013      49,204       2,382      12,725      10,108         758         990
 2014      53,311       2,819      13,409      11,226         807       1,029
 2015      56,940       3,369      14,199      17,353         774       1,094
 2016      61,100       4,086      14,900      25,311         783       1,201
 2017      66,988       5,141      16,542      30,073         801       1,105
 2018      73,474       6,797      17,750      28,818         743       1,166

Sources: National Science Foundation:  Bachelor's degrees, Master's degrees, Doctoral degrees
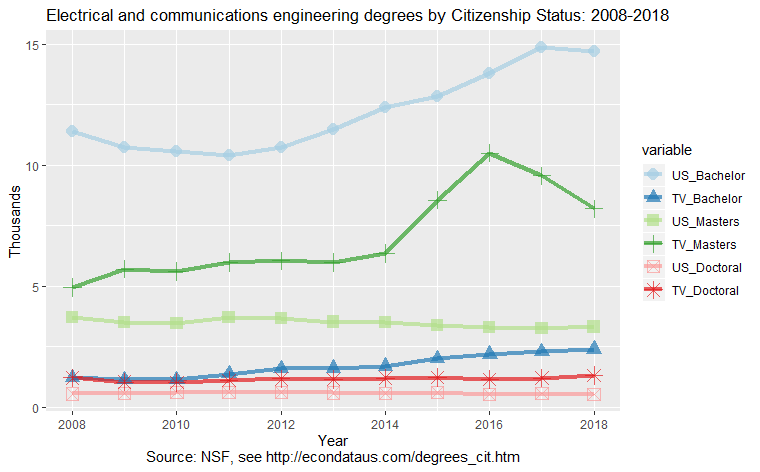
             U.S.   Temp Visa        U.S.   Temp Visa        U.S.   Temp Visa
 Year    Bachelor    Bachelor     Masters     Masters    Doctoral    Doctoral
 ----  ----------  ----------  ----------  ----------  ----------  ----------
 2008      11,404       1,230       3,706       4,951         558       1,219
 2009      10,733       1,150       3,498       5,706         578       1,050
 2010      10,551       1,142       3,474       5,612         627       1,040
 2011      10,403       1,376       3,720       5,994         617       1,109
 2012      10,754       1,601       3,675       6,052         614       1,181
 2013      11,483       1,608       3,527       5,979         603       1,160
 2014      12,369       1,700       3,495       6,349         575       1,217
 2015      12,845       2,003       3,371       8,560         632       1,237
 2016      13,775       2,191       3,292      10,504         547       1,160
 2017      14,845       2,294       3,262       9,561         581       1,216
 2018      14,711       2,400       3,326       8,203         544       1,319

Sources: National Science Foundation:  Bachelor's degrees, Master's degrees, Doctoral degrees
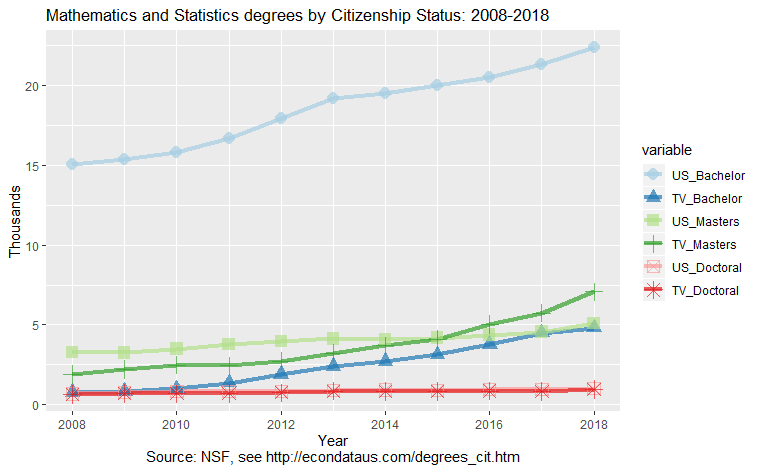
             U.S.   Temp Visa        U.S.   Temp Visa        U.S.   Temp Visa
 Year    Bachelor    Bachelor     Masters     Masters    Doctoral    Doctoral
 ----  ----------  ----------  ----------  ----------  ----------  ----------
 2008      15,079         762       3,268       1,884         673         651
 2009      15,369         839       3,245       2,214         772         713
 2010      15,824       1,008       3,480       2,478         838         686
 2011      16,665       1,356       3,765       2,438         813         690
 2012      17,929       1,890       3,961       2,723         842         747
 2013      19,175       2,392       4,120       3,226         873         843
 2014      19,523       2,703       4,092       3,692         931         821
 2015      20,002       3,134       4,177       4,092         889         823
 2016      20,525       3,768       4,366       5,024         946         852
 2017      21,322       4,486       4,550       5,744         947         821
 2018      22,356       4,805       5,084       7,069         996         964

Sources: National Science Foundation:  Bachelor's degrees, Master's degrees, Doctoral degrees
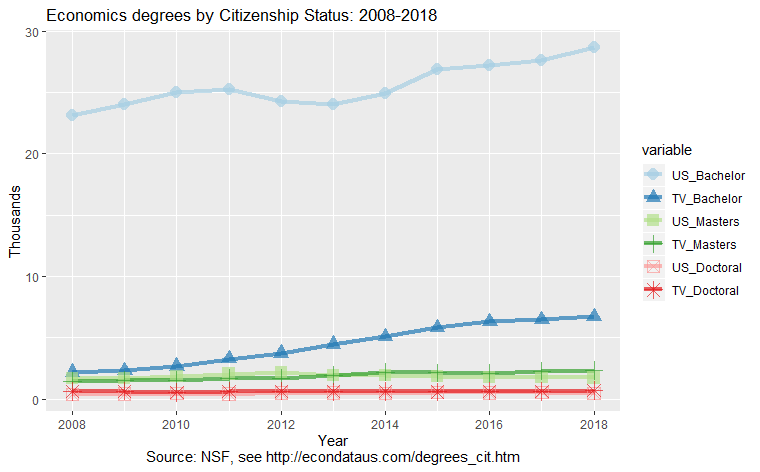
             U.S.   Temp Visa        U.S.   Temp Visa        U.S.   Temp Visa
 Year    Bachelor    Bachelor     Masters     Masters    Doctoral    Doctoral
 ----  ----------  ----------  ----------  ----------  ----------  ----------
 2008      23,124       2,184       1,709       1,481         405         621
 2009      23,994       2,338       1,707       1,530         418         656
 2010      24,981       2,677       1,832       1,526         459         556
 2011      25,284       3,277       2,053       1,683         428         623
 2012      24,295       3,741       2,173       1,724         517         656
 2013      24,032       4,467       1,931       1,944         505         615
 2014      24,940       5,085       1,917       2,203         469         627
 2015      26,898       5,826       1,852       2,146         552         606
 2016      27,199       6,316       1,798       2,136         521         656
 2017      27,583       6,480       1,752       2,293         547         641
 2018      28,634       6,729       1,747       2,357         484         707

Sources: National Science Foundation:  Bachelor's degrees, Master's degrees, Doctoral degrees
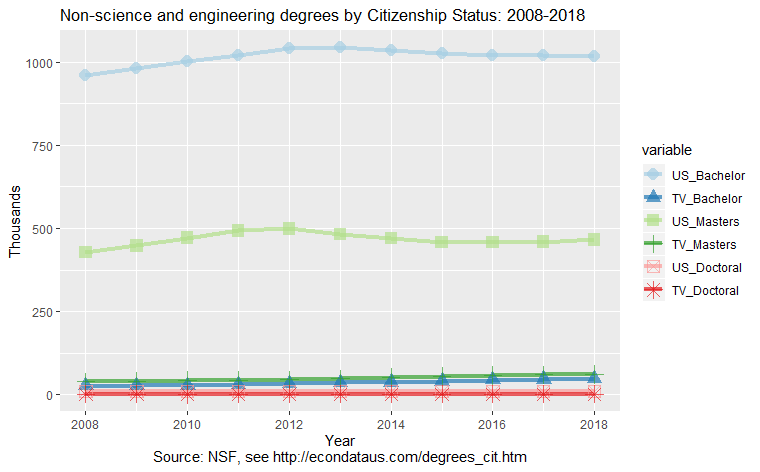
             U.S.   Temp Visa        U.S.   Temp Visa        U.S.   Temp Visa
 Year    Bachelor    Bachelor     Masters     Masters    Doctoral    Doctoral
 ----  ----------  ----------  ----------  ----------  ----------  ----------
 2008     961,277      26,335     428,708      38,996      10,975       2,216
 2009     981,706      27,106     447,824      41,754      11,224       2,166
 2010   1,000,800      27,605     471,624      42,807      10,196       1,961
 2011   1,020,363      30,001     492,759      44,310       9,762       2,050
 2012   1,040,772      33,650     498,710      45,691      10,124       2,055
 2013   1,042,786      36,311     483,167      48,547      10,503       2,239
 2014   1,034,439      38,068     470,652      53,776      10,120       2,114
 2015   1,025,086      40,875     458,434      55,784      10,553       2,119
 2016   1,019,500      44,854     458,235      58,918      10,614       2,163
 2017   1,020,284      47,319     459,358      60,713      10,292       2,166
 2018   1,017,783      49,051     466,063      61,401       9,931       2,381

Sources: National Science Foundation:  Bachelor's degrees, Master's degrees, Doctoral degrees