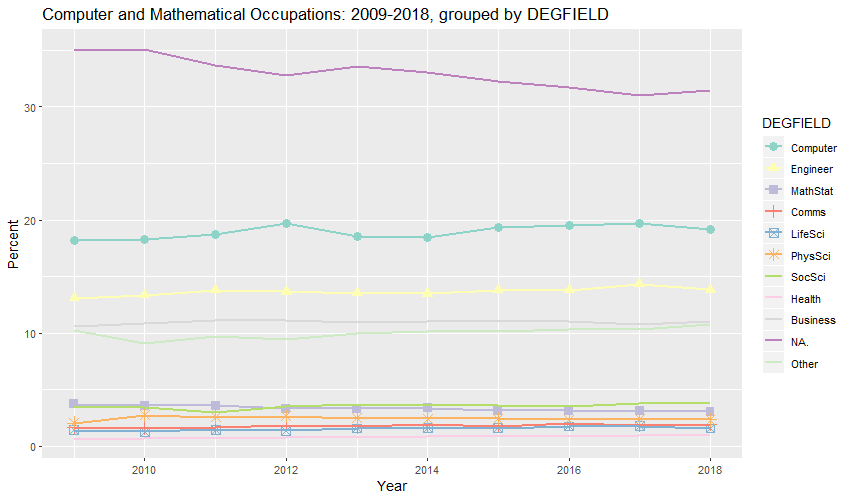
The graph and table below show that, from 2009 to 2018, just under 20 percent of workers in computer and mathematical occupations had degrees in Computer and Information Sciences. About 14 percent had degrees in Engineering and 11 percent had degrees in Business. Over 30 percent had no degree at all though this percentage did drop from 35.0 percent in 2009 to 31.5 percent in 2018. The rest had degrees in other areas.
Computer and Mathematical Occupations: 2009-2018, grouped by DEGFIELD (percent)

   Year     Count Computer Engineer MathStat Comms LifeSci PhysSci SocSci Health Business  NA. Other
1  2009 3,503,119     18.2     13.1      3.7   1.6     1.4     2.0    3.5    0.6     10.6 35.0  10.2
2  2010 3,441,249     18.3     13.3      3.6   1.6     1.3     2.7    3.4    0.7     10.9 35.1   9.1
3  2011 3,564,940     18.7     13.8      3.6   1.7     1.5     2.6    3.0    0.7     11.1 33.7   9.7
4  2012 3,715,877     19.7     13.7      3.3   1.8     1.4     2.6    3.5    0.8     11.1 32.8   9.4
5  2013 3,885,355     18.5     13.5      3.3   1.7     1.6     2.5    3.7    0.8     10.9 33.6  10.0
6  2014 4,131,948     18.4     13.5      3.4   1.9     1.6     2.4    3.6    0.9     11.1 33.1  10.2
7  2015 4,277,007     19.3     13.8      3.2   1.8     1.6     2.4    3.6    0.9     11.0 32.2  10.2
8  2016 4,525,376     19.5     13.8      3.2   2.0     1.7     2.3    3.5    0.9     11.1 31.7  10.3
9  2017 4,754,009     19.7     14.3      3.1   1.8     1.8     2.4    3.7    1.0     10.8 31.0  10.3
10 2018 5,033,745     19.2     13.8      3.1   2.0     1.6     2.3    3.7    1.0     11.0 31.5  10.8

URL parameters (short)=
?minyear=2009&maxyear=2018&STATE=&geo=NATION&occ=Computer%20and%20Mathematical%20Occupations&group=DEGFIELD&sortn=4
Computer and Mathematical Occupations: 2009-2018, grouped by DEGFIELD (count)

   Year     Count Computer Engineer MathStat  Comms LifeSci PhysSci  SocSci Health Business       NA.   Other
1  2009 3,503,119  638,038  457,520  129,707 56,502  49,060  71,638 121,999 22,164  371,683 1,226,156 358,652
2  2010 3,441,249  630,448  459,092  122,564 54,433  44,330  93,812 116,607 23,628  374,344 1,208,138 313,853
3  2011 3,564,940  666,823  491,066  127,302 58,915  52,191  91,860 107,722 25,088  396,553 1,201,451 345,969
4  2012 3,715,877  730,337  507,272  122,581 68,670  50,613  98,196 129,411 28,057  412,884 1,217,981 349,875
5  2013 3,885,355  719,953  525,077  128,064 66,368  60,757  96,738 142,026 30,362  423,671 1,303,597 388,742
6  2014 4,131,948  761,076  556,609  139,579 78,063  67,878  99,664 148,439 36,671  457,367 1,365,838 420,764
7  2015 4,277,007  825,944  590,661  134,800 75,938  68,760 103,633 153,530 39,353  471,464 1,378,660 434,264
8  2016 4,525,376  882,497  623,706  142,658 89,688  79,081 105,775 160,314 39,611  500,699 1,435,189 466,158
9  2017 4,754,009  938,019  681,512  147,370 87,384  84,758 116,001 177,818 45,882  512,859 1,472,348 490,058
10 2018 5,033,745  965,895  695,542  154,070 98,683  78,641 116,950 188,157 51,294  555,456 1,585,556 543,501

URL parameters (short)=
?minyear=2009&maxyear=2018&STATE=&units=Count&geo=NATION&occ=Computer%20and%20Mathematical%20Occupations&group=DEGFIELD&sortn=4&geomtype=Line%20Graph
The occupations of Programmers, Software Developers, App & System Software is a narrow subset of Computer and Mathematical Occupations and seems to require more expertise, on average. Still, the graph and table below show that, from 2009 to 2018, just under 30 percent of workers in these occupations had degrees in Computer and Information Sciences. About 23 percent had degrees in Engineering and 8 percent had degrees in Business. Over 17 percent had no degree at all though this percentage did drop from 22.3 percent in 2009 to 17.7 percent in 2018. The rest had degrees in other areas.
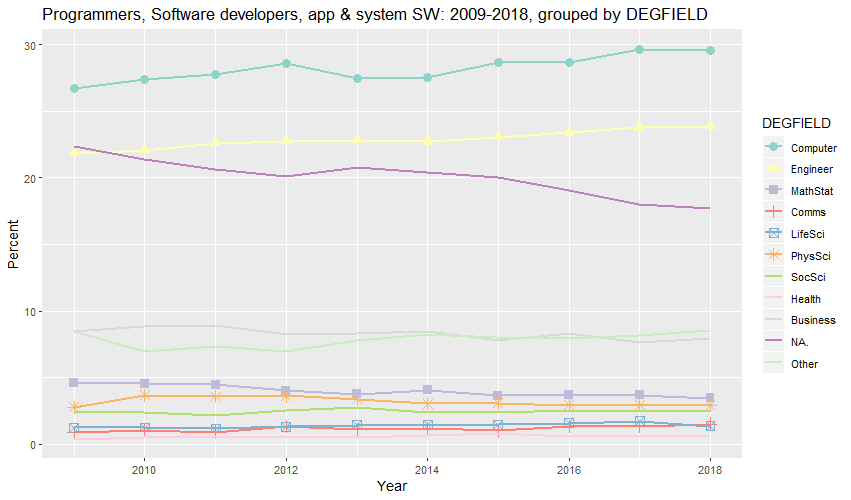
Programmers, Software developers, app & system SW: 2009-2018, grouped by DEGFIELD (percent)

   Year     Count Computer Engineer MathStat Comms LifeSci PhysSci SocSci Health Business  NA. Other
1  2009 1,328,106     26.7     21.8      4.6   0.9     1.2     2.8    2.4    0.4      8.4 22.3   8.5
2  2010 1,316,879     27.4     22.1      4.5   1.0     1.3     3.7    2.4    0.5      8.8 21.4   6.9
3  2011 1,344,062     27.7     22.6      4.5   0.9     1.2     3.6    2.2    0.6      8.9 20.6   7.3
4  2012 1,450,233     28.6     22.7      4.0   1.3     1.3     3.6    2.5    0.5      8.3 20.1   6.9
5  2013 1,482,323     27.4     22.8      3.7   1.1     1.4     3.4    2.8    0.5      8.3 20.7   7.8
6  2014 1,547,484     27.5     22.7      4.1   1.2     1.4     3.1    2.4    0.6      8.4 20.4   8.2
7  2015 1,630,845     28.7     23.1      3.6   1.0     1.5     3.1    2.4    0.8      7.8 20.0   8.0
8  2016 1,710,728     28.7     23.4      3.7   1.3     1.6     2.9    2.5    0.6      8.3 19.0   8.0
9  2017 1,804,227     29.7     23.8      3.7   1.3     1.7     3.0    2.5    0.6      7.6 18.0   8.2
10 2018 1,853,801     29.6     23.9      3.4   1.5     1.3     2.9    2.6    0.6      8.0 17.7   8.5

URL parameters (short)=
?minyear=2009&maxyear=2018&STATE=&geo=NATION&occ=Programmers,%20Software%20developers,%20app%20&%20system%20SW&group=DEGFIELD&sortn=4&geomtype=Line%20Graph
Programmers, Software developers, app & system SW: 2009-2018, grouped by DEGFIELD (count)

   Year     Count Computer Engineer MathStat  Comms LifeSci PhysSci SocSci Health Business     NA.   Other
1  2009 1,328,106  354,244  289,926   60,648 11,867  16,570  36,837 31,554  5,155  111,944 296,714 112,647
2  2010 1,316,879  360,467  290,873   59,592 13,806  16,555  48,386 31,445  6,680  116,232 281,457  91,386
3  2011 1,344,062  372,758  303,450   60,043 12,148  15,836  48,121 29,175  7,463  119,707 276,759  98,602
4  2012 1,450,233  414,877  329,614   58,204 19,124  19,071  52,827 36,926  7,463  120,001 291,458 100,668
5  2013 1,482,323  406,463  338,335   55,541 16,536  21,223  50,263 40,921  7,534  122,707 307,515 115,285
6  2014 1,547,484  425,723  351,308   62,695 18,429  22,029  47,210 37,022  9,872  130,655 315,520 127,021
7  2015 1,630,845  467,424  376,149   59,128 16,413  23,854  50,263 38,771 13,701  127,406 326,961 130,775
8  2016 1,710,728  490,189  400,280   63,777 23,009  26,830  50,278 43,043  9,460  142,309 325,545 136,008
9  2017 1,804,227  535,095  428,536   66,465 24,143  31,122  53,727 44,909 11,029  137,137 324,275 147,789
10 2018 1,853,801  547,935  442,659   63,762 27,953  24,937  53,845 47,528 11,494  147,579 327,752 158,357

URL parameters (short)=
?minyear=2009&maxyear=2018&STATE=&units=Count&geo=NATION&occ=Programmers,%20Software%20developers,%20app%20&%20system%20SW&group=DEGFIELD&sortn=4&geomtype=Line%20Graph
Code  Abbreviation  Full Title
----  ------------  ----------
21    Computer      Computer and Information Sciences
24,25 Engineer      Engineering and Engineering Technologies
37    MathStat      Mathematics and Statistics
19,20 Comms         Communications and Communication Technologies
36    LifeSci       Biology and Life Sciences
50,51 PhysSci       Physical Sciences; Nuclear, Industrial Radiology, and Biological Technologies
55    SocSci        Social Sciences
61    Health        Medical and Health Sciences and Services
62    Business      Busines
00    NA            Not Applicable (having no degree or no degree entered)
else  Other         Degree other than those listed above