1. Success in Replicating Tables 1 to 3 of the Study
As can be seen below, I was generally accurate in replicating the data from 2000 to 2010 but ran into some problems with 1980 to 1990. 1990 to 2000 had mixed results with a fair amount of accuracy in Table 1 but less in Tables 2 and 3. I used the same sources as the study and followed the data filtering as carefully as possible so I don't know what the problem is with the earlier data.
[1] "          Table 1: Summary Statistics, Percentage of Foreign-Born by Group           "
[1] "----  -------------------------  -------------------------  -------------------------"
[1] "           % Among College           %  Employment in       % Among College Educated "
[1] "         Educated Employment         STEM Occupations       Empl. in STEM Occupations"
[1] "----  -------------------------  -------------------------  -------------------------"
[1] "Year    Study     Calc   % Diff    Study     Calc   % Diff    Study     Calc   % Diff"
[1] "----  -------  -------  -------  -------  -------  -------  -------  -------  -------"
[1] "1980     8.01     9.59    19.66     9.27     9.28     0.16    12.18    16.81    38.04"
[1] "1990    10.51    10.53     0.19    12.63    12.48    -1.20    15.64    15.17    -3.02"
[1] "2000    14.75    14.75     0.01    19.66    19.58    -0.41    24.74    24.80     0.24"
[1] "2005    17.10    17.09    -0.05    22.74    22.91     0.76    28.40    28.66     0.91"
[1] "2010    17.74    17.76     0.13    23.95    23.91    -0.16    29.74    29.80     0.21"
[1] ""
[1] "Table 2: College Educated STEM Workers as % of Employment (219 Metro Areas)"
[1] "----------------------------------------------------------"
[1] "            Foreign STEM                Total STEM        "
[1] "----  -------------------------  -------------------------"
[1] "Year    Study     Calc   % Diff    Study     Calc   % Diff"
[1] "----  -------  -------  -------  -------  -------  -------"
[1] "1980     0.26     0.15   -41.32     2.11     0.88   -58.09"
[1] "1990     0.45     0.40   -11.48     2.90     2.59   -10.64"
[1] "2000     0.87     0.86    -0.64     3.52     3.48    -1.25"
[1] "2005     1.00     1.02     2.43     3.52     3.52    -0.12"
[1] "2010     1.10     1.09    -0.51     3.71     3.66    -1.28"
[1] ""
[1] "Table 3: Net Increase in College Educated STEM Workers (thousands)"
[1] "---------  -------------------------  -------------------------"
[1] "                Change in Total           Change in Foreign    "
[1] "             College Educated STEM      College Educated STEM  "
[1] "---------  -------------------------  -------------------------"
[1] "Year Span    Study     Calc   % Diff    Study     Calc   % Diff"
[1] "---------  -------  -------  -------  -------  -------  -------"
[1] "1980-1990      980     1594    62.63      204      229    12.04"
[1] "1990-2000     1114     1345    20.78      498      547     9.83"
[1] "2000-2005      254      247    -2.88      202      202    -0.17"
[1] "2005-2010      269      274     1.72      131      131    -0.15"
[1] ""
As can be seen below, the slopes of the regressions were generally within a power of two except for the last one. This is not too surprising as the study gave fewer specifics about some of the filtering, I used OLS instead of 2SLS regression, and didn't attempt to use H-1B Inputed Growth of Foreign-STEM as an explanatory variable.
[1] "                                   CORREL                                              "
[1] " N  INTERCEPT    SLOPE    STUDY     COEF   P-VALUE  DESCRIPTION                        "
[1] "--  ---------  --------  -------  -------  -------  -----------------------------------"
[1] "1990-2010, WEIGHTED WITH DUMMY VARIABLES"
[1] " 1)    1.7771    2.9172   6.6500   0.1951  1.0e-05  natstem_wkwage_chg ~ immig_stem_change + fspan + fmets"
[1] " 2)    6.9861    3.8844   8.0300   0.4449  1.7e-31  natcoll_wkwage_chg ~ immig_stem_change + fspan + fmets"
[1] " 3)    9.7421    1.9323   3.7800   0.3526  1.8e-25  natncol_wkwage_chg ~ immig_stem_change + fspan + fmets"
[1] " 4)    3.2045    8.0875   8.0300   0.4449  2.9e-30  natcoll_wkwage_chg ~ immig_stem_change, 1990-2010"
[1] " 5)    9.2601    6.2094            0.5148  4.6e-15  natcoll_wkwage_chg ~ immig_stem_change, 1990-2000"
[1] " 6)    3.6916   -1.1559           -0.0530  4.6e-01  natcoll_wkwage_chg ~ immig_stem_change, 2000-2005"
[1] " 7)   -0.7571    1.9272            0.0880  2.2e-01  natcoll_wkwage_chg ~ immig_stem_change, 2005-2010"
[1] " 8)    1.4166    0.7958   0.5300   0.4351  2.7e-37  native_stem_change ~ immig_stem_change + fspan + fmets"
[1] " 9)    5.3894    3.9624   2.4700   0.4392  3.0e-32  native_coll_change ~ immig_stem_change + fspan + fmets"
[1] "10)    9.8542    0.4187  -5.1700   0.1627  1.0e-05  native_ncol_change ~ immig_stem_change + fspan + fmets"
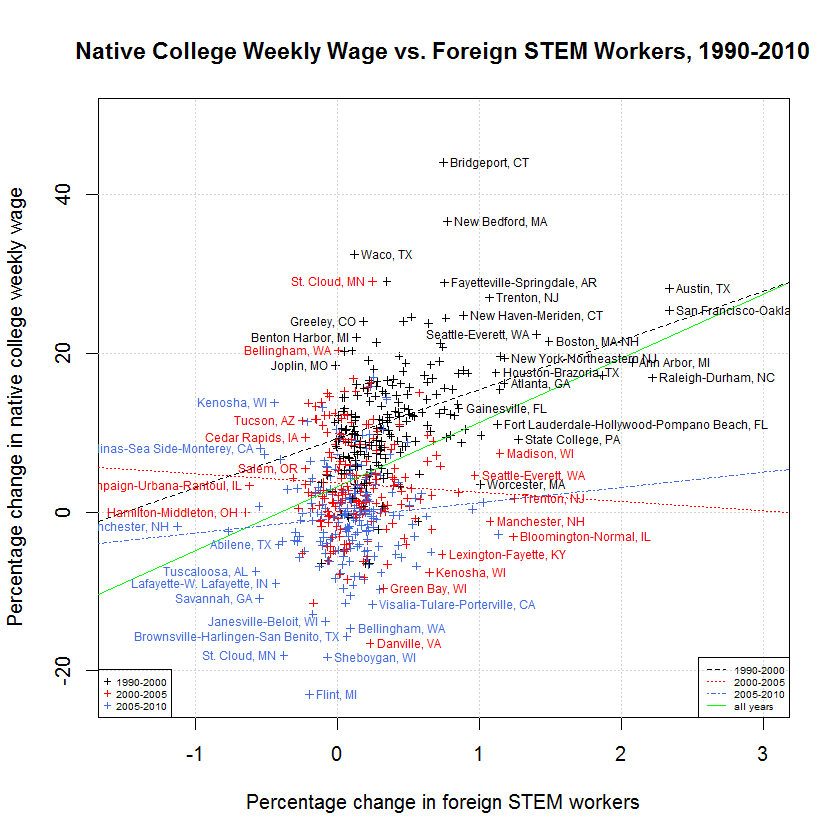
The following plot shows the relationship between the percentage change in the weekly wage of native college educated workers and the percentage change in the number of foreign STEM workers.
As can be seen, there was a relatively strong correlation while wages were increasing strongly during 1990 to 2000. However, wages appear to have generally stagnated in 2000 to 2005 and shrank in many areas in 2005-2010. In 2000-2005, there was a slightly negative correlation and in 2005-2010, there was a slightly positive correlation. This may represent an example of Simpson's Paradox in that the regression slope of each of the 3 time spans is less than the regression slope of the entire time period.