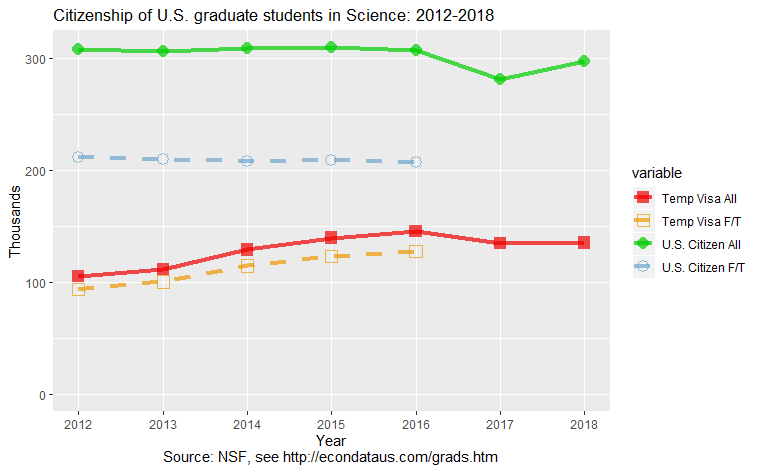
Citizenship of U.S. graduate students in Science: 2012-2018
            All U.S. Graduate Students       Full-time U.S. Graduate Students
        ----------------------------------  ----------------------------------
          Temporary Visa     U.S. Citizen     Temporary Visa    U.S. Citizen
        ----------------  ----------------  ----------------  ----------------
  Year    Count  Percent    Count  Percent    Count  Percent    Count  Percent
- ----  -------  -------  -------  -------  -------  -------  -------  -------
1 2012  104,991     25.4  308,042     74.6   93,679     30.7  211,116     69.3
2 2013  111,688     26.8  305,563     73.2  100,347     32.4  209,409     67.6
3 2014  128,896     29.5  308,499     70.5  114,615     35.5  208,099     64.5
4 2015  139,472     31.1  309,182     68.9  122,714     37.0  208,579     63.0
5 2016  145,336     32.2  306,710     67.8  127,542     38.1  207,228     61.9
6 2017  134,511     32.4  281,057     67.6       NA       NA       NA       NA
7 2018  134,978     31.2  297,277     68.8       NA       NA       NA       NA
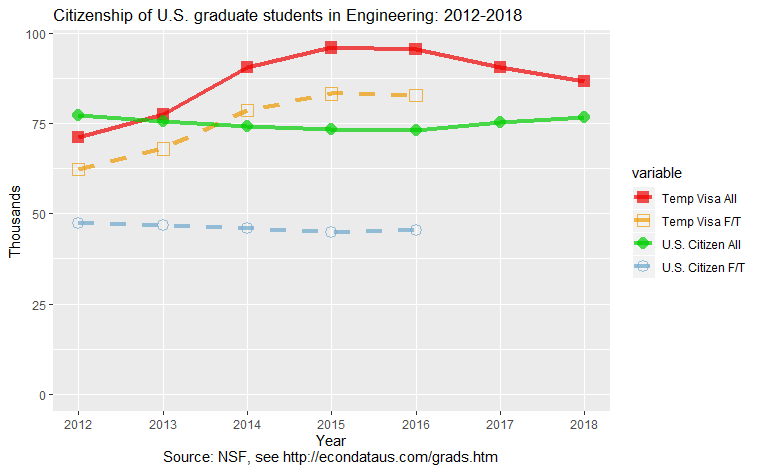
Citizenship of U.S. graduate students in Engineering: 2012-2018
            All U.S. Graduate Students       Full-time U.S. Graduate Students
        ----------------------------------  ----------------------------------
          Temporary Visa     U.S. Citizen     Temporary Visa    U.S. Citizen
        ----------------  ----------------  ----------------  ----------------
  Year    Count  Percent    Count  Percent    Count  Percent    Count  Percent
- ----  -------  -------  -------  -------  -------  -------  -------  -------
1 2012   71,084     47.9   77,301     52.1   62,228     56.8   47,361     43.2
2 2013   77,387     50.6   75,662     49.4   67,950     59.2   46,802     40.8
3 2014   90,475     55.0   74,013     45.0   78,595     63.2   45,787     36.8
4 2015   95,902     56.6   73,452     43.4   83,188     64.9   44,924     35.1
5 2016   95,404     56.6   73,039     43.4   82,718     64.5   45,485     35.5
6 2017   90,421     54.6   75,160     45.4       NA       NA       NA       NA
7 2018   86,531     53.0   76,770     47.0       NA       NA       NA       NA
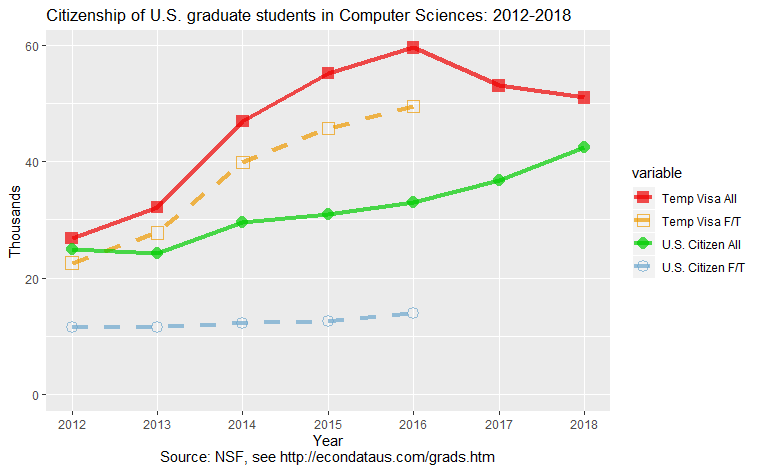
Citizenship of U.S. graduate students in Computer Sciences: 2012-2018
            All U.S. Graduate Students       Full-time U.S. Graduate Students
        ----------------------------------  ----------------------------------
          Temporary Visa     U.S. Citizen     Temporary Visa    U.S. Citizen
        ----------------  ----------------  ----------------  ----------------
  Year    Count  Percent    Count  Percent    Count  Percent    Count  Percent
- ----  -------  -------  -------  -------  -------  -------  -------  -------
1 2012   26,827     51.8   24,962     48.2   22,574     66.2   11,534     33.8
2 2013   32,148     57.1   24,191     42.9   27,787     70.8   11,481     29.2
3 2014   46,916     61.3   29,630     38.7   39,837     76.5   12,232     23.5
4 2015   55,165     64.0   31,027     36.0   45,790     78.5   12,539     21.5
5 2016   59,612     64.3   33,038     35.7   49,507     78.1   13,854     21.9
6 2017   53,062     59.0   36,847     41.0       NA       NA       NA       NA
7 2018   51,011     54.6   42,467     45.4       NA       NA       NA       NA
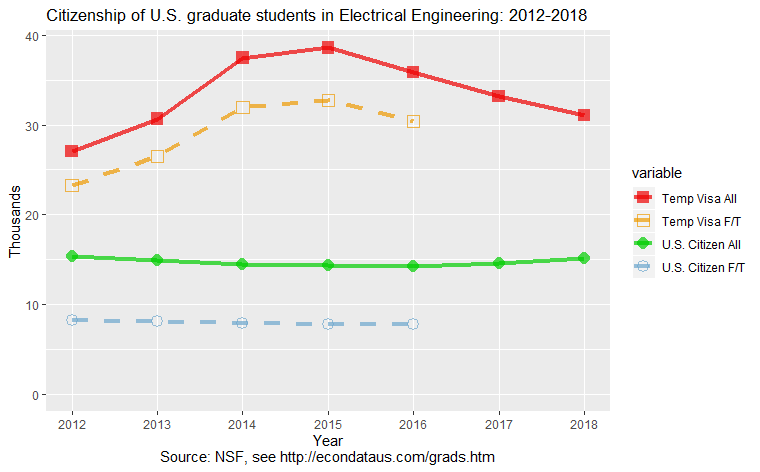
Citizenship of U.S. graduate students in Electrical Engineering: 2012-2018
            All U.S. Graduate Students       Full-time U.S. Graduate Students
        ----------------------------------  ----------------------------------
          Temporary Visa     U.S. Citizen     Temporary Visa    U.S. Citizen
        ----------------  ----------------  ----------------  ----------------
  Year    Count  Percent    Count  Percent    Count  Percent    Count  Percent
- ----  -------  -------  -------  -------  -------  -------  -------  -------
1 2012   27,046     63.9   15,301     36.1   23,248     73.7    8,278     26.3
2 2013   30,670     67.3   14,892     32.7   26,530     76.5    8,130     23.5
3 2014   37,455     72.2   14,454     27.8   31,943     80.1    7,925     19.9
4 2015   38,594     72.9   14,346     27.1   32,736     80.8    7,783     19.2
5 2016   35,871     71.7   14,191     28.3   30,400     79.7    7,758     20.3
6 2017   33,148     69.4   14,604     30.6       NA       NA       NA       NA
7 2018   31,045     67.2   15,182     32.8       NA       NA       NA       NA
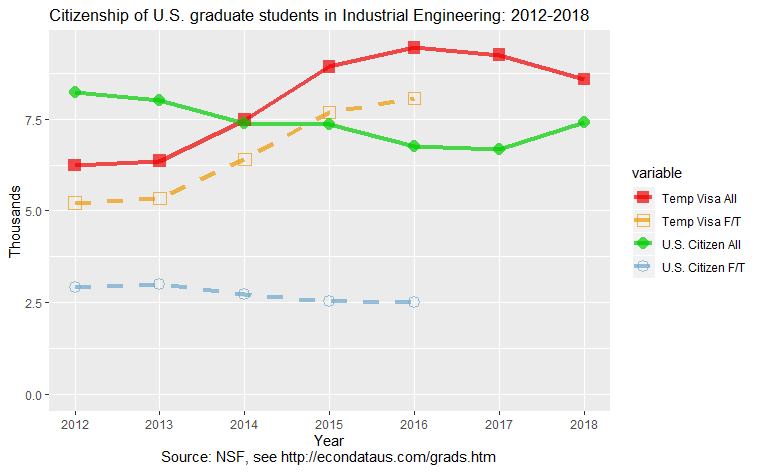
Citizenship of U.S. graduate students in Industrial Engineering: 2012-2018
            All U.S. Graduate Students       Full-time U.S. Graduate Students
        ----------------------------------  ----------------------------------
          Temporary Visa     U.S. Citizen     Temporary Visa    U.S. Citizen
        ----------------  ----------------  ----------------  ----------------
  Year    Count  Percent    Count  Percent    Count  Percent    Count  Percent
- ----  -------  -------  -------  -------  -------  -------  -------  -------
Citizenship of U.S. graduate students in Industrial Engineering: 2012-2018

Temporary Visa U.S. Citizen Temporary Visa U.S. Citizen
  Year IntCount IntPrcnt US_Count US_Prcnt IntFTCnt IntFTPct USFT_Cnt USFT_Pct
1 2012    6,236     43.1    8,233     56.9    5,213     64.2    2,902     35.8
2 2013    6,357     44.3    8,006     55.7    5,345     64.1    2,991     35.9
3 2014    7,473     50.3    7,372     49.7    6,394     70.2    2,712     29.8
4 2015    8,923     54.8    7,361     45.2    7,676     75.1    2,539     24.9
5 2016    9,441     58.3    6,759     41.7    8,069     76.3    2,513     23.7
6 2017    9,246     58.1    6,659     41.9       NA       NA       NA       NA
7 2018    8,582     53.7    7,405     46.3       NA       NA       NA       NA
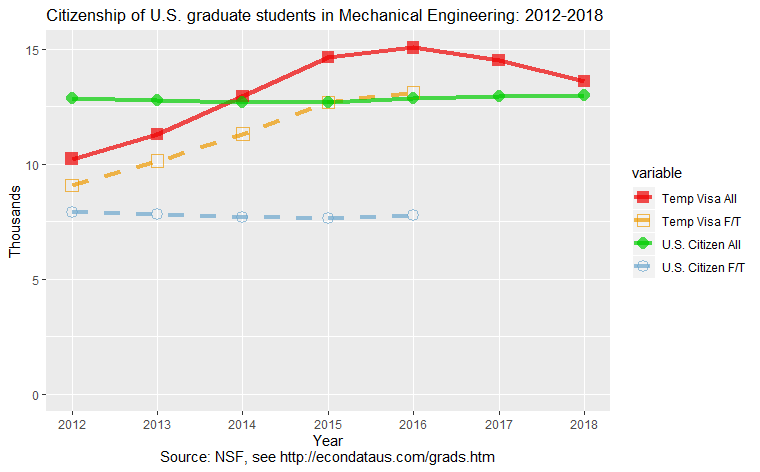
Citizenship of U.S. graduate students in Mechanical Engineering: 2012-2018
            All U.S. Graduate Students       Full-time U.S. Graduate Students
        ----------------------------------  ----------------------------------
          Temporary Visa     U.S. Citizen     Temporary Visa    U.S. Citizen
        ----------------  ----------------  ----------------  ----------------
  Year    Count  Percent    Count  Percent    Count  Percent    Count  Percent
- ----  -------  -------  -------  -------  -------  -------  -------  -------
1 2012   10,229     44.3   12,859     55.7    9,084     53.4    7,916     46.6
2 2013   11,296     46.9   12,791     53.1   10,143     56.5    7,797     43.5
3 2014   12,955     50.5   12,696     49.5   11,312     59.5    7,703     40.5
4 2015   14,635     53.6   12,679     46.4   12,676     62.4    7,644     37.6
5 2016   15,059     54.0   12,839     46.0   13,135     62.8    7,789     37.2
6 2017   14,500     52.9   12,928     47.1       NA       NA       NA       NA
7 2018   13,613     51.2   12,980     48.8       NA       NA       NA       NA
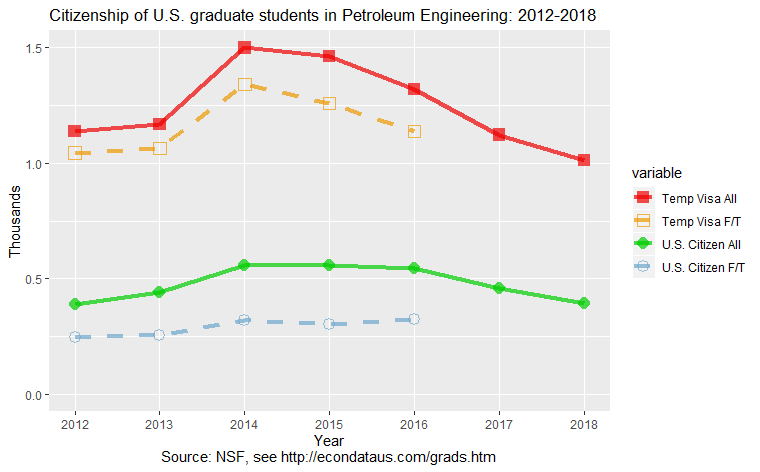
Citizenship of U.S. graduate students in Petroleum Engineering: 2012-2018
            All U.S. Graduate Students       Full-time U.S. Graduate Students
        ----------------------------------  ----------------------------------
          Temporary Visa     U.S. Citizen     Temporary Visa    U.S. Citizen
        ----------------  ----------------  ----------------  ----------------
  Year    Count  Percent    Count  Percent    Count  Percent    Count  Percent
- ----  -------  -------  -------  -------  -------  -------  -------  -------
Citizenship of U.S. graduate students in Petroleum Engineering: 2012-2018

Temporary Visa U.S. Citizen Temporary Visa U.S. Citizen
  Year IntCount IntPrcnt US_Count US_Prcnt IntFTCnt IntFTPct USFT_Cnt USFT_Pct
1 2012    1,136     74.5      389     25.5    1,044     81.0      245     19.0
2 2013    1,169     72.7      440     27.3    1,063     80.7      255     19.3
3 2014    1,499     72.9      557     27.1    1,342     80.7      320     19.3
4 2015    1,463     72.4      558     27.6    1,258     80.6      302     19.4
5 2016    1,318     70.8      544     29.2    1,138     77.9      323     22.1
6 2017    1,122     71.1      456     28.9       NA       NA       NA       NA
7 2018    1,012     72.1      391     27.9       NA       NA       NA       NA
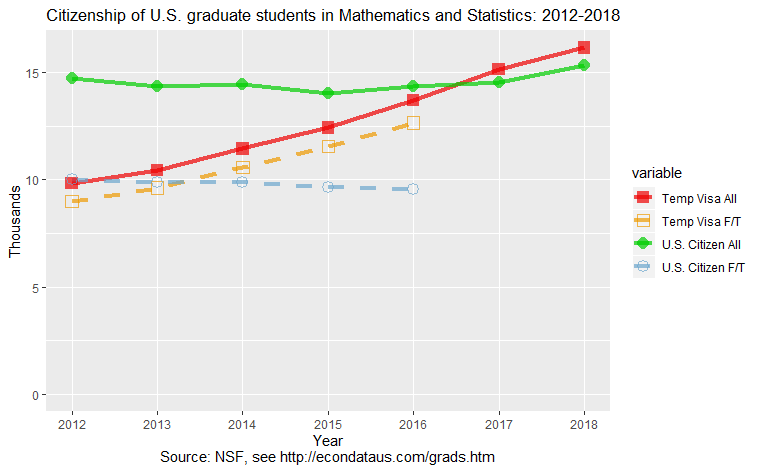
Citizenship of U.S. graduate students in Mathematics and Statistics: 2012-2018
            All U.S. Graduate Students       Full-time U.S. Graduate Students
        ----------------------------------  ----------------------------------
          Temporary Visa     U.S. Citizen     Temporary Visa    U.S. Citizen
        ----------------  ----------------  ----------------  ----------------
  Year    Count  Percent    Count  Percent    Count  Percent    Count  Percent
- ----  -------  -------  -------  -------  -------  -------  -------  -------
1 2012    9,835     40.0   14,740     60.0    8,982     47.3   10,008     52.7
2 2013   10,442     42.1   14,362     57.9    9,615     49.3    9,895     50.7
3 2014   11,434     44.2   14,440     55.8   10,581     51.8    9,864     48.2
4 2015   12,419     47.0   14,025     53.0   11,535     54.5    9,618     45.5
5 2016   13,706     48.9   14,344     51.1   12,640     57.0    9,531     43.0
6 2017   15,129     51.0   14,540     49.0       NA       NA       NA       NA
7 2018   16,144     51.3   15,317     48.7       NA       NA       NA       NA
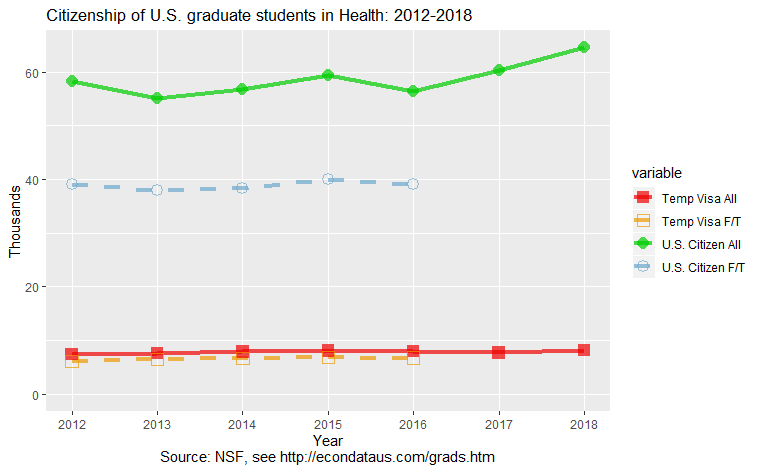
Citizenship of U.S. graduate students in Health: 2012-2018
            All U.S. Graduate Students       Full-time U.S. Graduate Students
        ----------------------------------  ----------------------------------
          Temporary Visa     U.S. Citizen     Temporary Visa    U.S. Citizen
        ----------------  ----------------  ----------------  ----------------
  Year    Count  Percent    Count  Percent    Count  Percent    Count  Percent
- ----  -------  -------  -------  -------  -------  -------  -------  -------
Citizenship of U.S. graduate students in Health: 2012-2018

Temporary Visa U.S. Citizen Temporary Visa U.S. Citizen
  Year IntCount IntPrcnt US_Count US_Prcnt IntFTCnt IntFTPct USFT_Cnt USFT_Pct
1 2012    7,471     11.3   58,354     88.7    6,094     13.5   39,020     86.5
2 2013    7,639     12.2   55,071     87.8    6,509     14.6   37,936     85.4
3 2014    7,906     12.2   56,797     87.8    6,705     14.9   38,369     85.1
4 2015    8,067     12.0   59,322     88.0    6,887     14.7   39,970     85.3
5 2016    7,946     12.4   56,390     87.6    6,745     14.7   39,055     85.3
6 2017    7,699     11.3   60,264     88.7       NA       NA       NA       NA
7 2018    8,217     11.3   64,534     88.7       NA       NA       NA       NA
Sources: National Science Foundation: 2012, 2013, 2014, 2015, 2016, 2017, 2018
         Full-time students: 2012-2016
Note: The full-time numbers appear to match those in Figure 1 on page 5 of NFAP Policy Brief >> OCTOBER 2017
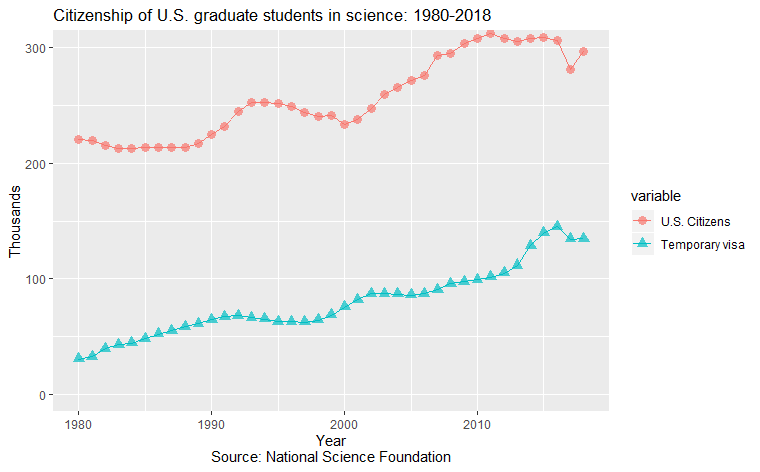
Citizenship of U.S. graduate students in science: 2012-2018
Citizenship of U.S. graduate students in science: 1980-2018

         U.S. Citizens    Temporary visa
        ---------------  ----------------
   Year    Count    Pct     Count     Pct
1  1980  220,903   87.9    30,362    12.1
2  1981  219,762   87.1    32,642    12.9
3  1982  215,397   84.4    39,749    15.6
4  1983  213,114   83.3    42,706    16.7
5  1984  212,717   82.8    44,186    17.2
6  1985  214,014   81.7    47,959    18.3
7  1986  214,097   80.5    51,980    19.5
8  1987  213,882   79.4    55,374    20.6
9  1988  213,945   78.6    58,364    21.4
10 1989  217,211   78.0    61,366    22.0
11 1990  224,792   77.7    64,591    22.3
12 1991  231,803   77.5    67,254    22.5
13 1992  244,514   78.2    67,964    21.8
14 1993  252,480   79.2    66,371    20.8
15 1994  253,008   79.5    65,110    20.5
16 1995  252,245   80.0    63,020    20.0
17 1996  248,907   79.8    63,050    20.2
18 1997  244,026   79.6    62,456    20.4
19 1998  240,630   78.9    64,188    21.1
20 1999  241,066   77.9    68,425    22.1
21 2000  234,000   75.6    75,424    24.4
22 2001  237,718   74.3    82,018    25.7
23 2002  247,842   73.9    87,324    26.1
24 2003  259,871   74.8    87,397    25.2
25 2004  265,643   75.4    86,664    24.6
26 2005  271,962   76.0    85,748    24.0
27 2006  275,905   76.0    87,341    24.0
28 2007  293,792   76.4    90,731    23.6
29 2008  295,530   75.5    95,889    24.5
30 2009  303,700   75.7    97,308    24.3
31 2010  308,108   75.6    99,183    24.4
32 2011  312,846   75.5   101,594    24.5
33 2012  308,042   74.6   104,991    25.4
34 2013  305,563   73.2   111,688    26.8
35 2014  308,499   70.5   128,896    29.5
36 2015  309,182   68.9   139,472    31.1
37 2016  306,710   67.8   145,336    32.2
38 2017  281,057   67.6   134,511    32.4
39 2018  297,277   68.8   134,978    31.2

Source: National Science Foundation
H-1B Data