The Labor Condition Application (LCA)
The Labor Condition Application (LCA) is the first major form which must be filed in the process of employing foreign workers in the U.S. on a nonimmigrant basis, chiefly via an H-1B visa. As stated at this link, "Employers petitioning for temporary foreign workers in specialty occupations must have a certified Labor Condition Application from the Department of Labor and then must submit a Form I-129 to USCIS." A great deal of disclosure data from these LCAs is available on the Department of Labor website at this link. Expanding the Disclosure Data tab on this page will display links to the LCA Disclosure Data from the most recent year in the section titled "OFLC Programs and Disclosures". Links to LCA Disclosure Data from 2008 to the prior year and be found further down the page, in the section titled "LCA Programs (H-1B, H-1B1, E-3)".
Key data from the LCA Disclosure Data can be searched and displayed via the R Shiny application at https://econdata.shinyapps.io/lca1/. This document shows examples of how this can be done.
Displaying Data for a Single Employer and Year
Displaying Data for Each Application
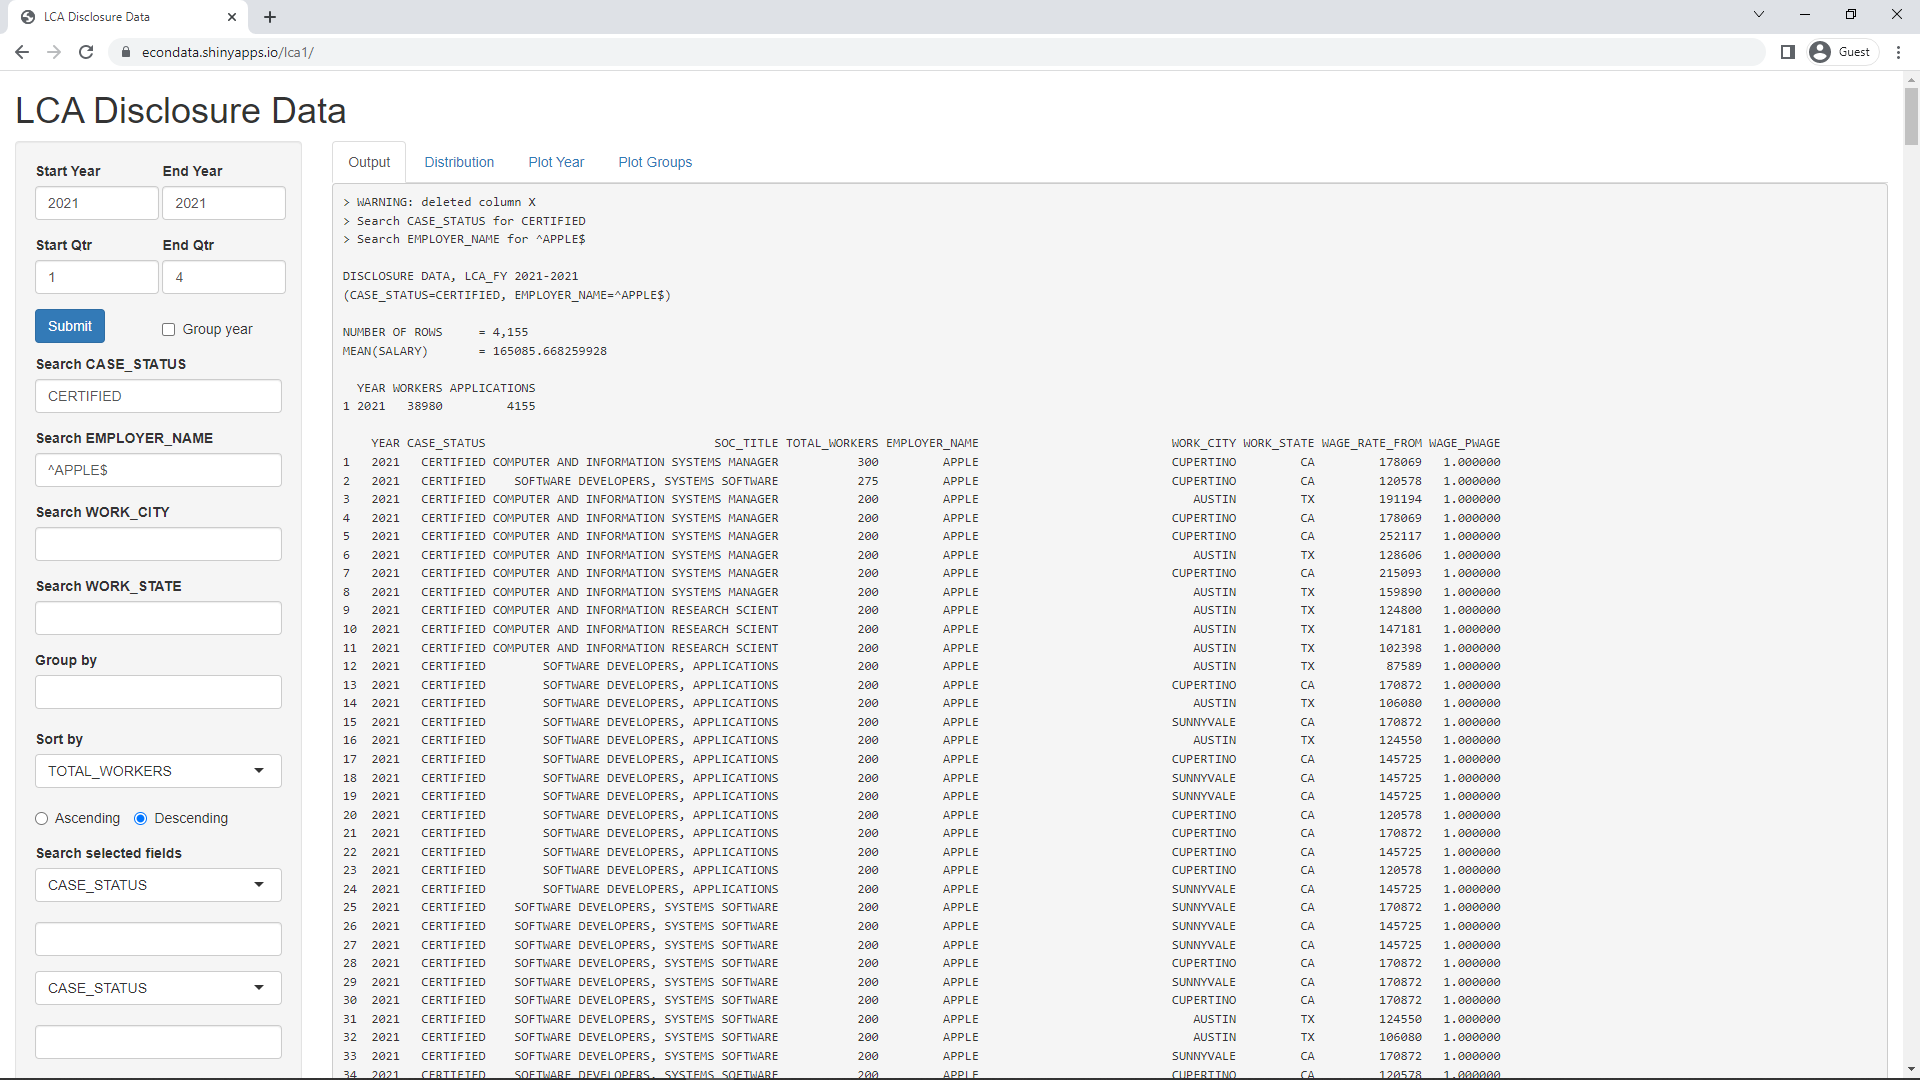
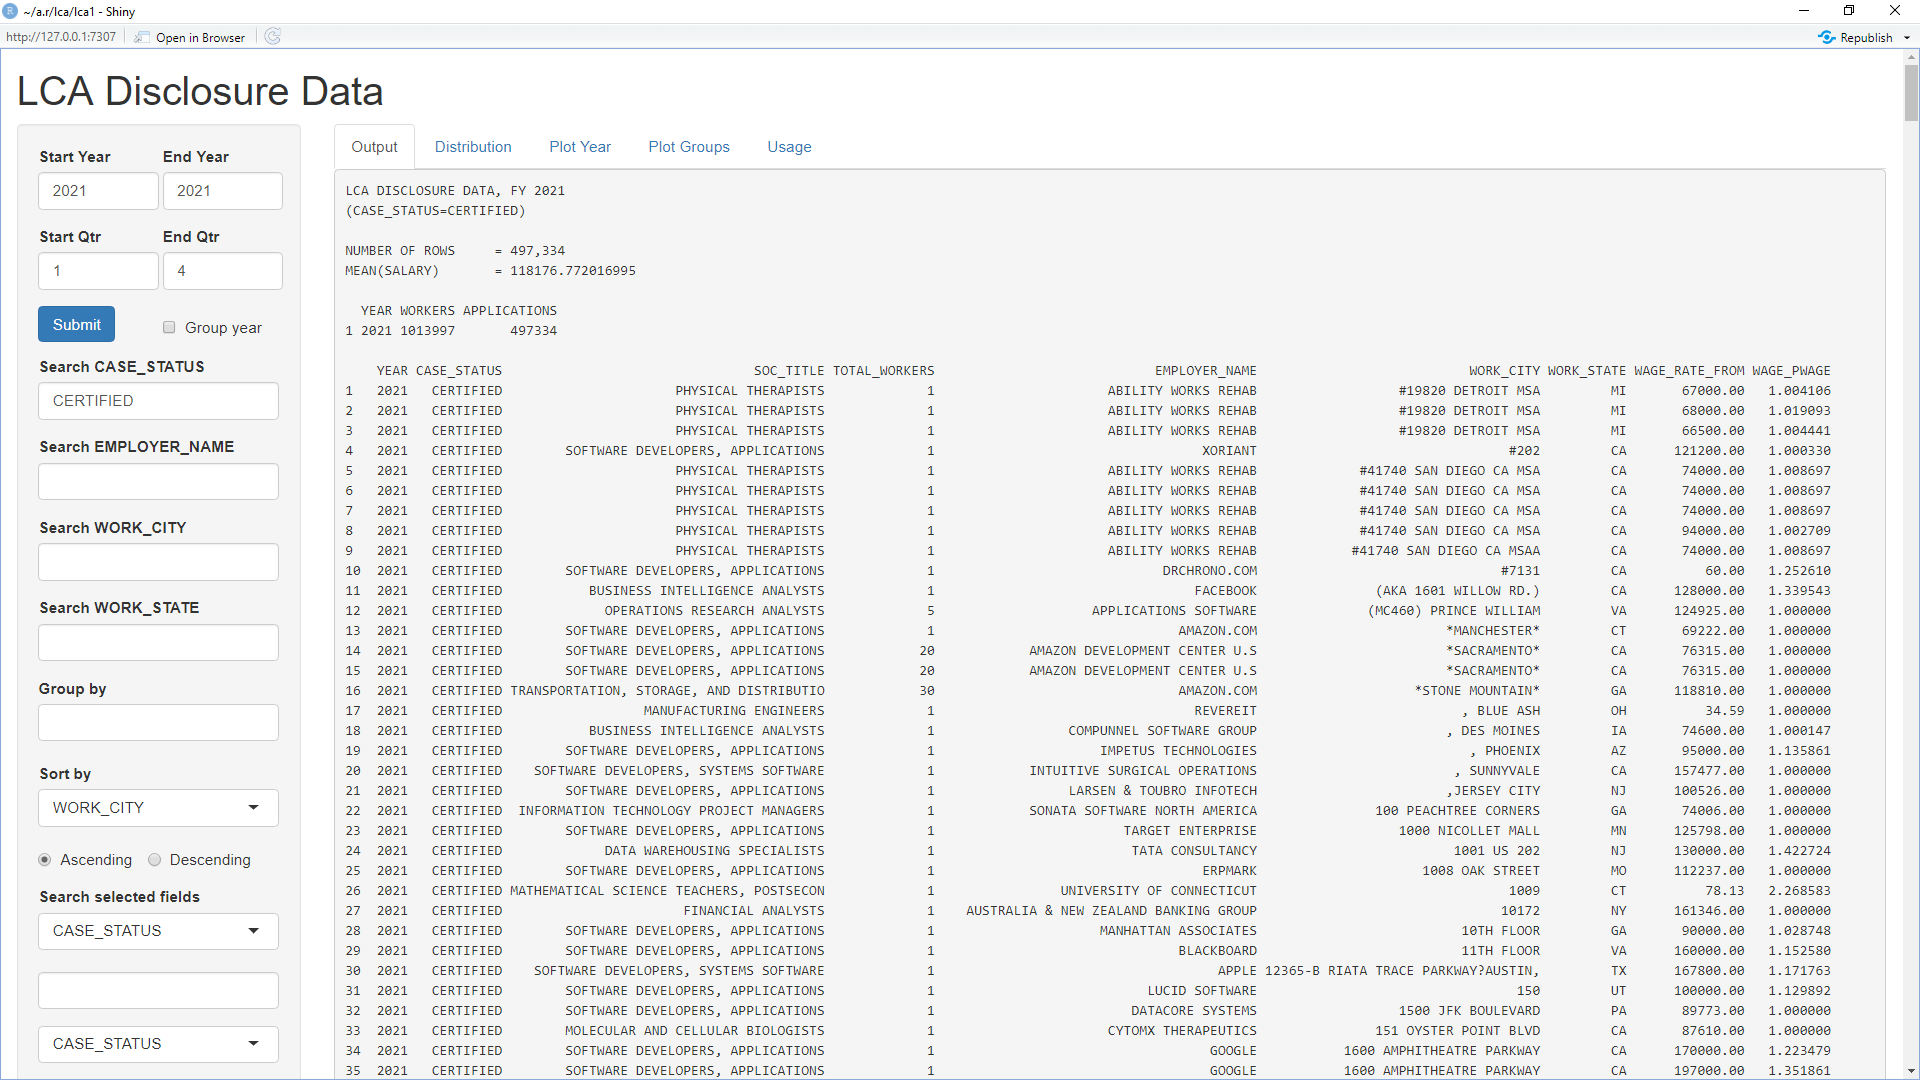
Below is the initial screen that is currently displayed at https://econdata.shinyapps.io/lca1/. The panel on the left is the input sidepanel and specifies that the 2021 CERTIFIED applications for APPLE are to be listed, sorted by TOTAL_WORKERS. The ^ and $ characters before and after APPLE specify the beginning and end of the full EMPLOYER_NAME and their usefulness in this case is explained below.
The output in the Output tab starts with 3 lines beginning with '>' and representing warning and status messages. Those are followed by the title and subtitle, the number of rows, and the mean salary of the matching data. There is one row per application and the mean salary is the average of the WAGE_RATE_FROM column (not weighted by TOTAL_WORKERS). Following the NUMBER OF ROWS and MEAN(SALARY) is a list of the number of TOTAL_WORKERS and APPLICATIONS per year.
The list of yearly totals is followed by a list containing one row per application. For each application, the variables listed in the header are listed by default. All but Year and WAGE_PWAGE are taken directly from the disclosure files and correspond to the the fields CASE_STATUS, SOC_TITLE, TOTAL_WORKER_POSITIONS (listed as TOTAL_WORKERS), EMPLOYER_NAME, WORKSITE_CITY (listed as WORK_CITY), WORKSITE_STATE (listed as WORK_STATE), WORK_RATE_OF_PAY_FROM (listed as WORK_RATE_FROM) described at the 2021 LCA Record Layout. WAGE_PWAGE is calculated and equals WORK_RATE_FROM (the lowest wage that the worker will be paid) divided by the prevailing wage. Because the worker must ordinarily be paid at or over the prevailing wage, this number should be greater than or equal to 1.
Grouping by EMPLOYER_NAME
In order to look at data for a single employer and only that employer, the "Group by" input can be used to determine all of the employer names that will match the one specified in the "Search EMPLOYER_NAME" input. For example, setting "Search EMPLOYER_NAME" to APPLE and "Group by" to EMPLOYER_NAME and then clicking the Submit button will result in the following screen:
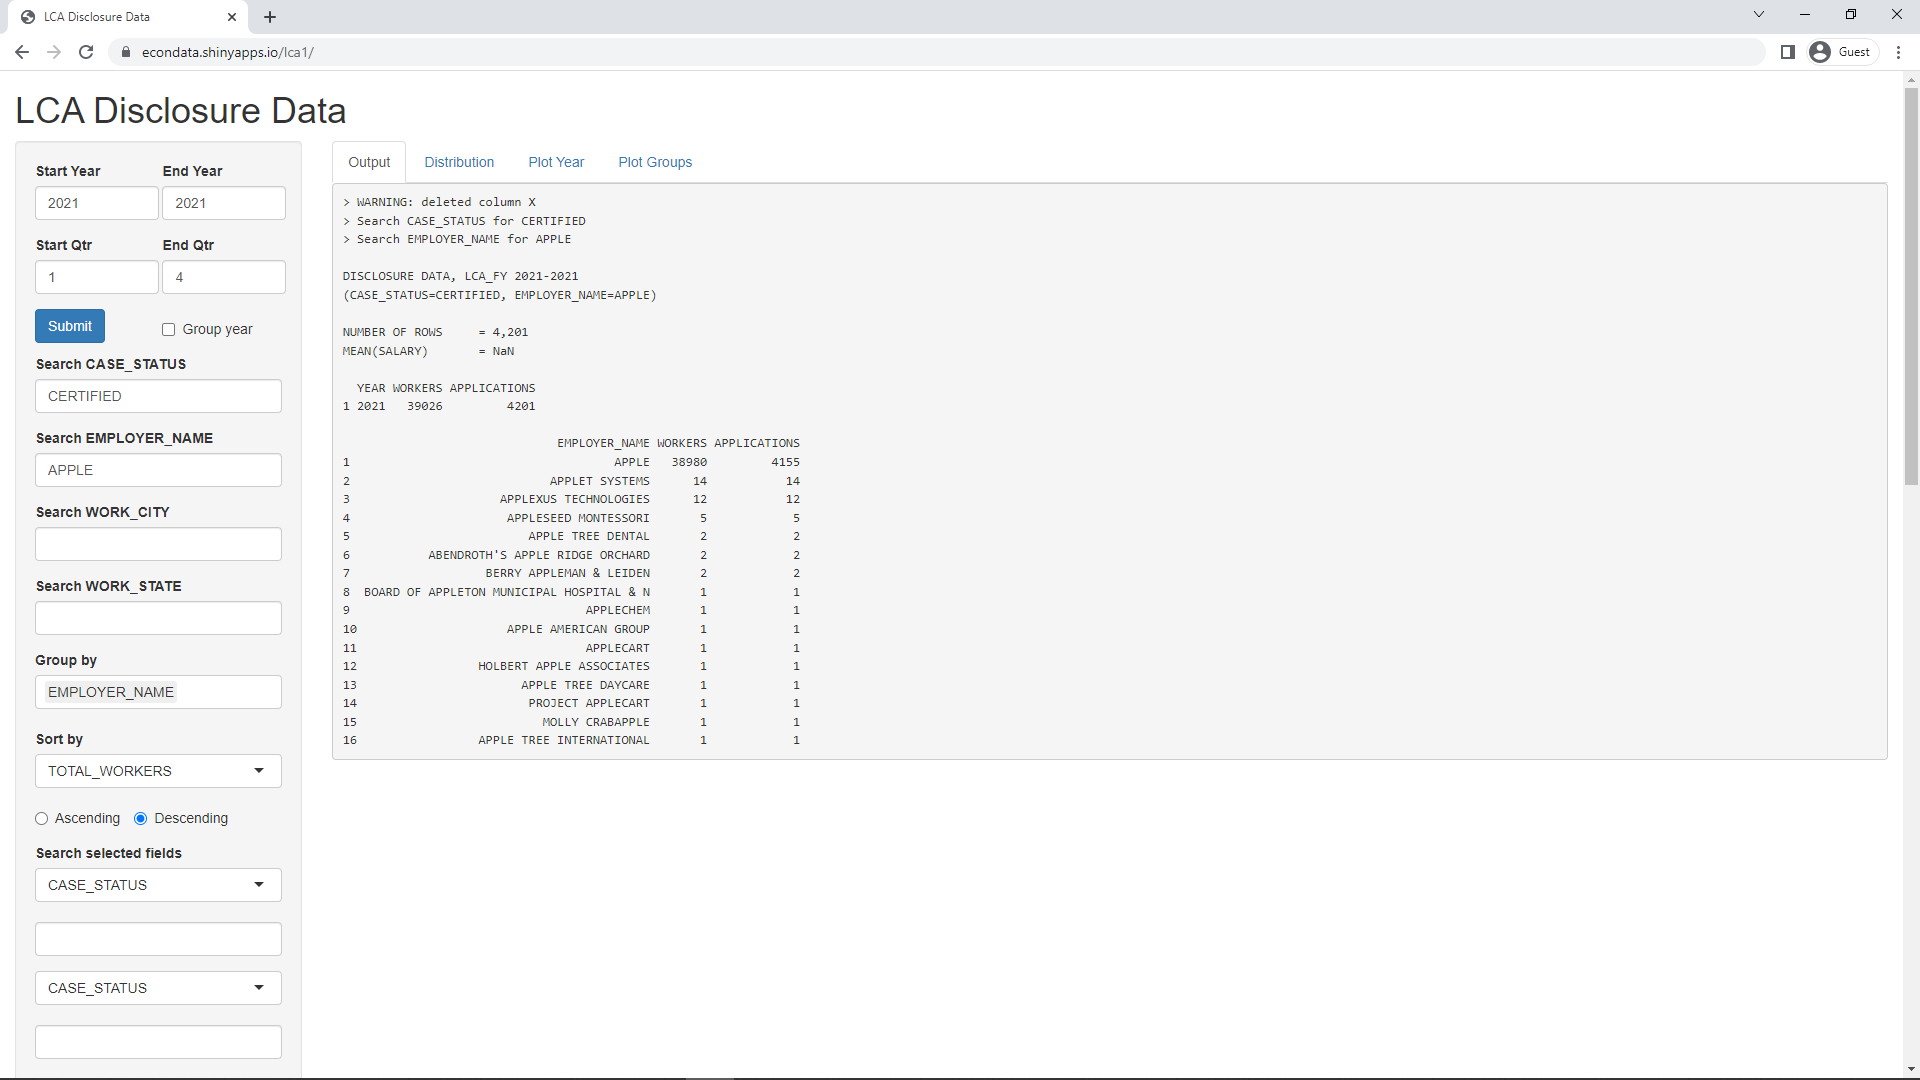
A "Search EMPLOYER_NAME" input that allows a character after APPLE will match all items except for 1 (APPLE) and 15 (MOLLY CRABAPPLE). Hence, a trailing $ is required after APPLE to specify that no other characters are allowed. Then, in order to avoid matching 15 (MOLLY CRABAPPLE), a leading ^ is also required. Since 1 (APPLE) appears to be the only valid match, the entry of ^APPLE$ is the appropriate "Search EMPLOYER_NAME" input. It should be noted that this input is treated as a regular expression or "regex".
Cleaning the EMPLOYER_NAME
One important thing to note is that the application will remove extraneous characters and trailers in order to simplify the EMPLOYER_NAMEs and combine different names for the same employer. The settings for this processing are at the bottom of the left sidepanel as shown below.
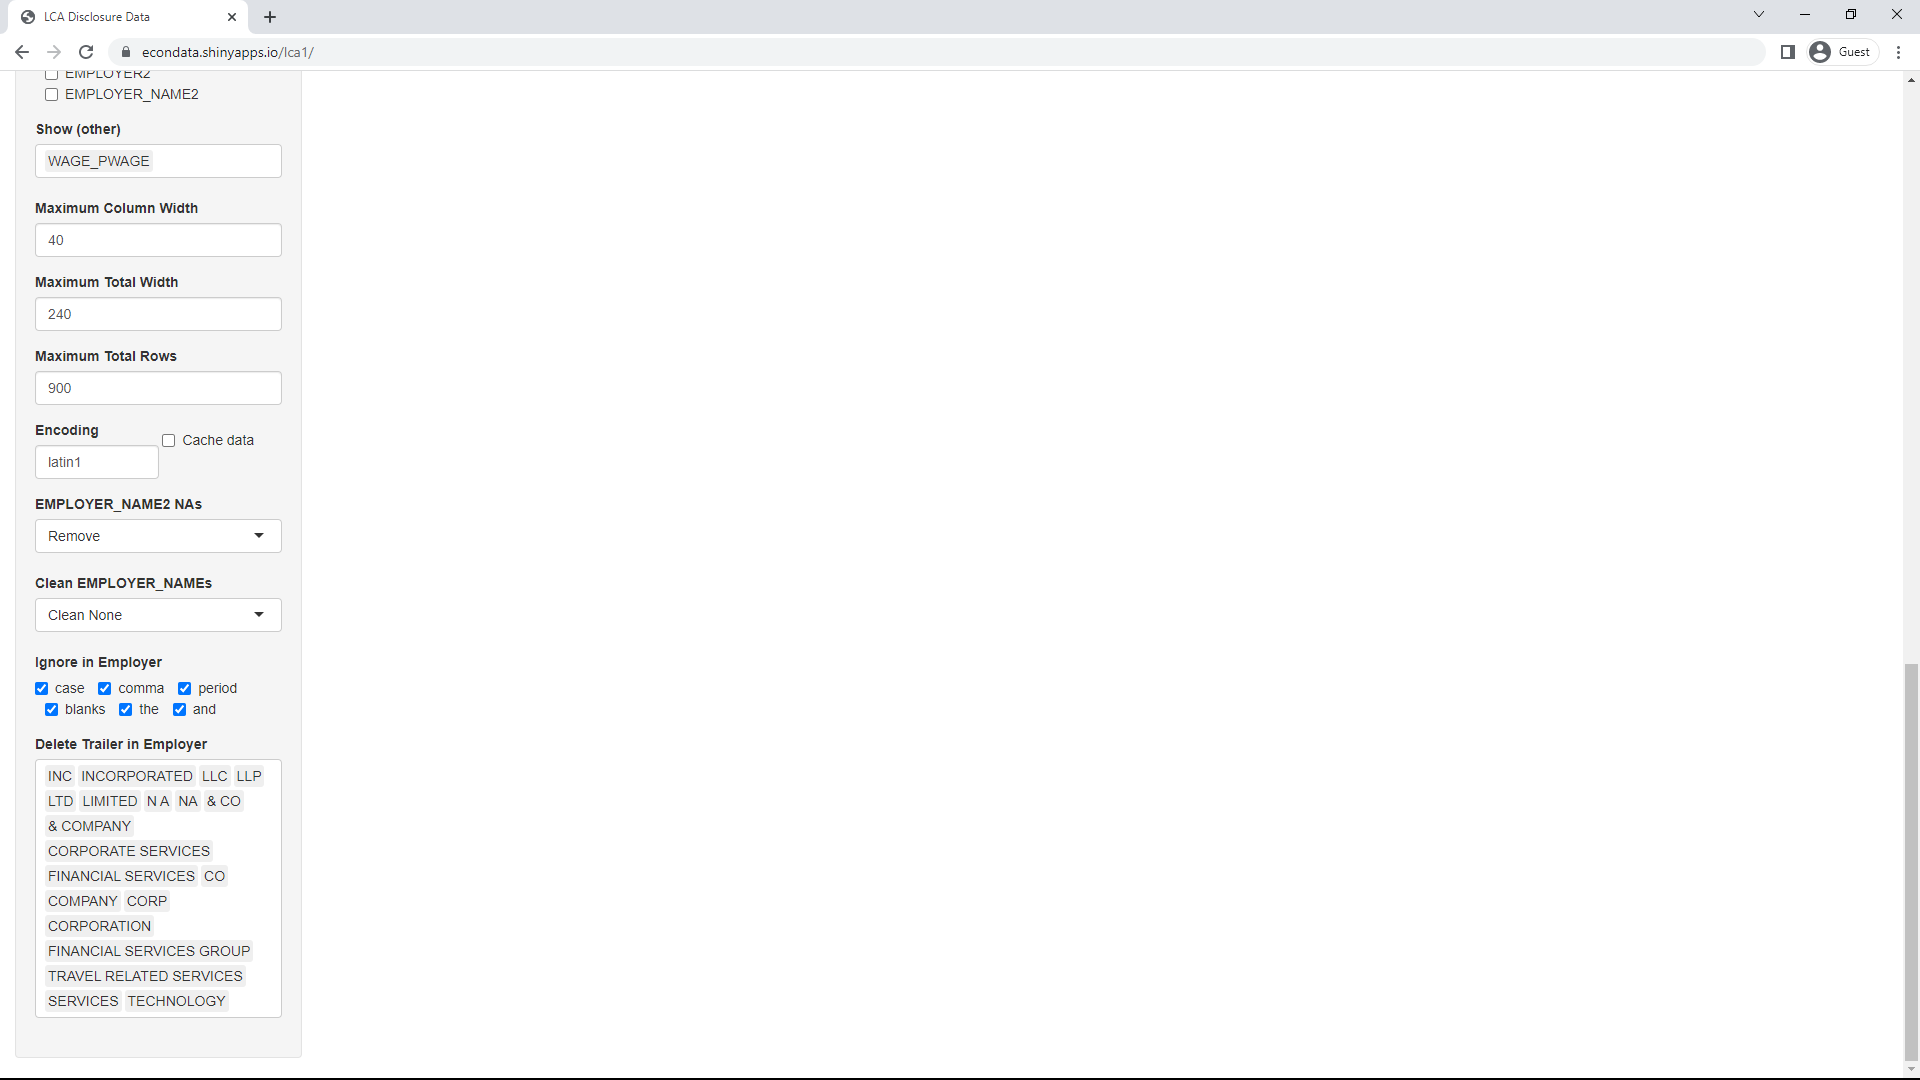
The "Clean EMPLOYER_NAMEs" input is set to "Clean Both" by default. The checkboxes under "Ignore in Employer" specify characters which can be ignored. Checking "comma", "period", and "blanks" will generally convert those specified characters into single blanks. The checkbox "case" will ignore character case (upper or lower), the checkbox "the" will ignore the leading word "the" (regardless of case), and the checkbox "and" will convert all cases of " and " to " & ". Finally, the phrases selected in the "Delete Trailer in Employer" input specify those phrases which will be deleted if they appear at the end of the employer name.
All of the above cleaning can be turned off by setting the "Clean EMPLOYER_NAMEs" input to "Clean None". Doing so in this case will result in the EMPLOYER_NAMEs in the leftmost 4 columns below:
                              EMPLOYER_NAME WORKERS APPLICATIONS                                  EMPLOYER_NAME WORKERS APPLICATIONS
1                                APPLE INC.   38980         4155    1                                     APPLE   38980         4155
2                        APPLET SYSTEMS LLC      14           14    2                            APPLET SYSTEMS      14           14
3                 APPLEXUS TECHNOLOGIES LLC       7            7    3                     APPLEXUS TECHNOLOGIES      12           12
4                 APPLESEED MONTESSORI INC.       5            5    4                      APPLESEED MONTESSORI       5            5
5                APPLEXUS TECHNOLOGIES INC.       5            5
6                         APPLE TREE DENTAL       2            2    5                         APPLE TREE DENTAL       2            2
7       ABENDROTH'S APPLE RIDGE ORCHARD LLC       2            2    6           ABENDROTH'S APPLE RIDGE ORCHARD       2            2
8               BERRY APPLEMAN & LEIDEN LLP       2            2    7                   BERRY APPLEMAN & LEIDEN       2            2
9  THE BOARD OF APPLETON MUNICIPAL HOSPITAL       1            1    8  BOARD OF APPLETON MUNICIPAL HOSPITAL & N       1            1
10                           APPLECHEM INC.       1            1    9                                 APPLECHEM       1            1
11                 APPLE AMERICAN GROUP LLC       1            1    10                     APPLE AMERICAN GROUP       1            1
12                            APPLECART LLC       1            1    11                                APPLECART       1            1
13           HOLBERT APPLE ASSOCIATES, INC.       1            1    12                 HOLBERT APPLE ASSOCIATES       1            1
14                   APPLE TREE DAYCARE LLC       1            1    13                       APPLE TREE DAYCARE       1            1
15                    PROJECT APPLECART LLC       1            1    14                        PROJECT APPLECART       1            1
16                     MOLLY CRABAPPLE INC.       1            1    15                          MOLLY CRABAPPLE       1            1
17            APPLE TREE INTERNATIONAL CORP       1            1    16                 APPLE TREE INTERNATIONAL       1            1
The rightmost 4 columns show the resulting EMPLOYER NAMEs when the "Clean EMPLOYER_NAMEs" input is set to "Clean Both". As can be seen, the main difference is that the specified trailers are deleted from the EMPLOYER_NAMEs. Also, the 7 and 5 applications for "APPLEXUS TECHNOLOGIES LLC" and "APPLEXUS TECHNOLOGIES INC.", respectively, are combined to get 12 applications for "APPLEXUS TECHNOLOGIES". Also, "BOARD OF APPLETON MUNICIPAL HOSPITAL & N" is truncated to 40 characters because the "Maximum Column Width" input is set to 40.
Displaying Data for Multiple Employers and a Single Year
Grouping by EMPLOYER_NAME (primary employer)
If the "Clean EMPLOYER_NAMEs" input is set back to the default "Clean Both", the "Search EMPLOYER_NAME" input is set to blank, the "Group by" input is set to EMPLOYER_NAME, and the Submit button is clicked, the following screen will be displayed:
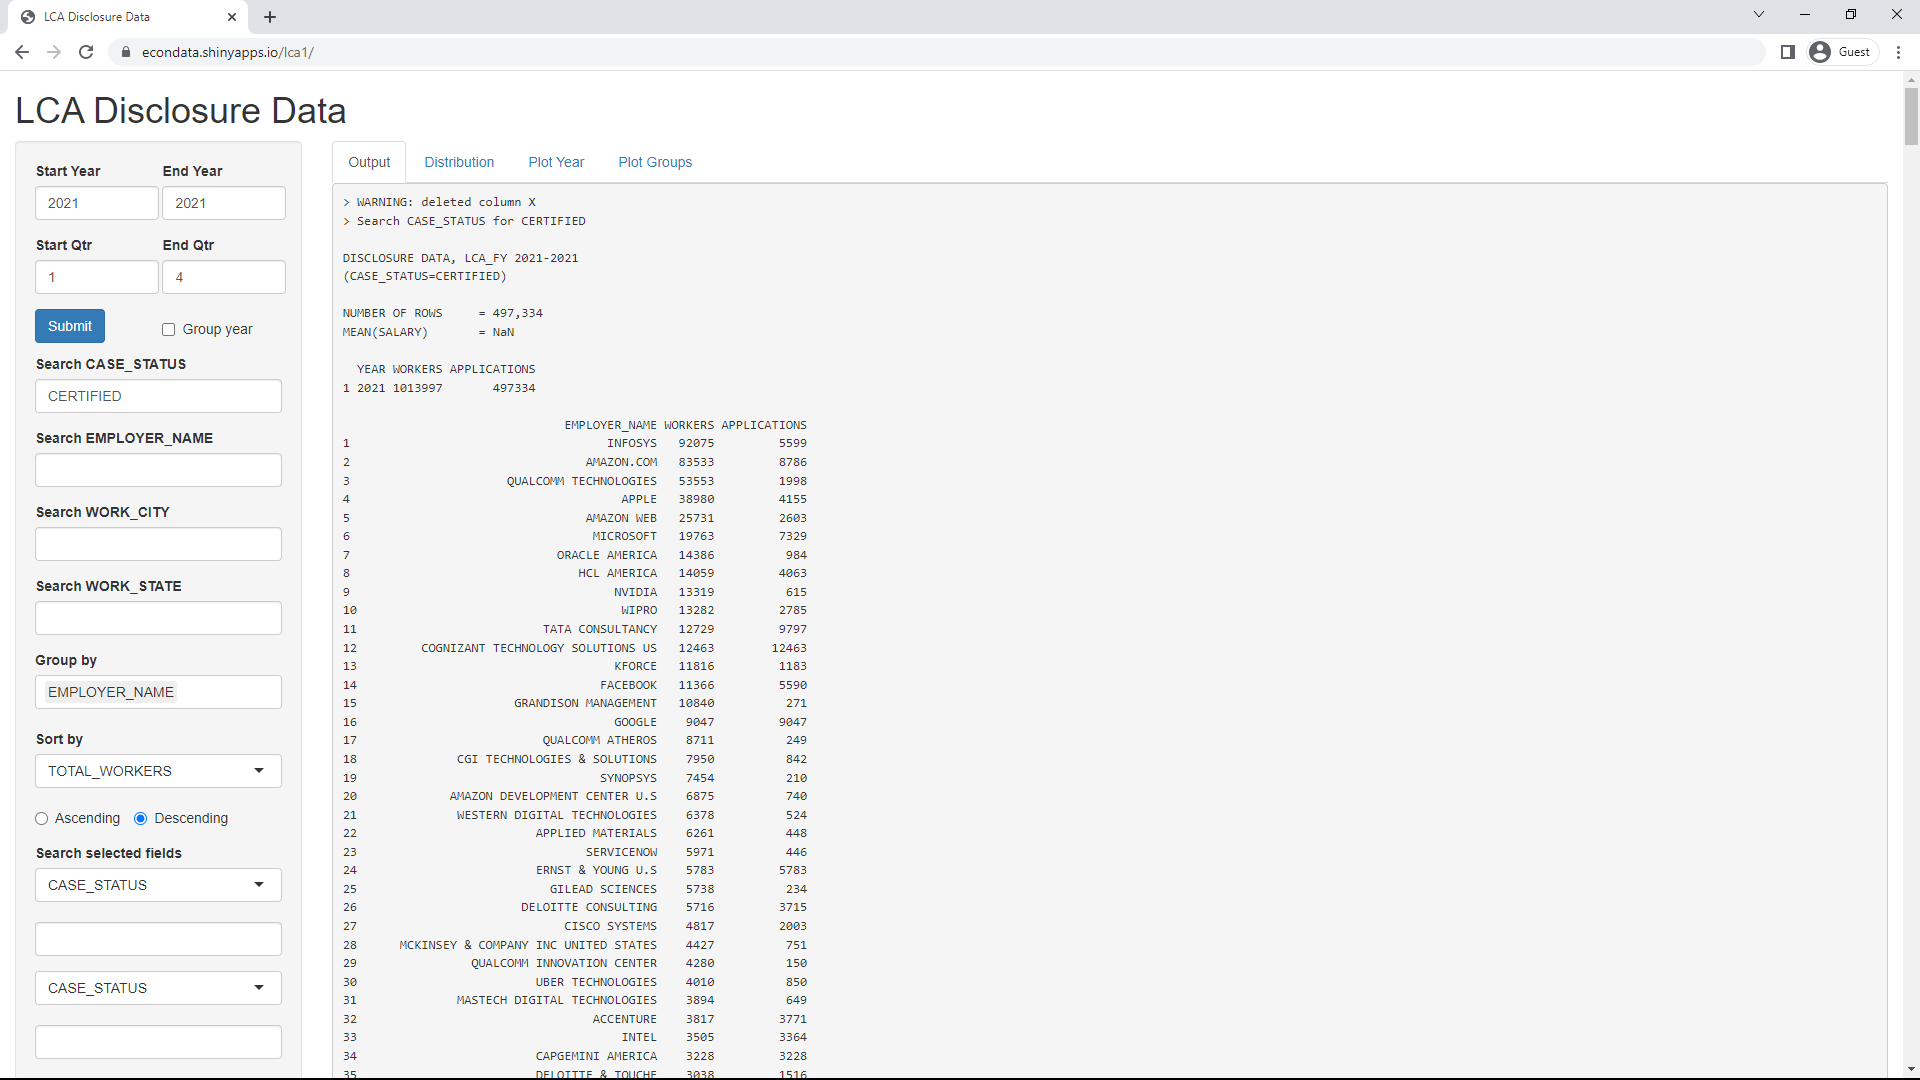
This shows all of the employers in 2021, grouped by EMPLOYER_NAME and sorted by TOTAL_WORKERS. The totals by year show that there were a total of 1,013,997 workers in 497,334 applications submitted in 2021. Both numbers are far above the 85,000 maximum H-1B slots in the annual lottery. It's not clear that those applications that request hundreds of workers are really serious about hiring that many. Hence, it may be more conservative to look at the number of applications.
In any case, changing the "Sort by" input to APPLICATIONS will cause the list to be sorted by APPLICATIONS. Following are the top 50 EMPLOYER_NAMEs in 2021, sorted by APPLICATIONS:
DISCLOSURE DATA, LCA_FY 2021-2021
(CASE_STATUS=CERTIFIED)

NUMBER OF ROWS     = 497,334
MEAN(SALARY)       = NaN

  YEAR WORKERS APPLICATIONS
1 2021 1013997       497334

                               EMPLOYER_NAME WORKERS APPLICATIONS
1          COGNIZANT TECHNOLOGY SOLUTIONS US   12463        12463
2                           TATA CONSULTANCY   12729         9797
3                                     GOOGLE    9047         9047
4                                 AMAZON.COM   83533         8786
5                                  MICROSOFT   19763         7329
6                          ERNST & YOUNG U.S    5783         5783
7                                    INFOSYS   92075         5599
8                                   FACEBOOK   11366         5590
9                                      APPLE   38980         4155
10                               HCL AMERICA   14059         4063
11                                 ACCENTURE    3817         3771
12                       DELOITTE CONSULTING    5716         3715
13                                     INTEL    3505         3364
14                         CAPGEMINI AMERICA    3228         3228
15                       WAL-MART ASSOCIATES    2961         2961
16                            JPMORGAN CHASE    2944         2944
17                                     WIPRO   13282         2785
18                                AMAZON WEB   25731         2603
19                             GOLDMAN SACHS    2273         2273
20                  COMPUNNEL SOFTWARE GROUP    2122         2112
21                            SALESFORCE.COM    2043         2043
22                  TECH MAHINDRA (AMERICAS)    2008         2008
23                             CISCO SYSTEMS    4817         2003
24                     QUALCOMM TECHNOLOGIES   53553         1998
25           INTERNATIONAL BUSINESS MACHINES    1928         1928
26                                    TEKORG    1645         1645
27                         DELOITTE & TOUCHE    3038         1516
28                                   MPHASIS    2032         1408
29                  LARSEN & TOUBRO INFOTECH    1436         1368
30                                  MINDTREE    1282         1282
31                 FIDELITY TECHNOLOGY GROUP    1538         1250
32                                       IBM    1221         1221
33                                    KFORCE   11816         1183
34                                    VMWARE    1171         1171
35                                     TESLA    1163         1163
36                               ATOS SYNTEL    1152         1152
37                     RANDSTAD TECHNOLOGIES    1102         1102
38                                    PAYPAL    1686         1077
39                                  LINKEDIN    2709         1043
40                            ORACLE AMERICA   14386          984
41           PRICEWATERHOUSECOOPERS ADVISORY     946          946
42                              CITIBANK N.A     871          871
43                         UBER TECHNOLOGIES    4010          850
44              CGI TECHNOLOGIES & SOLUTIONS    7950          842
45                                      EBAY    1403          823
46                                  NTT DATA     801          801
47                                   CUMMINS     790          789
48                                    ANTHEM     777          777
49      MCKINSEY & COMPANY INC UNITED STATES    4427          751
50                                     ADOBE    1577          748
Of these employers, 5 of the top 10 are IT consulting firms listed at this link. Those 5 firms are Cognizant, Tata, Ernst & Young, Infosys, and HCL America. The grouping by EMPLOYER_NAMEs does not perfectly group by company. For example, #3 (AMAZON.COM) and #18 (AMAZON WEB) are both a part of Amazon. Still, the grouping appears to be fairly accurate.
Grouping by EMPLOYER_NAME2 (secondary employer)
As described at this link, EMPLOYER_NAME is the "Legal business name of the employer submitting the Labor Condition Application". Since 2019, LCAs have also included something like SECONDARY_ENTITY_BUSINESS_NAME, described here as "Name of secondary entity where the worker(s) will be placed (if applicable)". These secondary employers hire H-1B workers from their primary employers, typically an IT consulting firm, for specific assignments. They typically pay a fee to the primary employer who submitted the LCA as long as that employee is on assignment. The name of this secondary employer is denoted in this app as EMPLOYER_NAME2.
If there is no secondary employer, EMPLOYER_NAME2 will typically be set to NA in the disclosure data. The "EMPLOYER_NAME2 NAs" input determines how these NAs are handled by the app. The default setting is "Remove" which specifies that NAs are to be removed before applications are grouped by EMPLOYER_NAME2. The option "Retain" specifies that the NAs are to be retained. In this case, the largest grouping of EMPLOYER_NAME2 is likely to be NA. Finally, "Set to EMPLOYER_NAME" will set NA values of EMPLOYER_NAME2 to the same value as EMPLOYER_NAME. This will serve to ensure that every application is represented by some employer. That will be the secondary employer if there is one. Otherwise, it will be the primary employer. Following are the top 50 secondary entities obtained by grouping by EMPLOYER_NAME2 and sorting by APPLICATIONS (using the default setting of "Remove"):
DISCLOSURE DATA, LCA_FY 2021-2021
(CASE_STATUS=CERTIFIED)

NUMBER OF ROWS     = 127,956
MEAN(SALARY)       = NaN

  YEAR WORKERS APPLICATIONS
1 2021 1013997       497334

                              EMPLOYER_NAME2 WORKERS APPLICATIONS
1                           AMERICAN EXPRESS    3609         1430
2                                      APPLE    5976         1416
3                                CAPITAL ONE    1697         1360
4                                WELLS FARGO    2871         1265
5                                 FORD MOTOR    2537         1250
6                                       AT&T    2144         1247
7                                  CITIGROUP    1312         1025
8                       FIDELITY INVESTMENTS    1517         1002
9                            BANK OF AMERICA     910          905
10                                   VERIZON     907          869
11                                    ANTHEM     885          827
12                             CISCO SYSTEMS    3314          790
13                                CVS HEALTH     797          742
14    UNITED SERVICES AUTOMOBILE ASSOCIATION    2186          736
15                                    HUMANA     785          691
16                            CHARLES SCHWAB    2793          654
17                                     FEDEX    1238          646
18                    CHARTER COMMUNICATIONS    1675          638
19                                    GOOGLE    1819          612
20                                FANNIE MAE    1073          581
21                                  PNC BANK    2764          580
22                                   WALMART     589          545
23                         JOHNSON & JOHNSON     645          544
24                         KAISER PERMANENTE     907          526
25                                   COMCAST    1762          518
26                                     CIGNA    2750          484
27                                  T-MOBILE     489          479
28                               CATERPILLAR     733          453
29                                      NIKE    1972          442
30                                 MICROSOFT    1158          428
31                                    PAYPAL     412          403
32                                  FACEBOOK     418          398
33                                   EQUIFAX     425          392
34                            MORGAN STANLEY     376          344
35                                    AT & T     336          336
36                              CVS PHARMACY    2063          333
37                              CITIBANK N.A     378          323
38                       DELOITTE CONSULTING     338          317
39                                    ABBVIE     318          317
40                           UNITED AIRLINES     610          316
41                                       PNC    1660          310
42                                     MERCK    1293          309
43                                  CITIBANK     385          308
44                                HOME DEPOT     353          287
45                            VANGUARD GROUP     343          285
46                                   CUMMINS     559          282
47                          VERIZON SOURCING    1369          278
48                                    PFIZER    1099          276
49                   BENEFICIARY'S RESIDENCE     273          273
50                                   CENTENE     367          268
As can be seen, most of the top companies are not typically thought of as tech companies as is the case with the top primary employers. Out of the top 10 secondary employers, 6 are financial companies (AMERICAN EXPRESS, CAPITAL ONE, WELLS FARGO, CITIGROUP, FIDELITY INVESTMENTS, and BANK OF AMERICA), 2 are communication providers (AT&T and VERIZON), 1 is an auto manufacturer (FORD MOTOR), and only one is a tech company (APPLE). Until 2019, these secondary employers largely avoided notice in their use of H-1B workers, at least as far as disclosure data was concerned.
Grouping by CASE_STATUS
All of the other tables in this document look only at certified LCAs. This includes the great majority of LCAs that are submitted. Clearing the "Search CASE_STATUS" input, setting the "Group by" input to CASE_STATUS, and clicking the Submit button will output the following:
DISCLOSURE DATA, LCA_FY 2021-2021

NUMBER OF ROWS     = 532,201
MEAN(SALARY)       = NaN

  YEAR WORKERS APPLICATIONS
1 2021 1071503       532201

     CASE_STATUS WORKERS APPLICATIONS
1      CERTIFIED 1013997       497334
2 CERT-WITHDRAWN   39621        22231
3      WITHDRAWN   14447         9944
4         DENIED    3438         2692
As can be seen, over 93 percent of the LCAs (497,334 of 532,201) were certified in 2021. As mentioned at this link, "Employers with certified LCAs may proceed with the process of obtaining an H-1B, H-1B1 or E-3 visa through USCIS and the Department of State." The other statuses are explained at this link.
Grouping by SOC_TITLE
As described at the 2021 LCA Record Layout, SOC_TITLE is the "Occupational title associated with the SOC/O*NET Code." It is similar to JOB_TITLE but is standardized and is therefore better to group by. Following are the top 50 occupational titles obtained by grouping by SOC_TITLE and sorting by APPLICATIONS:
DISCLOSURE DATA, LCA_FY 2021-2021
(CASE_STATUS=CERTIFIED)

NUMBER OF ROWS     = 497,334
MEAN(SALARY)       = NaN

  YEAR WORKERS APPLICATIONS
1 2021 1013997       497334

                                   SOC_TITLE WORKERS APPLICATIONS
1          SOFTWARE DEVELOPERS, APPLICATIONS  267735       158937
2      SOFTWARE DEVELOPERS, SYSTEMS SOFTWARE   91850        30284
3                  COMPUTER SYSTEMS ANALYSTS   49895        30135
4      COMPUTER SYSTEMS ENGINEERS/ARCHITECTS   23335        16379
5   SOFTWARE QUALITY ASSURANCE ENGINEERS AND   21064        12358
6    INFORMATION TECHNOLOGY PROJECT MANAGERS   19382        10862
7   COMPUTER AND INFORMATION SYSTEMS MANAGER   24603        10397
8             BUSINESS INTELLIGENCE ANALYSTS   20919         9412
9                       MECHANICAL ENGINEERS   13537         9214
10              OPERATIONS RESEARCH ANALYSTS   20017         8434
11                      COMPUTER PROGRAMMERS   17997         8327
12                        FINANCIAL ANALYSTS    9617         7985
13                             STATISTICIANS   15536         7806
14    ELECTRONICS ENGINEERS, EXCEPT COMPUTER   61950         7791
15           COMPUTER OCCUPATIONS, ALL OTHER   76232         7646
16                   DATABASE ADMINISTRATORS   13309         7311
17                      ELECTRICAL ENGINEERS   12388         6781
18                       MANAGEMENT ANALYSTS   18548         6303
19                  ACCOUNTANTS AND AUDITORS    9183         5999
20                      INDUSTRIAL ENGINEERS    7805         4608
21  NETWORK AND COMPUTER SYSTEMS ADMINISTRAT   13421         4521
22  COMPUTER AND INFORMATION RESEARCH SCIENT   16194         4090
23  MEDICAL SCIENTISTS, EXCEPT EPIDEMIOLOGIS    5908         3909
24  MARKET RESEARCH ANALYSTS AND MARKETING S    5976         3871
25        PHYSICIANS AND SURGEONS, ALL OTHER    4461         3770
26             INFORMATION SECURITY ANALYSTS    7413         3761
27                           CIVIL ENGINEERS    3835         3469
28             BIOCHEMISTS AND BIOPHYSICISTS    3233         2852
29                        MARKETING MANAGERS    5472         2474
30           FINANCIAL QUANTITATIVE ANALYSTS    2817         2367
31                           SALES ENGINEERS    5321         2171
32              DATA WAREHOUSING SPECIALISTS    2212         1999
33               COMPUTER NETWORK ARCHITECTS    3684         1977
34                                  CHEMISTS    3055         1977
35                               ACCOUNTANTS    2070         1864
36                                   LAWYERS    2144         1758
37                       DATABASE ARCHITECTS    2079         1730
38  HEALTH SPECIALTIES TEACHERS, POSTSECONDA    1684         1678
39    ARCHITECTURAL AND ENGINEERING MANAGERS    4410         1668
40  MEDICAL AND CLINICAL LABORATORY TECHNOLO    2345         1646
41                       PHYSICAL THERAPISTS   12411         1598
42                         GRAPHIC DESIGNERS    4025         1597
43                       MATERIALS ENGINEERS    3190         1499
44                        FINANCIAL MANAGERS    2243         1498
45                            WEB DEVELOPERS    2608         1463
46                      VALIDATION ENGINEERS    1466         1422
47         MOLECULAR AND CELLULAR BIOLOGISTS    1427         1407
48               RISK MANAGEMENT SPECIALISTS    1944         1276
49                              HOSPITALISTS    1326         1247
50           GENERAL AND OPERATIONS MANAGERS    1383         1229
As can be seen above, to top 7 occupational titles involve software, computers, or information technology.
Grouping by WORK_CITY and WORK_STATE
It's possible to group by more than one field. Following are the top 50 WORK_CITYs and WORK_STATEs for which applications were submitted:
DISCLOSURE DATA, LCA_FY 2021-2021
(CASE_STATUS=CERTIFIED)

NUMBER OF ROWS     = 497,334
MEAN(SALARY)       = NaN

  YEAR WORKERS APPLICATIONS
1 2021 1013997       497334

                 WORK_CITY WORK_STATE WORKERS APPLICATIONS
1                 NEW YORK         NY   43376        29032
2            SAN FRANCISCO         CA   26431        13865
3                  SEATTLE         WA   60407        11743
4                 SAN JOSE         CA   29473        10164
5                   AUSTIN         TX   39087         9963
6                  CHICAGO         IL   16583         9388
7                SUNNYVALE         CA   22879         9084
8                  ATLANTA         GA   14448         7947
9            MOUNTAIN VIEW         CA   14211         7514
10                 HOUSTON         TX   11493         7325
11                  IRVING         TX    9626         6993
12                   PLANO         TX    8791         6371
13                  BOSTON         MA   11973         6282
14                 REDMOND         WA   18053         6281
15                  DALLAS         TX   12431         6259
16             SANTA CLARA         CA   35084         5606
17               CHARLOTTE         NC    9003         5542
18                BELLEVUE         WA    9814         4782
19               SAN DIEGO         CA   51295         4746
20             JERSEY CITY         NJ    6238         4303
21                 PHOENIX         AZ    7271         4075
22              ALPHARETTA         GA    4896         3840
23              MENLO PARK         CA    8112         3795
24             LOS ANGELES         CA    7355         3559
25               PALO ALTO         CA   10114         3392
26            PHILADELPHIA         PA    5860         3179
27              PITTSBURGH         PA    7170         3138
28               CUPERTINO         CA   24655         3036
29                   TAMPA         FL    5949         2945
30                 FREMONT         CA    3597         2911
31                  DURHAM         NC    4644         2891
32               CAMBRIDGE         MA    4717         2640
33                COLUMBUS         OH    3572         2610
34                  IRVINE         CA    6035         2587
35             SAN ANTONIO         TX    4231         2401
36              SCHAUMBURG         IL    2476         2389
37              RICHARDSON         TX   10005         2230
38              WASHINGTON         DC    2923         2174
39             BENTONVILLE         AR    3112         2107
40               HILLSBORO         OR    3798         1917
41                  FRISCO         TX    3900         1901
42              PLEASANTON         CA    3603         1850
43               PRINCETON         NJ    2064         1821
44             MINNEAPOLIS         MN    2943         1739
45                RICHMOND         VA    2361         1733
46                   MIAMI         FL    2765         1671
47            JACKSONVILLE         FL    2248         1659
48                  MCLEAN         VA    1931         1626
49                 RALEIGH         NC    6870         1610
50                BROOKLYN         NY    3309         1563
As can be seen, 4 out of the top 10 are in the Silicon Valley area of California (SAN FRANCISCO, SAN JOSE, SUNNYVALE, and MOUNTAIN VIEW.
Grouping by WORK_STATE
Following are the top 50 WORK_STATEs for which applications were submitted:
DISCLOSURE DATA, LCA_FY 2021-2021
(CASE_STATUS=CERTIFIED)

NUMBER OF ROWS     = 497,334
MEAN(SALARY)       = NaN

  YEAR WORKERS APPLICATIONS
1 2021 1013997       497334

   WORK_STATE WORKERS APPLICATIONS
1          CA  305662       104061
2          TX  117446        56564
3          NY   63860        40646
4          WA   95678        26580
5          NJ   37515        26208
6          IL   37507        23575
7          MA   35355        20010
8          GA   26455        17395
9          NC   29920        16663
10         PA   26940        15820
11         FL   23587        14811
12         MI   19774        14646
13         VA   23078        13188
14         OH   17170        11228
15         AZ   17516         9247
16         MD    9941         7502
17         MN    9795         7007
18         CT   12013         6134
19         MO    8380         5894
20         TN    9414         5683
21         CO   11582         5570
22         OR    9560         4763
23         IN    8317         4697
24         WI    8595         4424
25         AR    4444         3240
26         UT    4253         2969
27         SC    3418         2635
28         DC    3660         2537
29         KY    3020         2471
30         DE    3009         2432
31         IA    2739         2192
32         KS    2640         1881
33         RI    4267         1686
34         NE    2287         1604
35         LA    2598         1411
36         AL    1861         1377
37         NH    2184         1355
38         NV    1328         1193
39         OK    1345         1157
40         NM    1297          782
41         ID     758          711
42         MS     713          589
43         ME     493          436
44         GU     380          376
45         ND     421          356
46         WV     422          349
47         HI     299          296
48         SD     297          263
49         VT     221          219
50         MT     198          157
51         AK     117          103
52         WY     117           98
53         PR      72           70
54         MP      53           53
55         VI      26           20
As can be seen, California has the most requested workers and applications by far and is followed by Texas, New York, Washington, and New Jersey.
Displaying Data for Multiple Employers by Quarter
As previously mentioned, a great deal of disclosure data from these LCAs is available on the Department of Labor website at this link. As can be seen, there is a single disclosure file for each year from 2008 through 2019. Starting in 2020, however, there are 4 files with disclosure data for each year, one file for each quarter. This change was likely due to the growing size of the files. It is possible to look at a subset of a year by specifying something other than 1 and 4 for the "Start Qtr" and "End Qtr" inputs. This option turned out to be useful in looking at a problem with the 2021 data that became apparent when comparing the results to a sheet of selected statistics put out by the Department of Labor at this link. The program was simply combining the 4 quarterly files to get the yearly results for 2021, same as it had done for 2020. However, unlike 2020, the program was coming up with much higher annual totals than the Department of Labor statistics.
In order to get a look at the contents of each of the 4 files for 2021, go to the default screen, clear the "Search EMPLOYER_NAME" input, select the Distribution tab, set the Variable input to DECISION DATE, set the "Bins / Binwidth(-)" input to -30, and click the Submit button. The -30 input sets the binwidth to 30 days or about one month. This should result in the following screen:
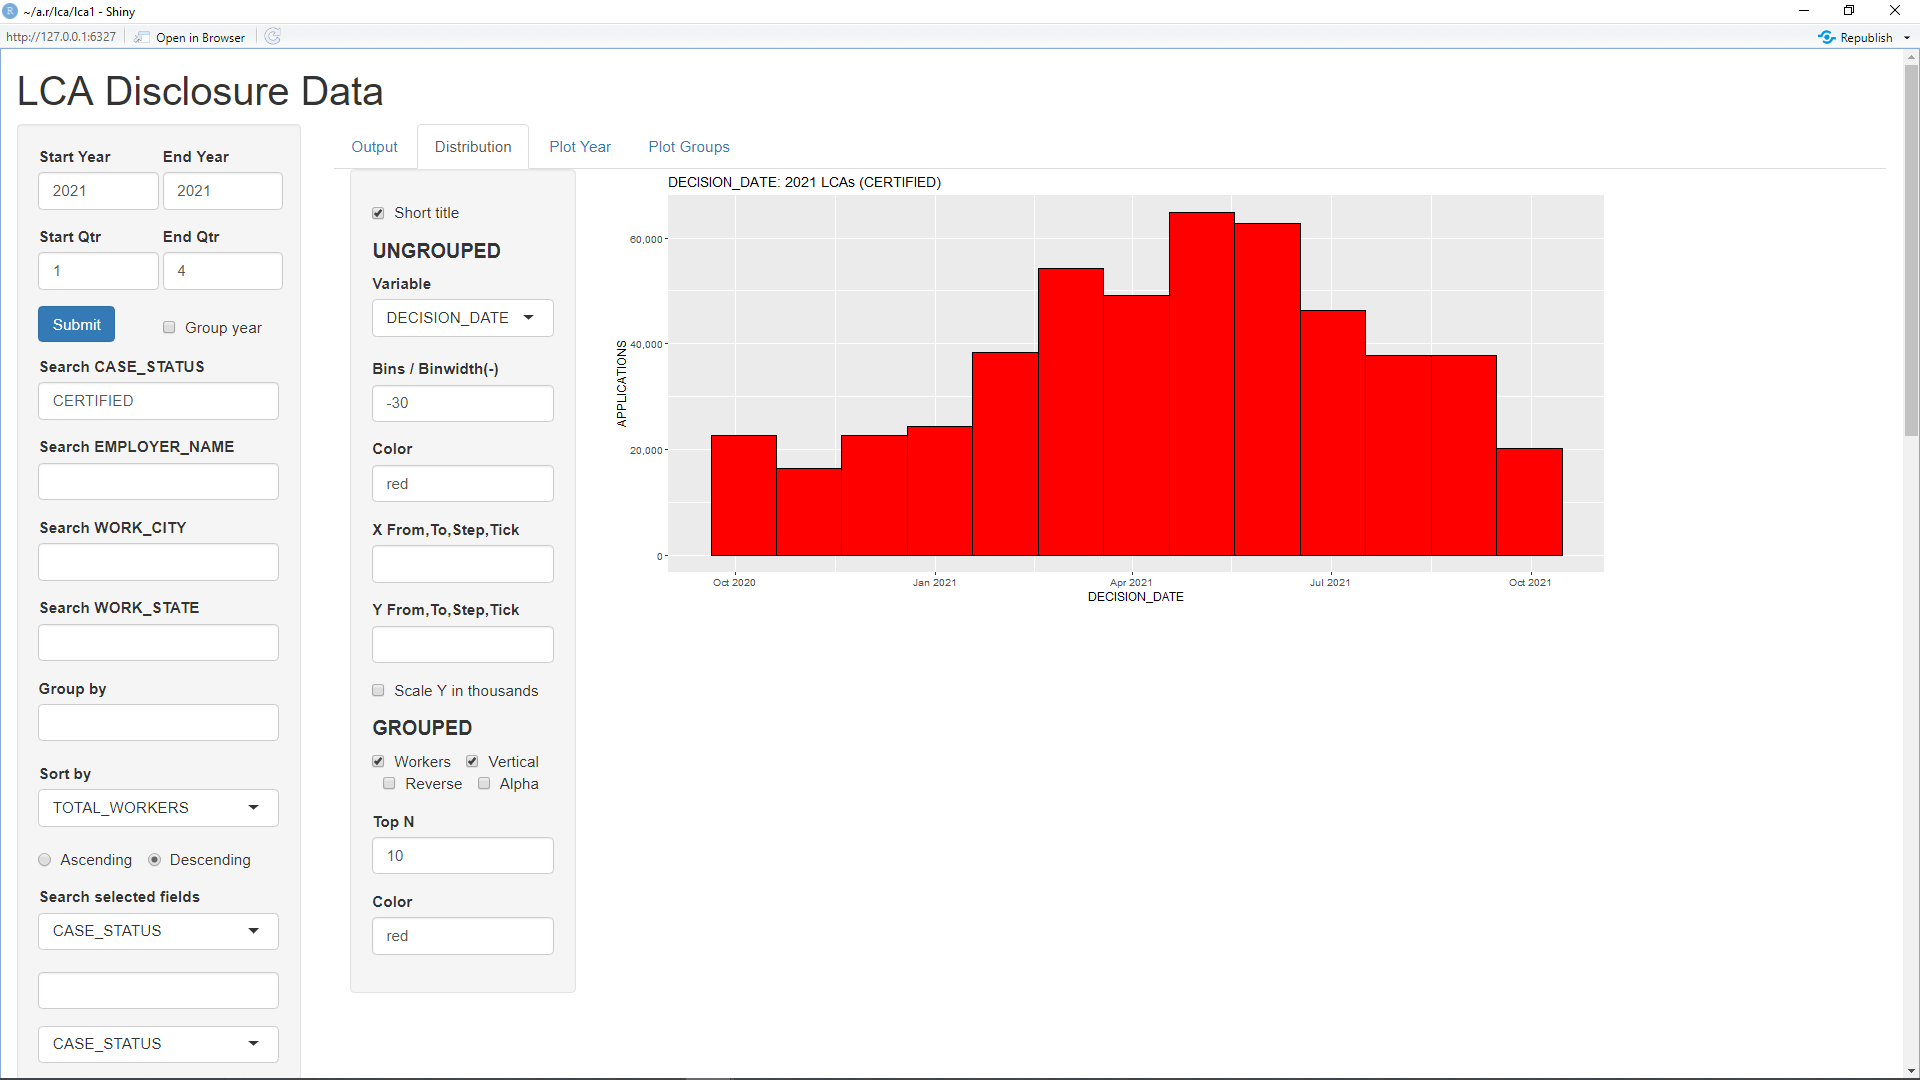
This shows the distribution of DECISION_DATE for all of the 2021 data. The LCA data is for fiscal year 2021 which goes from October 1, 2020 to September 30, 2021. Hence, the histogram seems to make sense for this period. However, you can then look at the distribution of DECISION_DATE in the file for quarter 1 by entering 1 into both the "Start Qtr" and "End Qtr" inputs and the clicking the Submit button. Similarly, you can enter 2, 3, and 4 into both of those inputs and click the Submit button to get the distribution of DECISION_DATE in the files for each of the other 3 quarters. The following histograms are the results:
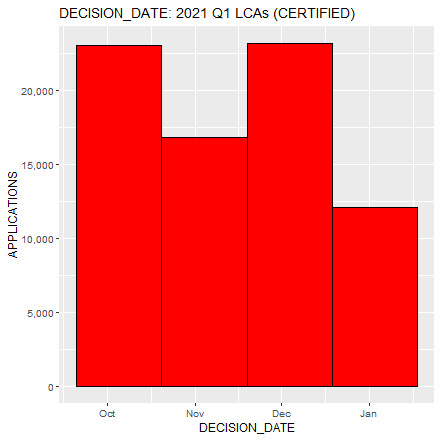
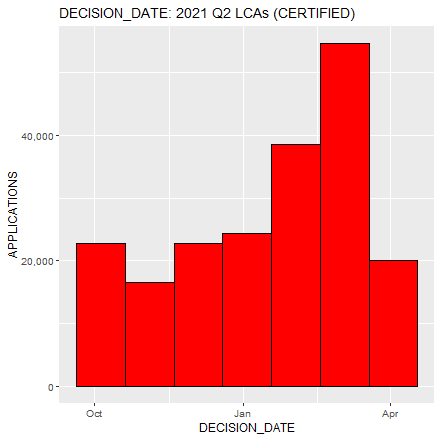


In fact, it appear that the file for Quarter 1 does properly contain the data for Quarter 1. But it then appears that the Quarter 2 file contains the data form Quarters 1 and 2 and that the Quarter 3 file contains the data for Quarters 1 through 3. The Quarter 4 file, however, then appears to correctly contain the data just for Quarter 4.
This program currently handles this problem by showing the files as requested for each quarter for 2021 except for the case where the "Start Qtr" and "End Qtr" are set to 1 and 4, respectively. In that case, it's assumed that the user wants the entire year and this if achieved by combining the Quarter 3 file (which contains Quarters 1 through 3) and the Quarter 4 file. That is why the histogram for all of 2021 in the screen above looks correct. Still, the next section compares the results from the app with the results from the Department of Labor selected statistics.
(Note: You can still force is combination of all four files for a year by setting "Start Qtr" and "End Qtr" are set to 0 and 4, respectively).
The Department of Labor (DOL) has posted selected statistics on 2021 LCA data at this link. Below is a copy of that page1:
The following table shows the workers and applications from the DOL disclosure files as displayed by the Shiny application, followed by the corresponding applications from the "Applications Processed" section of the DOL selected statistics.
----------------------------  -----------------------  ------------  --------------
LCA DISCLOSURE DATA, FY 2021         DOL FILES           DOL STATS     DIFFERENCE
----------------------------  -----------------------  ------------  --------------
QTR              CASE_STATUS    WORKERS  APPLICATIONS  APPLICATIONS    COUNT    PCT
----------------------------  -----------------------  ------------  --------------
All                    TOTAL  1,071,503       532,201       528,902     3299    0.6
All                CERTIFIED  1,013,997       497,334       507,235    -9901   -2.0
All           CERT-WITHDRAWN     39,621        22,231
All                WITHDRAWN     14,447         9,944        18,975    -9031  -47.6
All                   DENIED      3,438         2,692         2,692        0    0.0
  1                    TOTAL    204,787        80,622        78,823     1799    2.3
  1                CERTIFIED    197,430        75,064        74,263      801    1.1
  1           CERT-WITHDRAWN      3,554         3,333
  1                WITHDRAWN      3,218         1,723         4,058    -2335  -57.5
  1                   DENIED        585           502           502        0    0.0
  4                    TOTAL    214,261       126,576       126,576        0    0.0
  4                CERTIFIED    190,002       116,297       121,348    -5051   -4.2
  4           CERT-WITHDRAWN     20,864         7,419
  4                WITHDRAWN      2,744         2,343         4,711    -2368  -50.3
  4                   DENIED        651           517           517        0    0.0
There is some problem comparing for the CASE_STATUS of CERTIFIED and WITHDRAWN since the selected statistics don't have a CERT-WITHDRAWN (CERTIFIED-WITHDRAWN) category. It's unclear whether the selected stats consider these as CERTIFIED or WITHDRAWN. However, the TOTAL and DENIED categories should be directly comparable. For TOTAL, the file data ranges from being equal to being 2.3 percent larger than the selected statistics. For DENIED, the file data and selected statistics are identical.
The following table shows the applications and workers from the DOL disclosure files as displayed by the Shiny application, followed by the corresponding workers from the remainder of the DOL selected statistics.
----------------------------  -----------------------  ------------  --------------
LCA DISCLOSURE DATA, FY 2021         DOL FILES           DOL STATS     DIFFERENCE
----------------------------  -----------------------  ------------  --------------
QTR              CASE_STATUS  APPLICATIONS   WORKERS       WORKERS     COUNT    PCT
----------------------------  -----------------------  ------------  --------------
All                    TOTAL       532,201  1,071,503     1,045,621   25,882    2.5
All                CERTIFIED       497,334  1,013,997     1,027,735  -13,738   -1.3
  1                    TOTAL        80,622    204,787       197,346    7,441    3.8
  1                CERTIFIED        75,064    197,430       193,543    3,887    2.0
  4                    TOTAL       126,576    214,261       211,780    2,481    1.2
  4                CERTIFIED       116,297    190,002       208,385  -18,383   -8.8
----------------------------  -----------------------  ------------  --------------
QTR               WORK_STATE  APPLICATIONS   WORKERS       WORKERS     COUNT    PCT
----------------------------  -----------------------  ------------  --------------
All                       CA       111,137    318,747       309,011    9,736    3.2
All                       TX        59,976    122,195       118,397    3,798    3.2
All                       WA        27,943    101,796        96,688    5,108    5.3
All                       NY        43,420     68,354        64,602    3,752    5.8
All                       IL        26,252     40,930        38,930    2,000    5.1
All                       NJ        27,586     39,113        37,919    1,194    3.1
All                       MA        21,480     38,488        36,638    1,850    5.0
All                       NC        17,640     31,382        30,239    1,143    3.8
All                       PA        16,860     28,460        27,227    1,233    4.5
All                       GA        18,445     27,991        26,770    1,221    4.6
---------------------------------  ------------------  ------------  --------------
QTR            SOC_TITLE              APPS   WORKERS       WORKERS     COUNT    PCT
---------------------------------  ------------------  ------------  --------------
All  SW DEVELOPERS, APPLICATIONS   158,937    267,735       272,186   -4,451   -1.6
All  SW DEVELOPERS, SYSTEMS SW      30,284     91,850        92,454     -604   -0.7
All  COMPUTER OCCUPATIONS, OTHER     7,646     76,232       166,935  -90,703  -54.3
All  ELECTRONICS ENG. X COMPUTER     7,791     61,950        63,737    -1787   -2.8
All  COMPUTER SYSTEMS ANALYSTS      30,135     49,895        50,217     -322   -0.6
All  COMPUTER & INFO SYSTEMS MGR    10,397     24,603        24,748     -145   -0.6
All  COMPUTER SYSTEMS ENG./ARCH.    16,379     23,335
All  SW QUALITY ASSUR. ENG./TESTR   12,358     21,064
All  BUSINESS INTELLIGNC ANALYSTS    9,412     20,919
All  OPERATIONS RESEARCH ANALYSTS    8,434     20,017        20,217     -200   -1.0
----------------------------  -----------------------  ------------  --------------
QTR            EMPLOYER_NAME  APPLICATIONS   WORKERS       WORKERS     COUNT    PCT
----------------------------  -----------------------  ------------  --------------
All               AMAZON.COM         9,302     93,247        83,963    9,284   11.1
All                  INFOSYS         5,634     92,796        92,100      696    0.8
All    QUALCOMM TECHNOLOGIES         2,016     53,915        53,603      312    0.6
All                    APPLE         4,239     39,736        38,994      742    1.9
All               AMAZON WEB         2,758     28,366        25,796    2,570   10.0
All                MICROSOFT         7,329     19,763        19,763        0    0.0
All           ORACLE AMERICA           999     14,429        14,412       17    0.1
All              HCL AMERICA         4,113     14,158        14,070       88    0.6
All                    WIPRO         2,859     13,628        13,361      267    2.0
All                   NVIDIA           617     13,345        13,319       26    0.2
----------------------------  -----------------------  ------------  --------------
LCA DISCLOSURE DATA, FY 2021         DOL FILES           DOL STATS     DIFFERENCE
----------------------------  -----------------------  ------------  --------------
As previously explained, only the TOTAL category is directly comparable for CASE_STATUS. For TOTAL, the file data ranges from being 1.2 percent to 3.8 percent larger than the selected statistics. Similarly for the WORK_STATE totals, the file data ranges from being 3.1 percent to 5.8 percent larger than the selected statistics.
As opposed to the WORK_STATE values which are directly comparable, there's a problem with comparing the SOC_TITLE values. The selected statistics sheet says that its numbers are based on the SOC Codes. The Shiny app, however, displays the SOC titles which are related to the SOC codes. However, there does appear to be a one-to-one correspondence. For example, it appears that the "Statisticians" category in the selected statistics includes both STATISTICIANS and BIOSTATISTICIANS categories in SOC_TITLE. Still, the comparisons that could be done show that, except for the category "COMPUTER OCCUPATIONS, OTHER", the numbers were fairly close. In this case, the numbers from the selected statistics are larger by 0.6 percent to 2.8 percent. However, this relationship is not guaranteed since the numbers are not precisely comparable.
Similarly to SOC_TITLE, the EMPLOYER_NAMEs are not always precisely comparable. The selected statistics sheet says that the employers are based on unique FEINs. However, the 2021 LCA Record Layout says the following:
"The following form items are not included in the public disclosure file because they contain Personally Identifiable Information (PII): Employer’s Federal Employer Identification Number (FEIN), Attorney’s FEIN, and Attorney’s State Bar Number.
Hence, these employers are not directly comparable though both the files and selected statistics listed exactly 19,763 workers for Microsoft. Also, except for AMAZON.COM and AMAZON WEB, the file data ranges from being equal to being larger by just 2.0 percent.
In summary, 21 of the values in the files and selected statistics in the table are directly comparable. These include 9 TOTALs, 3 DENIEDs, and 12 WORK_STATEs. Of those, the file data ranges from being equal (in 4 of them) to being larger by a maximum of 5.8 percent. This would suggest that both sources are looking at the same data but that the files have been updated since the selected statistics were generated.
Displaying Data for a Single Employer and Multiple Years
If the "Start Year" input is set to 2008, the "End Year" input is set to 2021", the "Search EMPLOYER_NAME" input is set to AMAZON, the "Group by" input is set to EMPLOYER_NAME, the "Sort by" input is set to APPLICATIONS, and the Submit button is clicked, the following output will be displayed:
LCA DISCLOSURE DATA, FY 2008-2021
(CASE_STATUS=CERTIFIED, EMPLOYER_NAME=AMAZON)

NUMBER OF ROWS     = 59,351
MEAN(SALARY)       = NaN

   YEAR WORKERS APPLICATIONS
1  2008     703          439
2  2009     367          367
3  2010    1678          549
4  2011    1293          670
5  2012    3811          879
6  2013    3573         1166
7  2014    4715         1660
8  2015    8717         2243
9  2016    7679         3012
10 2017   12205         4926
11 2018   15642         6289
12 2019   15260         9373
13 2020   19462        15151
14 2021  120261        12627

                              EMPLOYER_NAME WORKERS APPLICATIONS
1                                AMAZON.COM  123556        32266
2                          AMAZON CORPORATE   36908        12882
3                                AMAZON WEB   35899         8669
4             AMAZON DEVELOPMENT CENTER U.S    7919         1240
5                        AMAZON FULFILLMENT    2089         1128
6                   AMAZON GLOBAL RESOURCES    1305          841
7                               AMAZON DATA    2862          511
8                           AMAZON.COM.DEDC     806          377
9                           AMAZON ROBOTICS     498          300
10                                   AMAZON     476          233
11                          AMAZON.COM.KYDC     587          168
12                       AMAZON ADVERTISING     853          164
13                           AMAZON DIGITAL     142           65
14                       AMAZON MEDIA GROUP      74           61
15                          AMAZON.COM.AZDC     189           58
16                          AMAZON PAYMENTS     172           46
17                           AMAZON CAPITAL     131           38
18                          AMAZON.COM.INDC     195           36
19                   AMAZON MECHANICAL TURK      86           33
20                             AMAZON FRESH      23           23
21                           AMAZON STUDIOS      78           21
22                          AMAZON.COM.NVDC      88           19
23                          AMAZON REGISTRY      25           19
24                      AMAZON TECHNOLOGIES      32           18
25                        AMAZON CORPORTATE      87           13
26                   AMAZON PRODUCE NETWORK      11           11
27                            AMAZON.COM.CA     125           11
28                          AMAZON COPORATE      21            9
29                          AMAZON.COM.KSDC      20            7
30                               AMAZON COM       6            6
31                      AMAZON.COM.SERVICES       5            5
32                          AMAZON.COM DEDC       6            4
33                        AMAZONIC VENTURES       3            3
34                               AMAZON HUT       3            3
35                             AMAZON WATCH       3            3
36                          AMAZON PHARMACY       3            3
37                        AMAZON CONSULTING       2            2
38           AMAZON FULFILLMENT SERVICES NC       2            2
39                      AMAZON CONSTRUCTION       2            2
40 A2Z DEVELOPMENT CENTER INC D/B/A AMAZON        2            2
41                AMAZONIA CONSULTING GROUP       2            2
42                        AMAZON FUFILLMENT       2            2
43                  AMAZON RESTAURANT & BAR       2            2
44                  AMAZON FULFILLMENT SVCS       2            2
45                       AMAZON.COM SERVICE       2            2
46                            AMAZON RETAIL       2            2
47                       AMAZON WEB SERVICE       2            2
48             AMAZON DEVELOPMENT CENTER US       2            2
49                 AMAZON BUILDERS HARDWARE       1            1
50                           AMAZON SOCIETY       1            1
51                 AMAZON PROFESSIONAL CARE       1            1
52                            AMAZON HERBAL       1            1
53                             AMAZON CARGO       1            1
54                      AMAZON.COM.KYDC.LLC       1            1
55                   AMAZON LOGISTICS GROUP       1            1
56                            AMAZON CAPTAL       1            1
57               AMAZON FULFILLMENT SERVICE       1            1
58                          AMAZON.COM AZDZ       5            1
59                 AMAZON CONSERVATION TEAM       1            1
60                              AMAZON AERO       1            1
61                          AMAZON CORPORTE       1            1
62               AMAZON ROBOTICS LLC (KIVA)       1            1
63                AMAZON DEVELOPMENT CENTER       1            1
64                 AMAZON WEB SERVICES INC.       1            1
65                           AMAZON MASONRY       1            1
66                               HAMAZON G2       1            1
67                     AMAZON WEB SEERVICES       1            1
68                         AMAZON CORPROATE       1            1
69                      AMAZON.COM.DEDC.INC       1            1
70                       AMAZON.COM SERVCES       1            1
71         AMAZON WEB SERVICES INC.(U+2020)       1            1
72                               AMAZON.WEB       1            1
73         AMAZON.COM SERVICES INC.(U+2020)       1            1
74                           AMAZON.COM WEB       1            1
75 AMAZON.COM SERVICES LLC (F/K/A AMAZON.CO       1            1
76                  AMAZON WEB SERVICES.INC       1            1
77           AMAZON DEVELOPEMENT CENTER U.S       1            1
78                    AMAZON DEV CENTER U.S       1            1
79 AMAZON.COM SERVICES LLC (HONG KONG BRANC      20            1
80                         AMAZON SOLUTIONS       1            1
81                AMAZON VALLEY ENGINEERING       1            1
As can be seen, there were 81 unique employer names that contained the word AMAZON. It could take some research to determine which, if any, of these employers are not associated with the Amazon in Seattle, run by Jeff Bezos. However, it does appear that the great majority of the Applications and Workers, including all those until at least #17 (AMAZON CAPITAL) are associated with that company. Hence, it's probably not critical to filter out those that are not associated.
In any event, clicking on the "Plot Year" tab and setting the "X From, To, Step, Tick" input to 2008,2021,2,1 and setting the "Y From, To, Step, Tick" input to 0,16000,2000 will display the following screen:
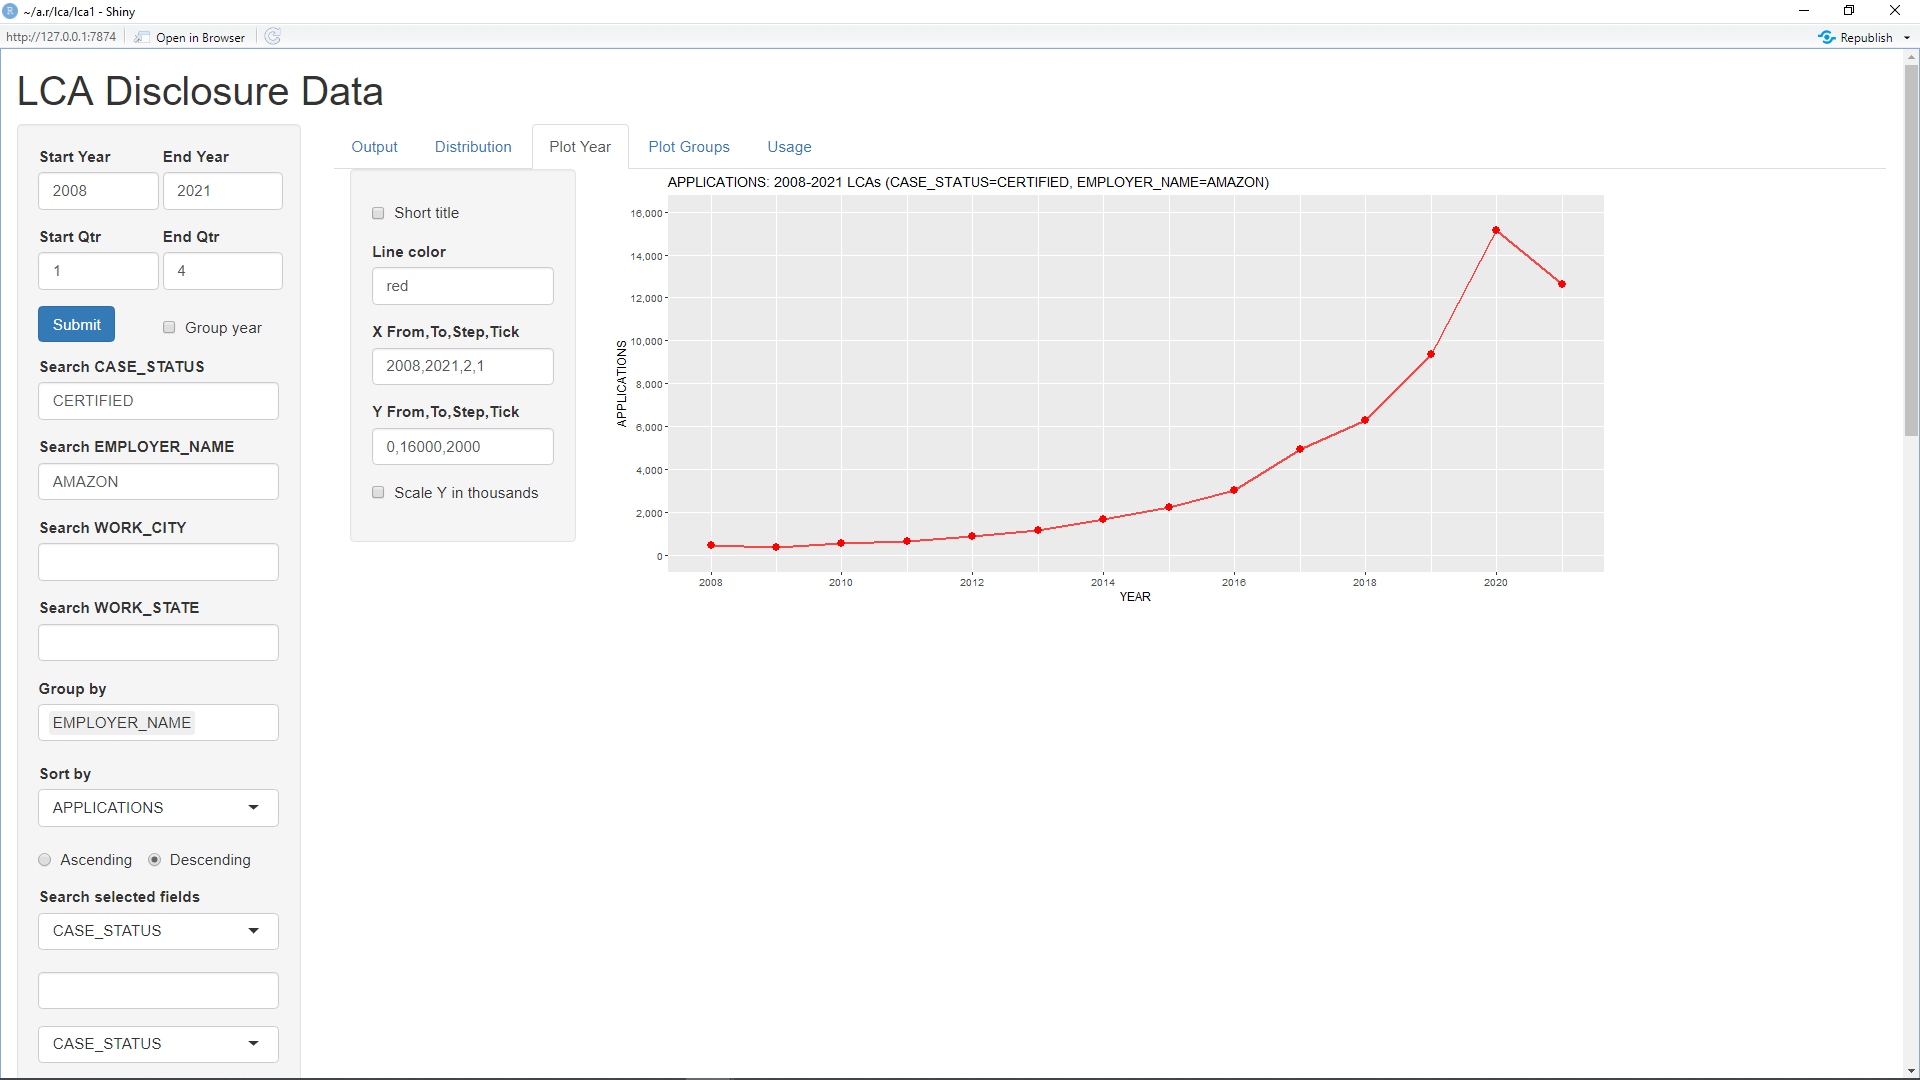
This graph shows that the number of certified applications submitted by Amazon rose rapidly from 2,243 in 2015 to 15,151 in 2020 before backing off to 12,627 in 2021.
Now, clicking on the "Plot Groups" tab and setting the "X From, To, Step, Tick" input to 2008,2021,2, setting the "Y From, To, Step, Tick" input to 0,12,2, and checking the "Scale Y in thousands" checkbox will display the following screen:
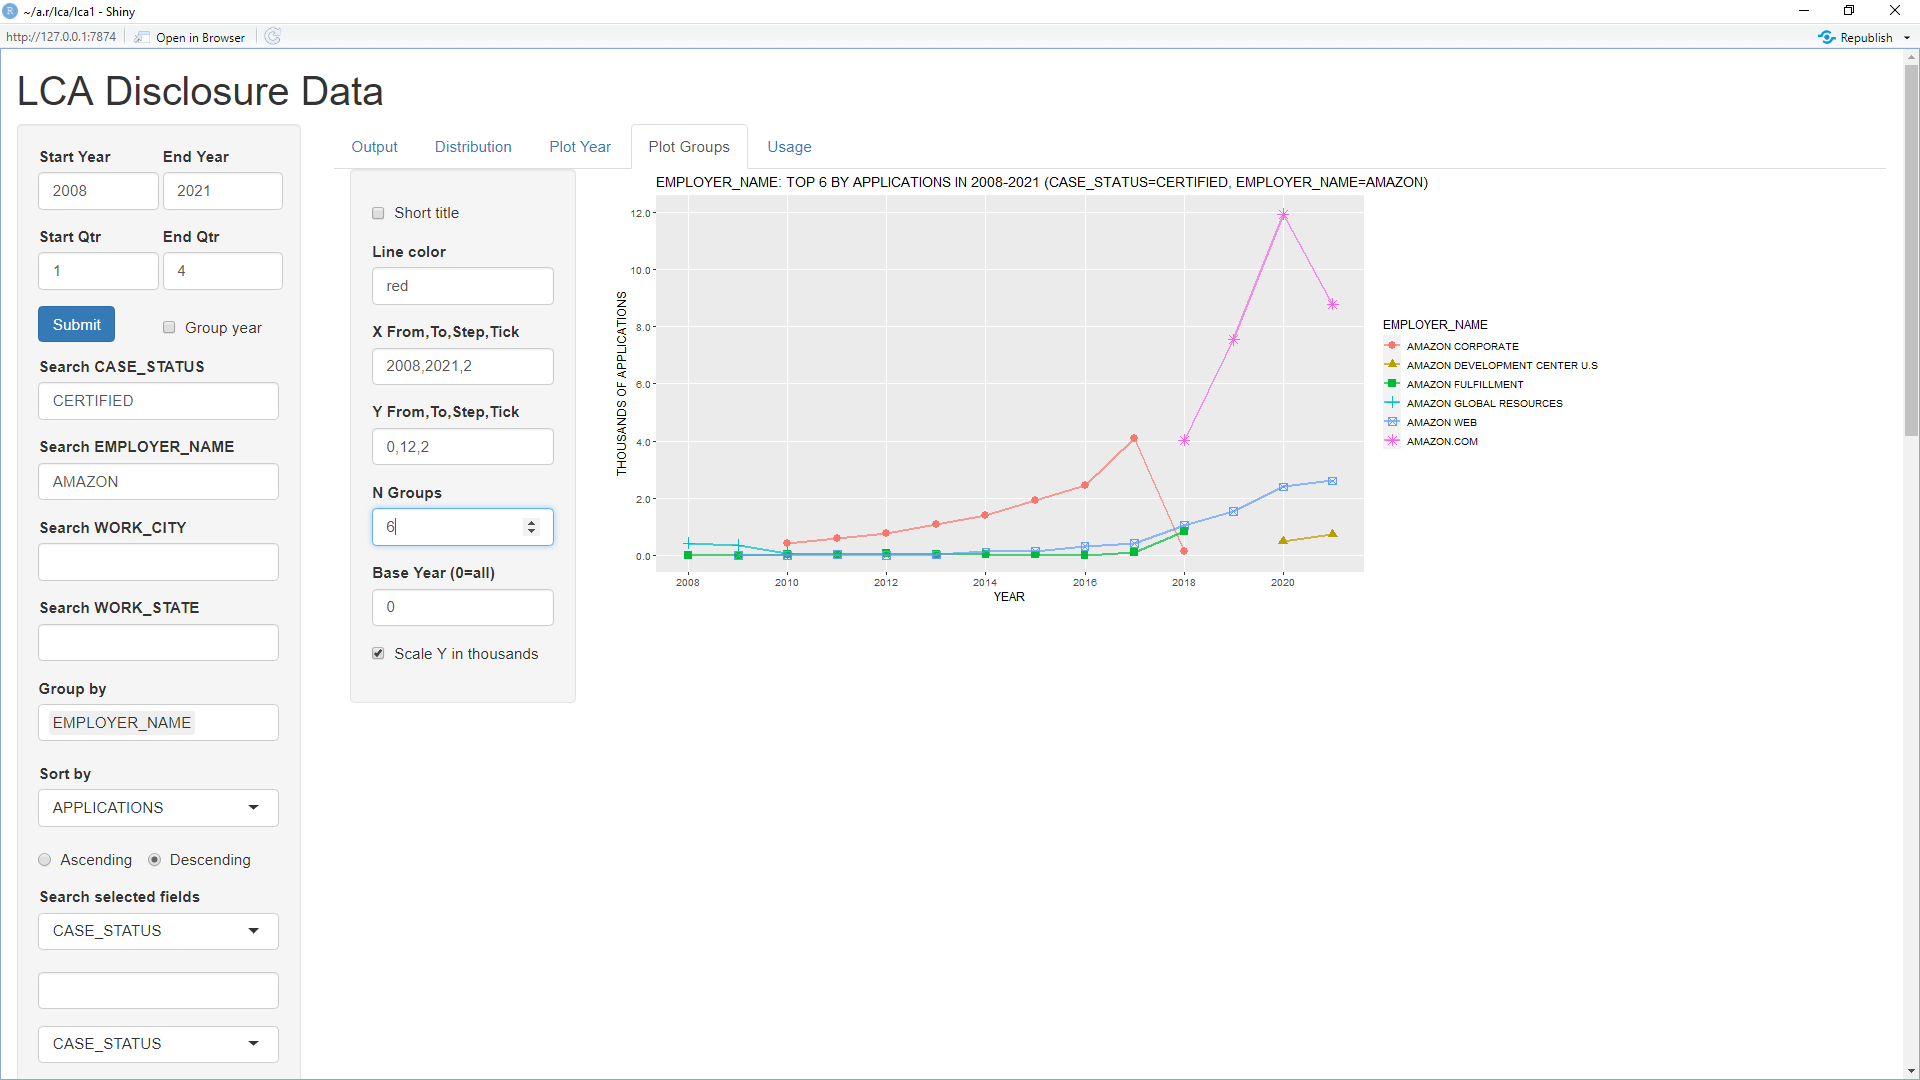
The above graph shows the number of certified applications submitted for the 6 EMPLOYER_NAMEs with the most applications from 2008 through 2021. As can be seen, "AMAZON CORPORATE" was the most common EMPLOYER NAME from 2008 through 2017 and "AMAZON.COM" was the most common EMPLOYER_NAME from 2018 through 2021.
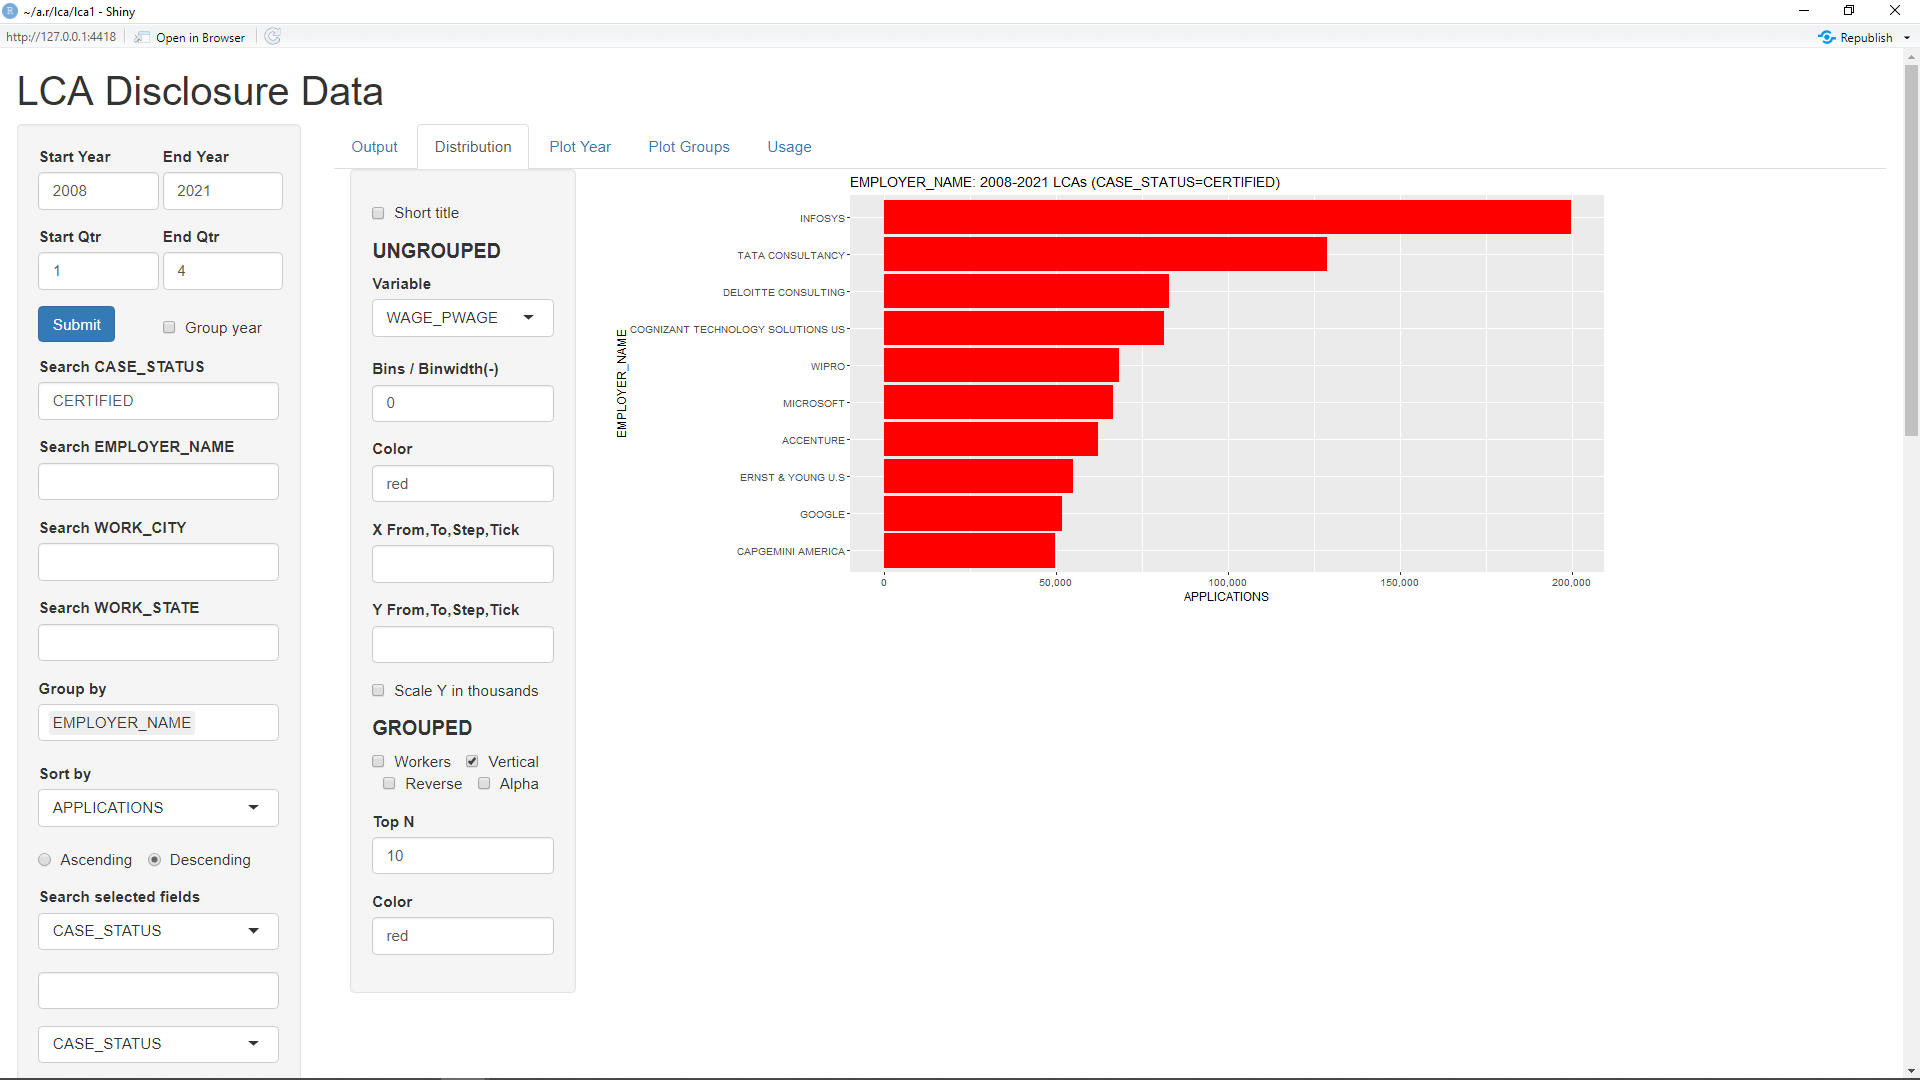
Clicking on the Distribution tab now will display the following screen:
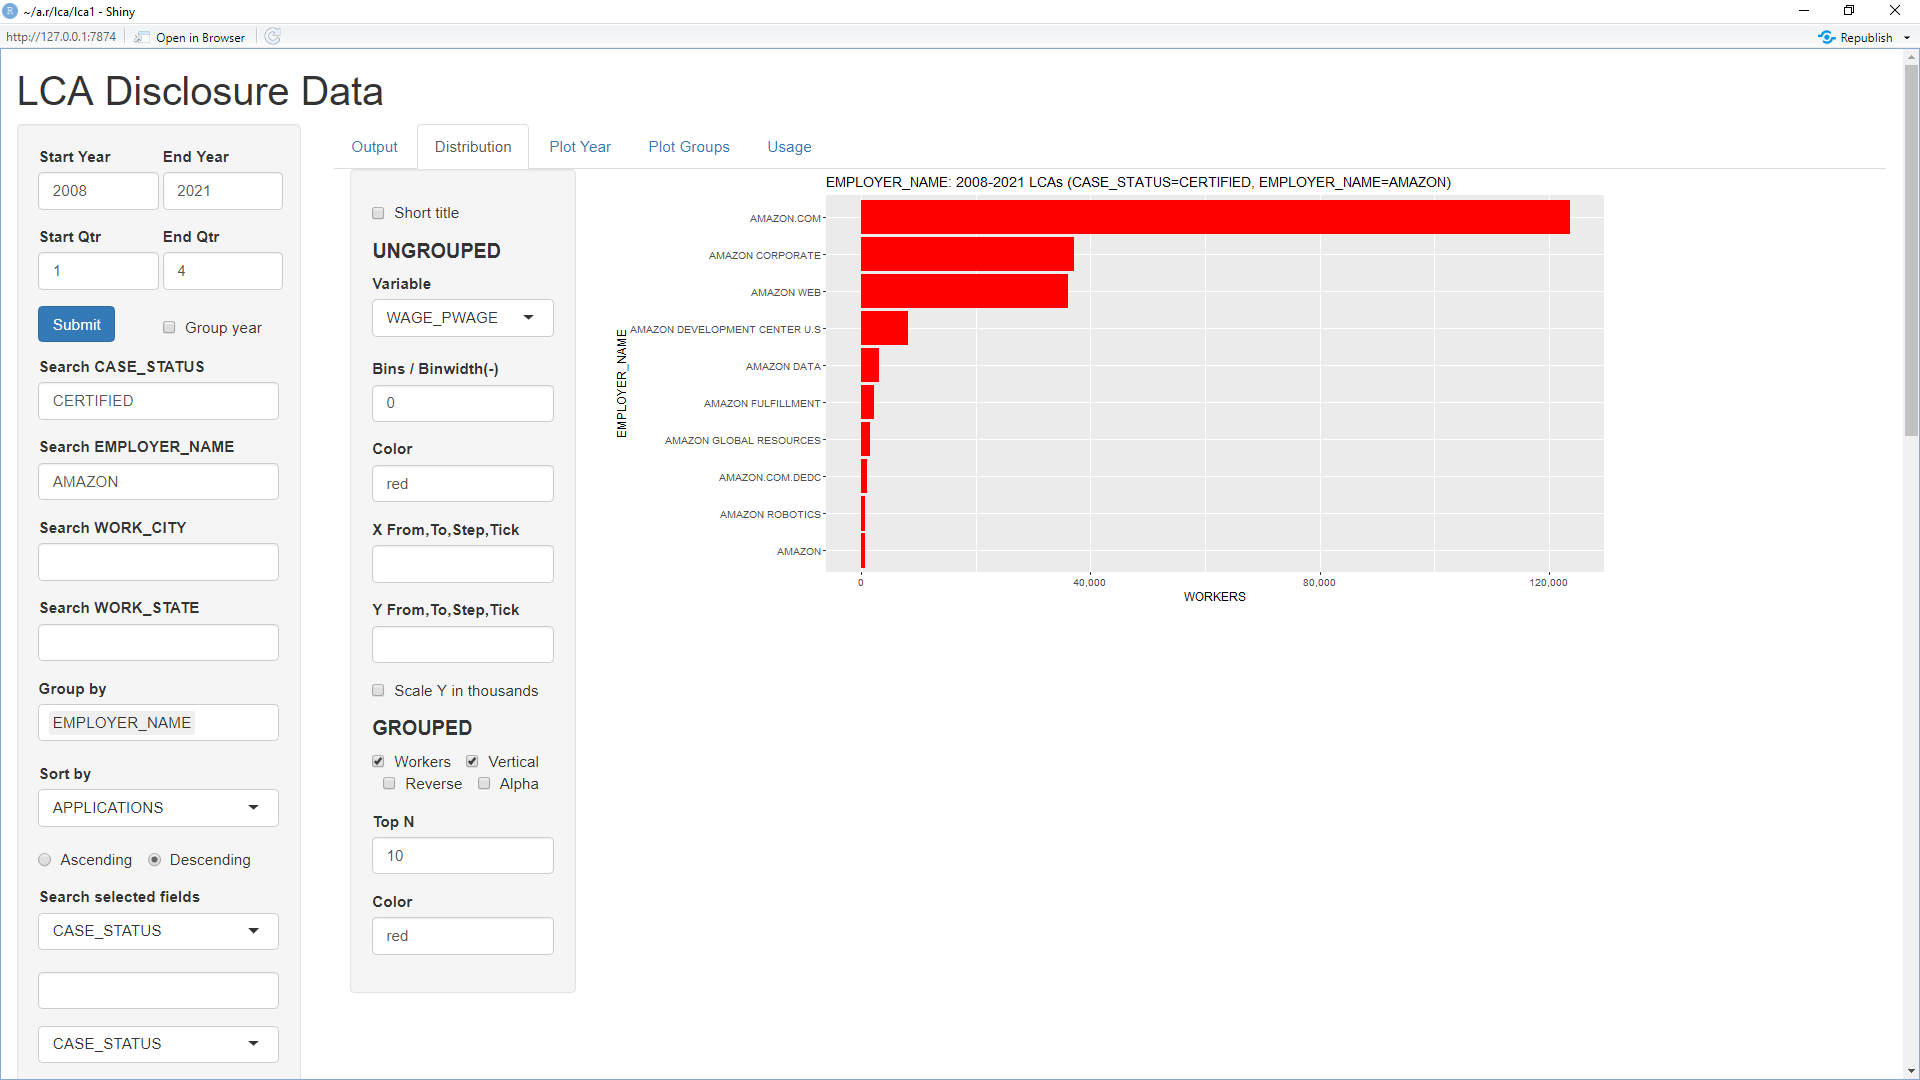
The above is a horizontal bar chart of the 10 EMPLOYER NAMEs with the most WORKERS requested from 2008 through 2021. Unchecking the Workers checkbox and checking the Reverse checkbox will change this to showing the 10 EMPLOYER_NAMES with the most certified APPLICATIONS submitted from 2008 through 2021 and flip the bar chart such that the largest EMPLOYER_NAMEs are at the bottom as shown below:

Displaying Data for Multiple Employers and Years
If the "Search EMPLOYER_NAME" input is set blank (with "Start Year" set to 2008, "End Year" set to 2021", "Group by" set to EMPLOYER_NAME, and "Sort by" set to APPLICATIONS) and the Submit button is clicked, the following output will be displayed:
LCA DISCLOSURE DATA, FY 2008-2021
(CASE_STATUS=CERTIFIED)

NUMBER OF ROWS     = 6,309,176
MEAN(SALARY)       = NaN

   YEAR WORKERS APPLICATIONS
1  2008  706660       404436
2  2009  483203       266230
3  2010  489177       262688
4  2011  671837       307936
5  2012  820431       352668
6  2013  882643       382951
7  2014  925398       455144
8  2015 1161218       547278
9  2016 1186143       569645
10 2017 1070024       545694
11 2018 1199745       579449
12 2019  981669       592102
13 2020  838627       545621
14 2021 1013997       497334

                               EMPLOYER_NAME WORKERS APPLICATIONS
1                                    INFOSYS  353255       199391
2                           TATA CONSULTANCY  219629       128532
3                        DELOITTE CONSULTING  601212        82531
4          COGNIZANT TECHNOLOGY SOLUTIONS US  104397        81139
5                                      WIPRO  498773        67835
6                                  MICROSOFT  102132        66221
7                                  ACCENTURE  101942        61907
8                          ERNST & YOUNG U.S  207689        54506
9                                     GOOGLE   51293        51264
10                         CAPGEMINI AMERICA   91357        49368
11                         IBM INDIA PRIVATE   49384        42806
12                  TECH MAHINDRA (AMERICAS)   64450        42743
13                               HCL AMERICA  184593        42733
14                  LARSEN & TOUBRO INFOTECH   35642        32397
15                                AMAZON.COM  123556        32266
16                                       IBM   28281        27481
17                                     INTEL   40986        22651
18                                  FACEBOOK   43893        20925
19        COGNIZANT TECHNOLOGY SOLUTIONS U.S  466066        20876
20                                     APPLE  173652        20622
21                            JPMORGAN CHASE   20395        19381
22                                UST GLOBAL   22354        19131
23                         DELOITTE & TOUCHE  121877        18359
24                             GOLDMAN SACHS   19429        14606
25                       WAL-MART ASSOCIATES   13326        13210
26                          AMAZON CORPORATE   36908        12882
27                           SATYAM COMPUTER   27432        12831
28                                   MPHASIS  179904        12647
29                  COMPUNNEL SOFTWARE GROUP   13612        12573
30                        IGATE TECHNOLOGIES  133988        12050
31                            ORACLE AMERICA  115456        11742
32                                  NTT DATA   14417        11494
33                                       L&T   11071        11071
34                            SALESFORCE.COM   12824        11009
35                    PRICEWATERHOUSECOOPERS  206759        11000
36                     HEXAWARE TECHNOLOGIES   12029        10435
37                                      KPMG   14623         9812
38                             CISCO SYSTEMS   92355         9655
39                                  MINDTREE   86986         9555
40                           FUJITSU AMERICA   48913         9492
41                     QUALCOMM TECHNOLOGIES  164063         9428
42                       BANK OF AMERICA N.A   12907         9257
43                            PATNI AMERICAS   66224         9230
44                                AMAZON WEB   35899         8669
45                                   CUMMINS   11607         8514
46           PRICEWATERHOUSECOOPERS ADVISORY   38384         8504
47                                    VMWARE    8861         8400
48                                 SYNECHRON   10821         8379
49                                    SYNTEL  114644         8169
50                                      EBAY   11395         7995
The above output shows only the top 50 of over 900 EMPLOYER_NAMEs. Clicking on the "Plot Year" tab and setting the "X From, To, Step, Tick" input to 2008,2021,2 and checking the "Scale Y in thousands" input will display the following screen:
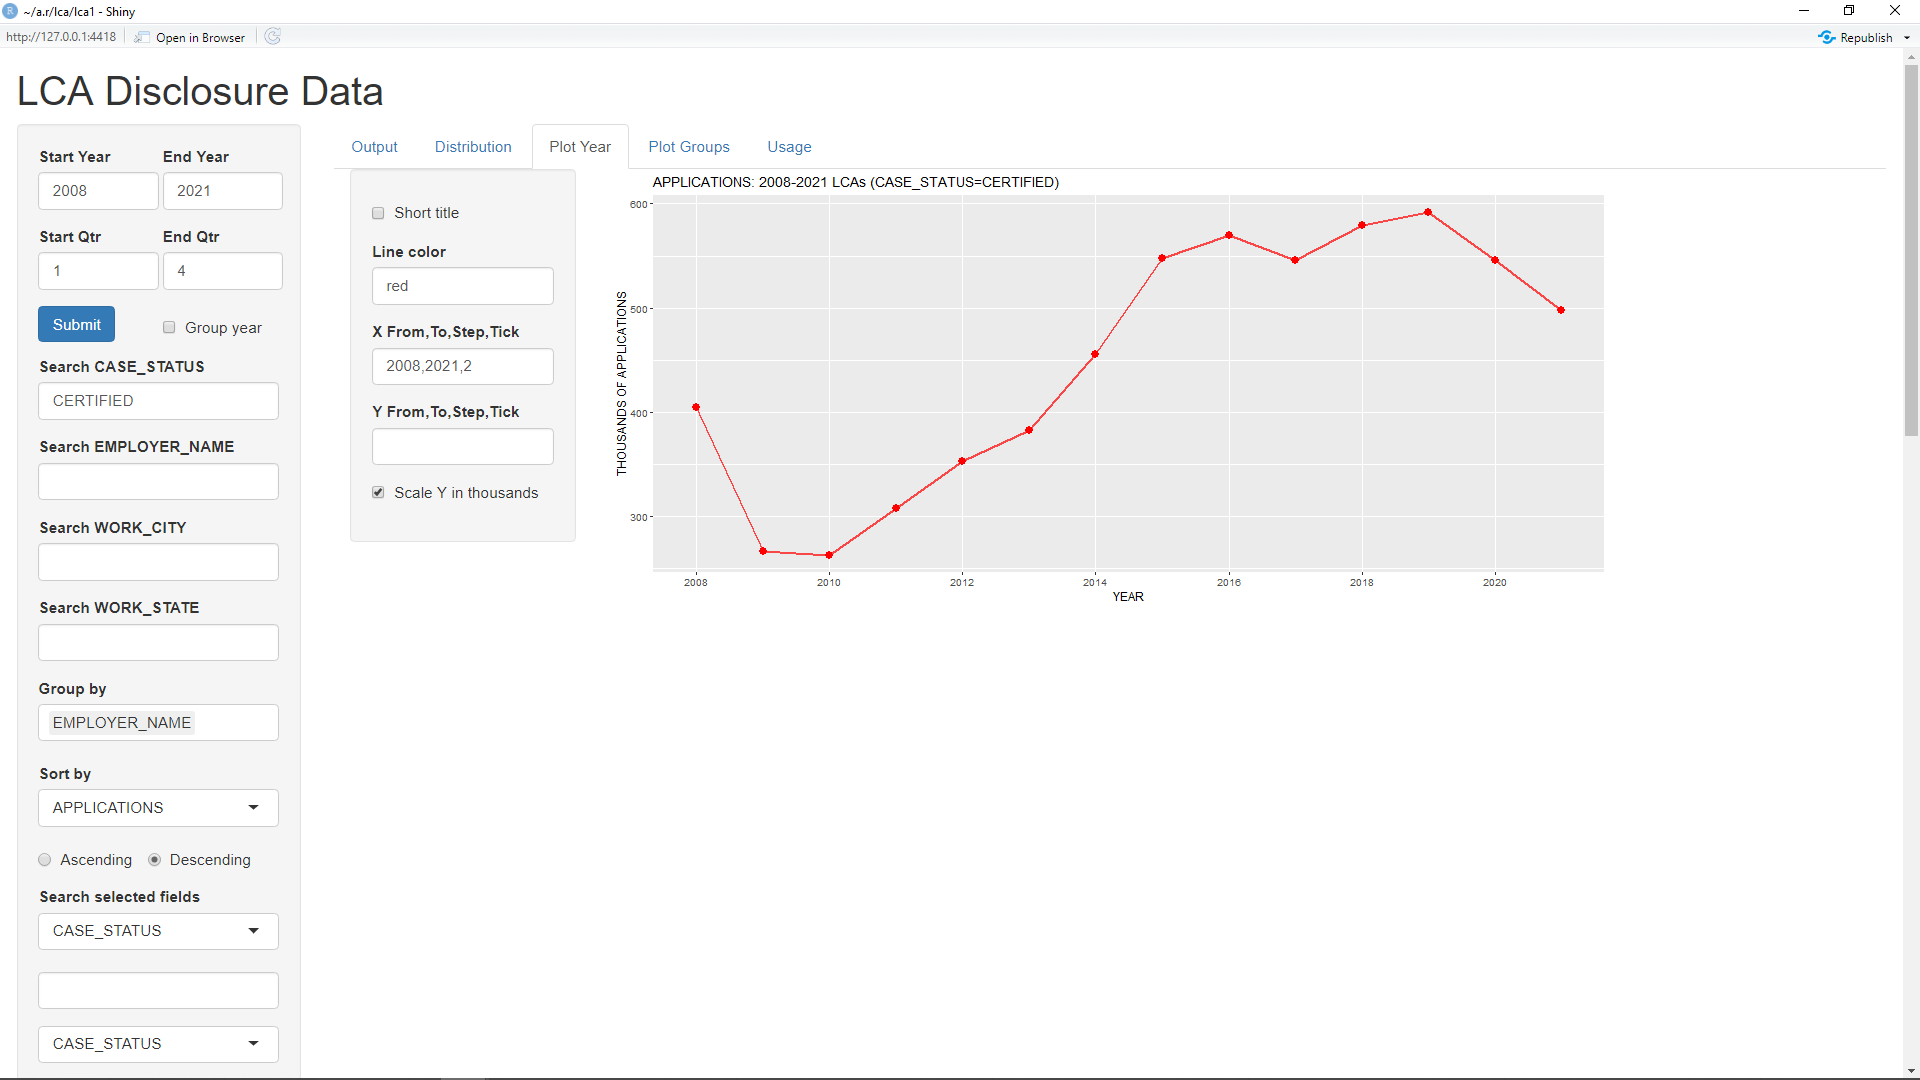
As can be seen, the total number of appications have dropped off during COVID from their prior high in 2019. Now, clicking on the "Plot Groups" tab and setting the "X From, To, Step, Tick" input to 2008,2021,2, setting the "N Groups" input to 7, and checking the "Scale Y in thousands" checkbox will display the following screen:
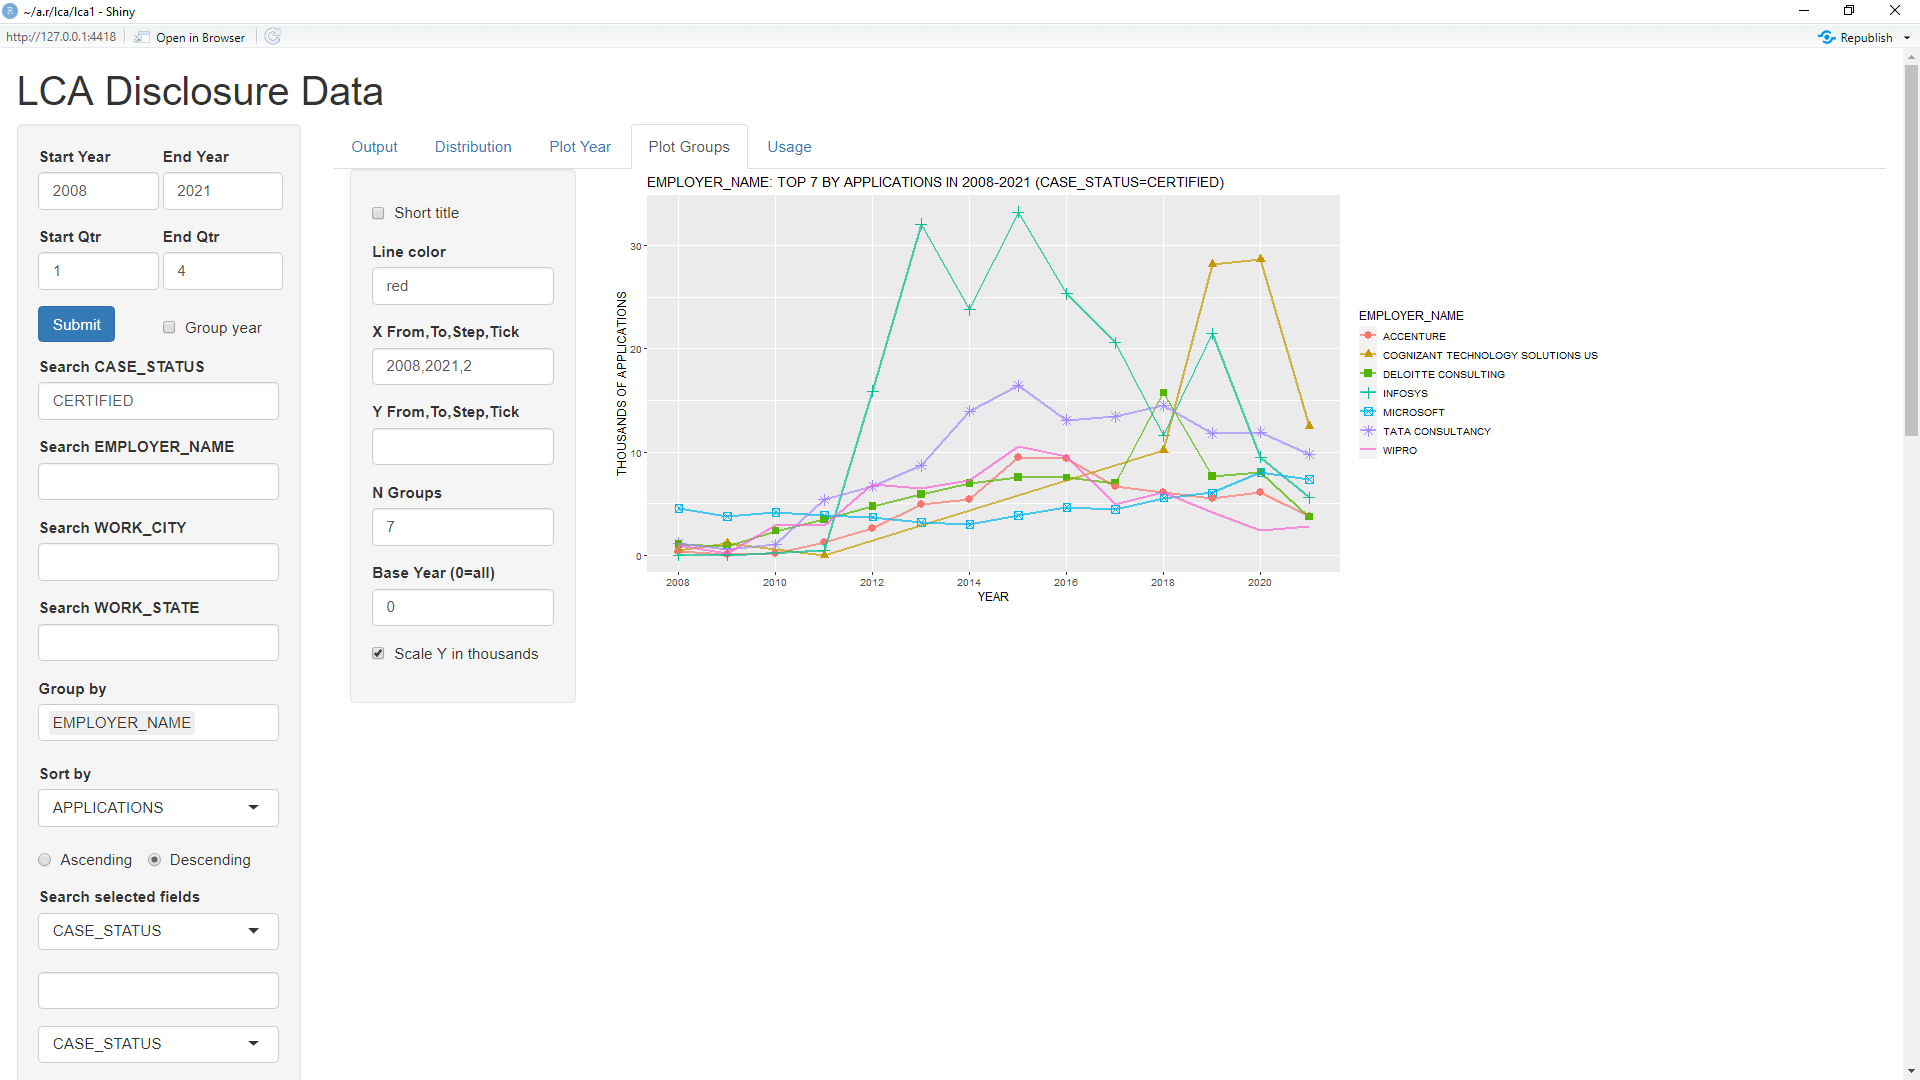
This shows the 7 EMPLOYER_NAMEs that had the most applications over the entire period from 2008 to 2021. As can be seen, 6 out of the 7 are consulting companies with the lone exception being Microsoft. Changing the "Base Year (0=all)" input from 0 to 2021 will display the following screen:

This shows the 7 EMPLOYER_NAMEs that had the most applications over just the year 2021. As can be seen, now only 4 of the 7 are consulting companies with Amazon.com and Google joining Microsoft in the top 7. This makes some sense that the consulting companies which bring in more foreign workers would become less dominating during COVID. In any event, clicking on the Distribution tab now and unchecking the Workers checkbox will display the following screen:
This shows the 10 EMPLOYER_NAMEs with the most applications over the entire period from 2008 to 2021.
Using WAGE_PWAGE to Check Wage Against Prevailing Wage
This page on the U.S. Department of Labor website states the following:
The H-1B employer must pay its H-1B worker(s) at least the “required” wage which is the higher of the prevailing wage or the employer’s actual wage (in-house wage) for similarly employed workers.
Hence, it would appear that the wage offered to an H-1B worker should never be lower than the prevailing wage. For this reason, this application creates the variable WAGE_PWAGE equal to WAGE_RATE_OF_PAY_FROM (the minimum wage being offered) divided by PREVAILING_WAGE (the prevailing wage). If the wage offered is never less than the prevailing wage, then WAGE_PWAGE should never be less than 1. One problem is that WAGE_RATE_OF_PAY_FROM and PREVAILING_WAGE are not guaranteed to be for the same time period. Each can be per hourly, weekly, bi-weekly, monthly, or yearly. For that reason, this app also creates the variables SALARY and PSALARY which convert the actual and prevailing wage to yearly values.
Setting "Start Year" and "End Year" to 2021, setting "Search EMPLOYER_NAME" blank, setting "Sort by" to WAGE_PWAGE, clicking the Ascending radio button, and clicking the Submit button will display all of the applications for 2021 in the order of ascending WAGE_PWAGE. In the "Show" input section, it helps to also check PREVAILING_WAGE, PW_UNIT, and WAGE_UNIT and also uncheck SOC_TITLE (for space). Finally, adding PSALARY, and SALARY to the "Show (other)" input before WAGE_PWAGE will display the following screen:

In all, the output shows 54 lines with WAGE_PWAGE less than 1. However, all but the first 7 are above 0.9 so it is possible that these numbers are correct. Further investigation would be necessary to determine which of these numbers are correct and, if so, how it possible that they were certified when the wage is less than the prevailing wage. In any case, clicking the Descending radio button, and clicking the Submit button will display the following screen.

These values appear much stranger with the first 13 values of WAGE_PWAGE being 2000 or above. The value of WAGE_RATE_FROM for these 13 lines appear to be yearly salaries but the WAGE_UNIT is set to HOUR. Hence, it appears that this was and error and WAGE_UNIT should have been set to YEAR. The value of 2999.00 for WAGE_RATE_FROM in the 14th line is tougher to figure out. It could be that 2999.00 is a weekly salary or it could be that it was entered incorrectly and should have been 29.99 as an hourly salary. This latter error does not appear to be that uncommon. Following are the lines containing the 8 values of WAGE_PWAGE that are closest to 10:
    YEAR CASE_STATUS TOTAL_WORKERS                            EMPLOYER_NAME            WORK_CITY WORK_STATE WAGE_RATE_FROM WAGE_UNIT PREVAILING_WAGE PW_UNIT      SALARY   PSALARY  WAGE_PWAGE
47  2021   CERTIFIED             1                     OBVIOUSLEE MARKETING             BROOKLYN         NY      450000.00      YEAR        44179.00    YEAR    450000.0  44179.00   10.185835
48  2021   CERTIFIED             1                                   PAYPAL             SAN JOSE         CA     1480000.00      YEAR       145725.00    YEAR   1480000.0 145725.00   10.156116
49  2021   CERTIFIED             1                    UNIVERSITY OF GEORGIA               ATHENS         GA      230000.00      YEAR        22910.00    YEAR    230000.0  22910.00   10.039284
50  2021   CERTIFIED             1                           SCIENBIZIP P.C          LOS ANGELES         CA      865000.00      YEAR        86403.00    YEAR    865000.0  86403.00   10.011226
51  2021   CERTIFIED             1                     QUANTUM TECHNOLOGIES            SUNNYVALE         CA     2080000.00      YEAR       208000.00    YEAR   2080000.0 208000.00   10.000000
52  2021   CERTIFIED             1                  AUTOMATION TECHNOLOGIES              HOUSTAN         TX      919728.00      YEAR        91978.00    YEAR    919728.0  91978.00    9.999435
53  2021   CERTIFIED             1                        BAUER COMPRESSORS              NORFOLK         VA      632632.80      YEAR        63294.00    YEAR    632632.8  63294.00    9.995146
54  2021   CERTIFIED             1                  NORTHWESTERN UNIVERSITY             EVANSTON         IL      405000.00      YEAR        40830.00    YEAR    405000.0  40830.00    9.919177
The prevailing wages look fairly reasonable, ranging from $22,910 to $208,000. The $22,910 is for a SOC_TITLE of "BUSINESS TEACHERS, POSTSECONDARY" and the $208,00 is for a SOC_TITLE of "SOFTWARE DEVELOPERS, SYSTEMS SOFTWARE". However, the values of WAGE_RATE_FROM range from $230,000 to $2,080,000. It would seem possible that the decimal was placed one place to the right of where it should have been in these numbers. This is especially the case for $2,080,000 which happens to be exactly 10 times the prevailing wage.
Just as sorting by WAGE_PWAGE turned up errors in the data in the prior section, sorting by other variables can turn up errors as well. That's because erroneous data can often turn up at either end of a sort. For example, setting "Sort by" to WORK_CITY and clicking the "Ascending" button displays the following screen:
It's also possible to find errors using regex patterns in the Search inputs. For example, setting "Search WORK_CITY" to "[A-Z]+[0-9]+[A-Z]*" (without the quotes) will display the following screen:

This regex pattern will find all cases of WORK_CITY that begin with one or more letters, followed by one or more numbers, and then optionally followed by letters. In this way, it should find values of WORK_CITY that contain numbers but were not caught in the previous sort. This regex pattern could probably be improved to handle special characters that are not alphanumric.
Note: This application is under continuing development. If anyone should run into any issues or have any suggestions for additional features, feel free to let me know via the Contact box at the bottom of this page.
H-1B and Related Data