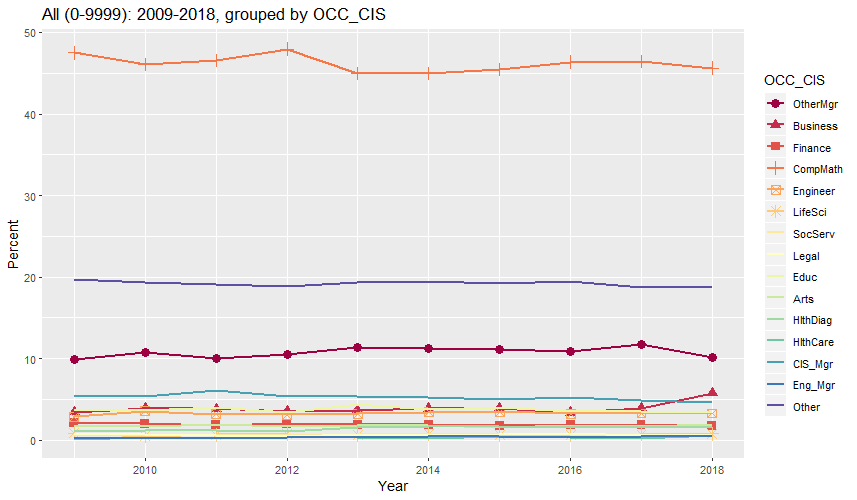
The graph and table below show that, from 2009 to 2018, between about 45 and 48 percent of workers with degrees in Computer and Information Sciences worked in non-managerial jobs in Computer and Mathematical Occupations. About 5 percent of them did work as managers in those occupations. However, between about 10 to 12 percent did work as managers in other occupations. Another 3 and 4 percent worked in Business Occupations except in 2018 when this ticked up to 5.8 percent. Another 3 to 4 percent worked in Education Occupations and another 2.8 to 3.6 percent worked in Engineering Occupations. The rest worked in other occupations.
All (0-9999): 2009-2018, grouped by OCC_CIS (percent)

   Year     Count OtherMgr Business Finance CompMath Engineer LifeSci SocServ Legal Educ Arts HlthDiag HlthCare CIS_Mgr Eng_Mgr Other
1  2009 1,343,573      9.9      3.4     2.1     47.5      2.8     0.9     0.6   0.8  3.7  1.7      1.1      0.1     5.4     0.3  19.7
2  2010 1,368,867     10.7      3.9     2.0     46.1      3.6     0.5     0.7   0.7  3.7  1.7      1.1      0.3     5.4     0.3  19.3
3  2011 1,432,507     10.0      3.8     1.8     46.5      3.2     0.6     0.6   0.6  4.0  1.9      1.2      0.3     6.1     0.2  19.1
4  2012 1,523,101     10.6      3.5     2.0     48.0      3.1     0.7     0.5   0.5  3.4  1.7      1.0      0.3     5.4     0.3  18.9
5  2013 1,601,883     11.3      3.7     1.9     44.9      3.2     0.6     0.6   0.7  4.4  1.8      1.5      0.3     5.4     0.3  19.3
6  2014 1,693,275     11.3      3.9     1.9     44.9      3.4     0.8     0.7   0.6  3.8  1.8      1.6      0.2     5.2     0.4  19.5
7  2015 1,817,014     11.1      3.9     1.8     45.5      3.5     0.6     0.7   0.7  4.0  1.6      1.7      0.4     4.9     0.4  19.2
8  2016 1,904,097     10.8      3.4     1.9     46.3      3.2     0.6     0.7   0.8  3.5  1.8      1.6      0.3     5.2     0.4  19.4
9  2017 2,019,757     11.7      3.9     1.8     46.4      3.3     0.7     0.5   0.6  3.5  1.6      1.6      0.3     4.9     0.5  18.7
10 2018 2,117,159     10.2      5.8     1.8     45.6      3.3     0.8     0.7   0.7  3.4  1.9      1.7      0.5     4.6     0.5  18.7

URL parameters (short)=
?minyear=2009&maxyear=2018&STATE=&xrange1=DEGFIELD&minrange1=21&maxrange1=21&geo=NATION&occ=All%20(0-9999)&group=OCC_CIS&sortn=4&color=Spectral&geomtype=Line%20Graph
The graph and table below show that, from 2009 to 2018, between 25 and 30 percent of workers with degrees in Engineering and Engineering Technologies worked in non-managerial jobs in Architecture and Engineering Occupations. Just between 2 and 2.5 percent of them did work as managers in those occupations. However, between about 16 to 19 percent did work as managers in other occupations. Another 12 and 14 percent of them worked in Computer and Mathematical Occupations and another 3.9 to 4.5 percent worked in Education Occupations. Another 3 to 4 percent worked in Business Occupations except for in 2018 when this ticked up to 6.1 percent. The rest worked in other occupations.
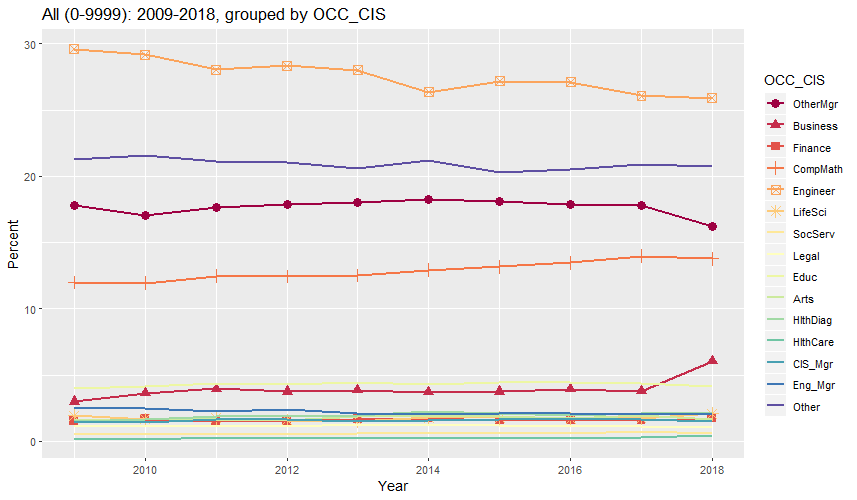
All (0-9999): 2009-2018, grouped by OCC_CIS (percent)

   Year     Count OtherMgr Business Finance CompMath Engineer LifeSci SocServ Legal Educ Arts HlthDiag HlthCare CIS_Mgr Eng_Mgr Other
1  2009 3,818,719     17.8      3.0     1.5     12.0     29.6     1.9     0.6   1.1  3.9  1.5      1.5      0.2     1.4     2.5  21.3
2  2010 3,845,545     17.1      3.6     1.6     11.9     29.2     1.7     0.5   1.2  4.1  1.6      1.7      0.2     1.4     2.5  21.6
3  2011 3,942,745     17.6      3.9     1.5     12.5     28.0     1.8     0.5   1.1  4.4  1.6      1.8      0.3     1.6     2.2  21.1
4  2012 4,074,800     17.8      3.7     1.5     12.4     28.4     1.6     0.5   1.1  4.3  1.6      1.8      0.2     1.6     2.4  21.0
5  2013 4,196,628     18.0      3.9     1.7     12.5     28.0     1.5     0.6   1.2  4.4  1.8      1.9      0.2     1.5     2.1  20.6
6  2014 4,312,552     18.3      3.7     1.7     12.9     26.4     1.8     0.6   1.2  4.3  1.9      2.2      0.2     1.5     2.0  21.2
7  2015 4,486,196     18.1      3.7     1.6     13.2     27.2     1.8     0.6   1.2  4.5  1.9      2.1      0.2     1.6     2.1  20.3
8  2016 4,632,783     17.9      3.9     1.6     13.5     27.1     1.7     0.6   1.1  4.4  1.7      2.0      0.2     1.7     2.1  20.5
9  2017 4,874,045     17.8      3.8     1.6     14.0     26.1     1.7     0.7   1.1  4.4  2.0      2.1      0.3     1.7     2.0  20.9
10 2018 5,049,842     16.2      6.1     1.8     13.8     25.9     2.1     0.6   1.0  4.1  1.6      2.1      0.5     1.5     2.1  20.7

URL parameters (short)=
?minyear=2009&maxyear=2018&STATE=&xrange1=DEGFIELD&minrange1=24&maxrange1=25&geo=NATION&occ=All%20(0-9999)&group=OCC_CIS&sortn=4&color=Spectral&geomtype=Line%20Graph
Start  End
Code  Code  Abbreviation  Full Title
----  ----  ------------  ----------
0010  0499  OtherMgr      Other Management Occupations (other than CIS_Mgr and Eng_Mgr below)
0500  0799  Business      Business Operations Specialists
0800  0999  Finance       Financial Specialists
1000  1299  CompMath      Computer and Mathematical Occupations
1300  1599  Engineer      Architecture and Engineering Occupations
1600  1999  LifeSci       Life, Physical, and Social Science Occupations
2000  2099  SocServ       Community and Social Services Occupations
2100  2199  Legal         Legal Occupations
2200  2599  Educ          Education, Training, and Library Occupations
2600  2999  Arts          Arts, Design, Entertainment, Sports, and Media Occupations
3000  3599  HlthDiag      Healthcare Practitioners and Technical Occupations
3600  3699  HlthCare      Healthcare Support Occupations
0110  0110  CIS_Mgr       Computer and information systems managers
0300  0300  Eng_Mgr       Architectural and engineering managers
      else  Other         Other Occupations