
Following is the initial screen displayed by the application:
The screen initially shows a default test portfolio as defined by a main portfolio file. This file must be created by the user and it specifies all of these downloaded files and their formats. The contents of the input files can be seen by clicking on the InputFiles tab. Following is the resulting screen, showing the contents of all of the files that define the default test portfolio:
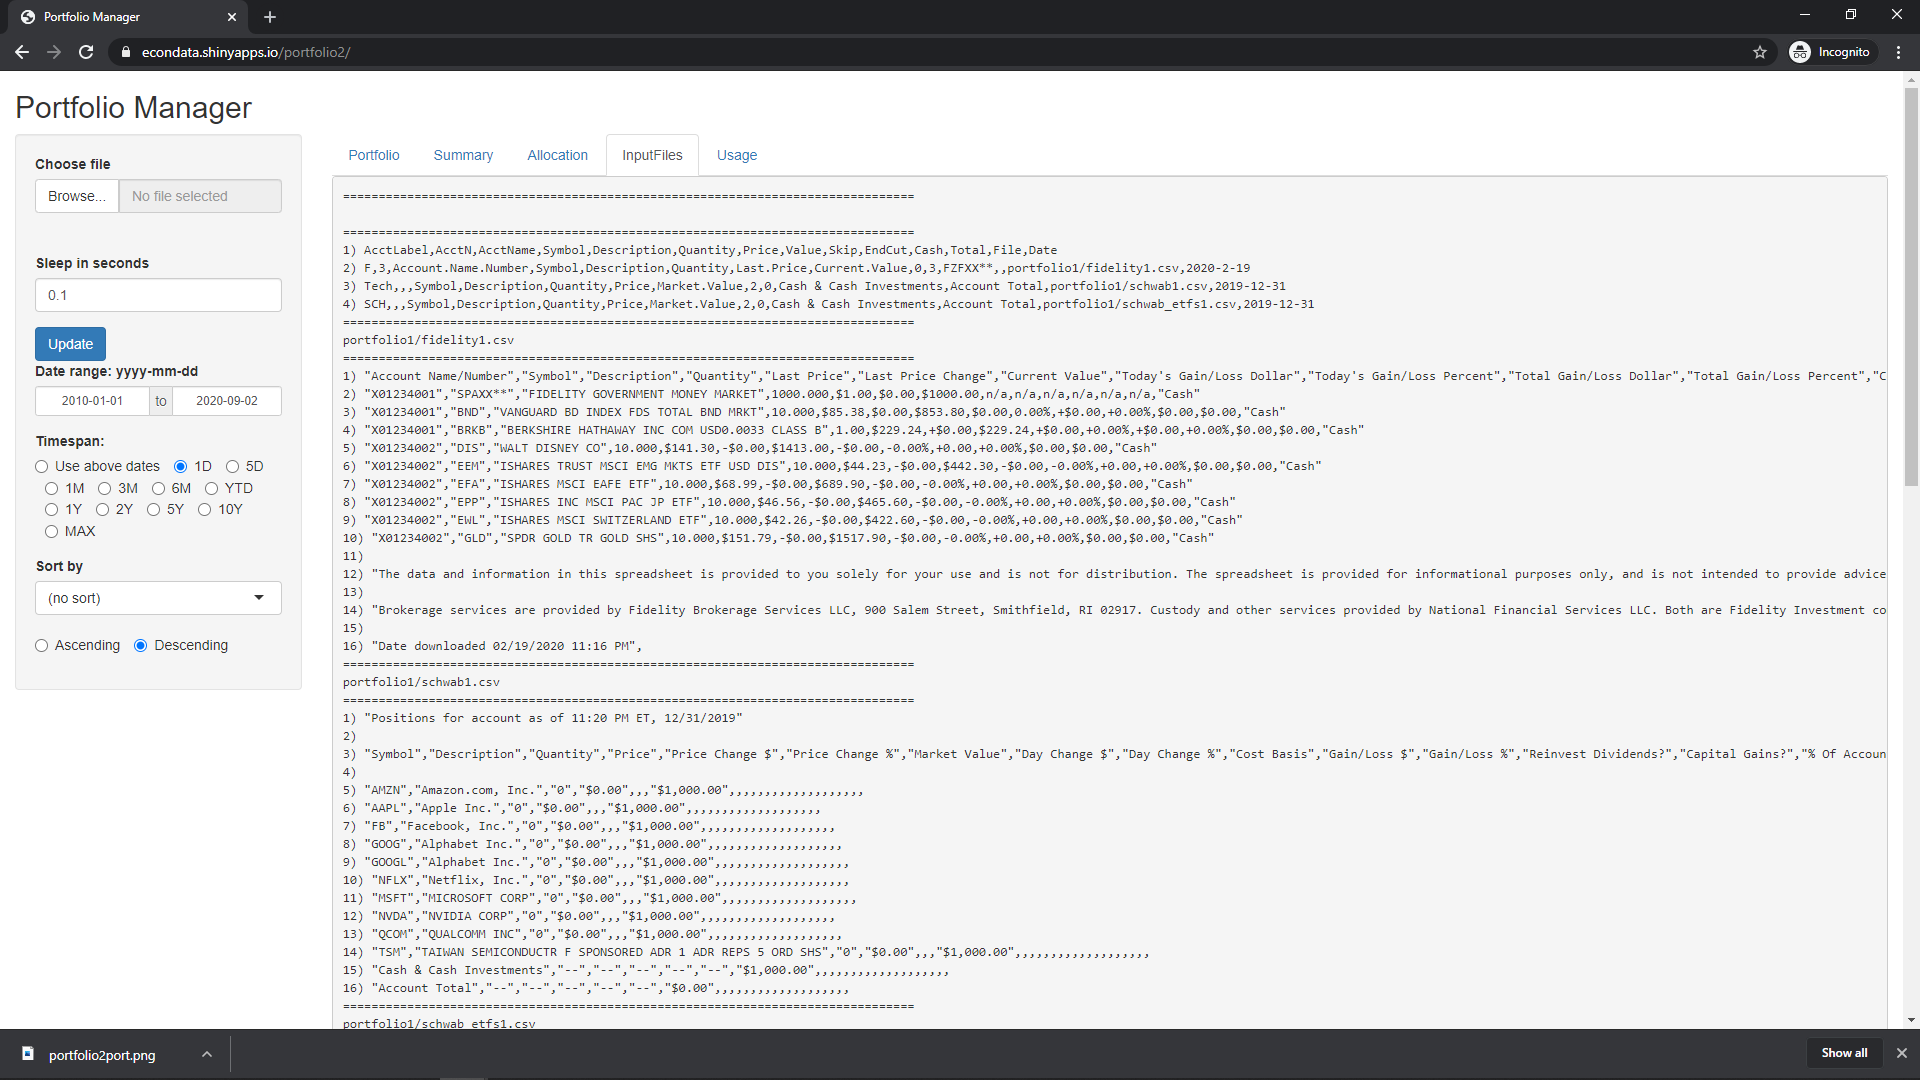
The first file shown is the main portfolio file. The first row contains the column headers and the remaining rows define the location and format for the files that make up the portfolio. Following are the column headers and descriptions of each column:
Column name  Description
-----------  -----------
AcctLabel    Initial characters of the displayed account name
AcctN        Number of characters at the end of AcctName (below) to append to AcctLabel (above)
AcctName     Column name of the account name in the input file, if one exists
Symbol       Column name of symbols in the input file
Description  Column name of asset description in the input file
Quantity     Column name of quantity (ammount or number of shares) from the input file
Price        Column name of price in the input fle
Value        Column name of asset value in the input file
Skip         Number of rows to skip at the beginning of the input file
EndCut       Number of rows to skip at the end of the input file
Cash         Default symbol used for cash in the input file
Total        Default symbol used for account total in the input file
File         Full path of the file, either the full absolute path or the path relative to the working directory
Date         The date associated with the values given in the input file
The second file shown is a test file based on an actual file downloaded from a Fidelity Investments account. The numbers have been changed and most of the unused numbers have been set to zero. The first, second, and fourth numbers in each line correspond to Quantity, Price, and Value and are identical to the numbers in the initial Portfolio tab screenshot shown above. The account names in that screen of 'F001' and 'F002' were created by starting with the AcctLabel value of 'F' and appending the last three characters from the 'Account Name/Number' column.
The third file shown is a test file based on an actual file downloaded from a Charles Schwab account. As can be seen, this file does not contain a account name column and the account name is set to 'Tech' as specified by AcctLabel on line 3 of the first file. In this third file, the unused columns are all set as empty. In addition, all of the quantities and prices are set to zero and the asset values are set to $1,000. In effect, this creates a watch list. When an asset's price is zero, it is set to the price of the asset on the date given by the Date column above. If quantity is zero, it is then set to the specified asset value divided by the price. This serves to create a dummy portfolio or watch list in which all of the assets had a value of $1,000 on the given Date of 12/31/2019.
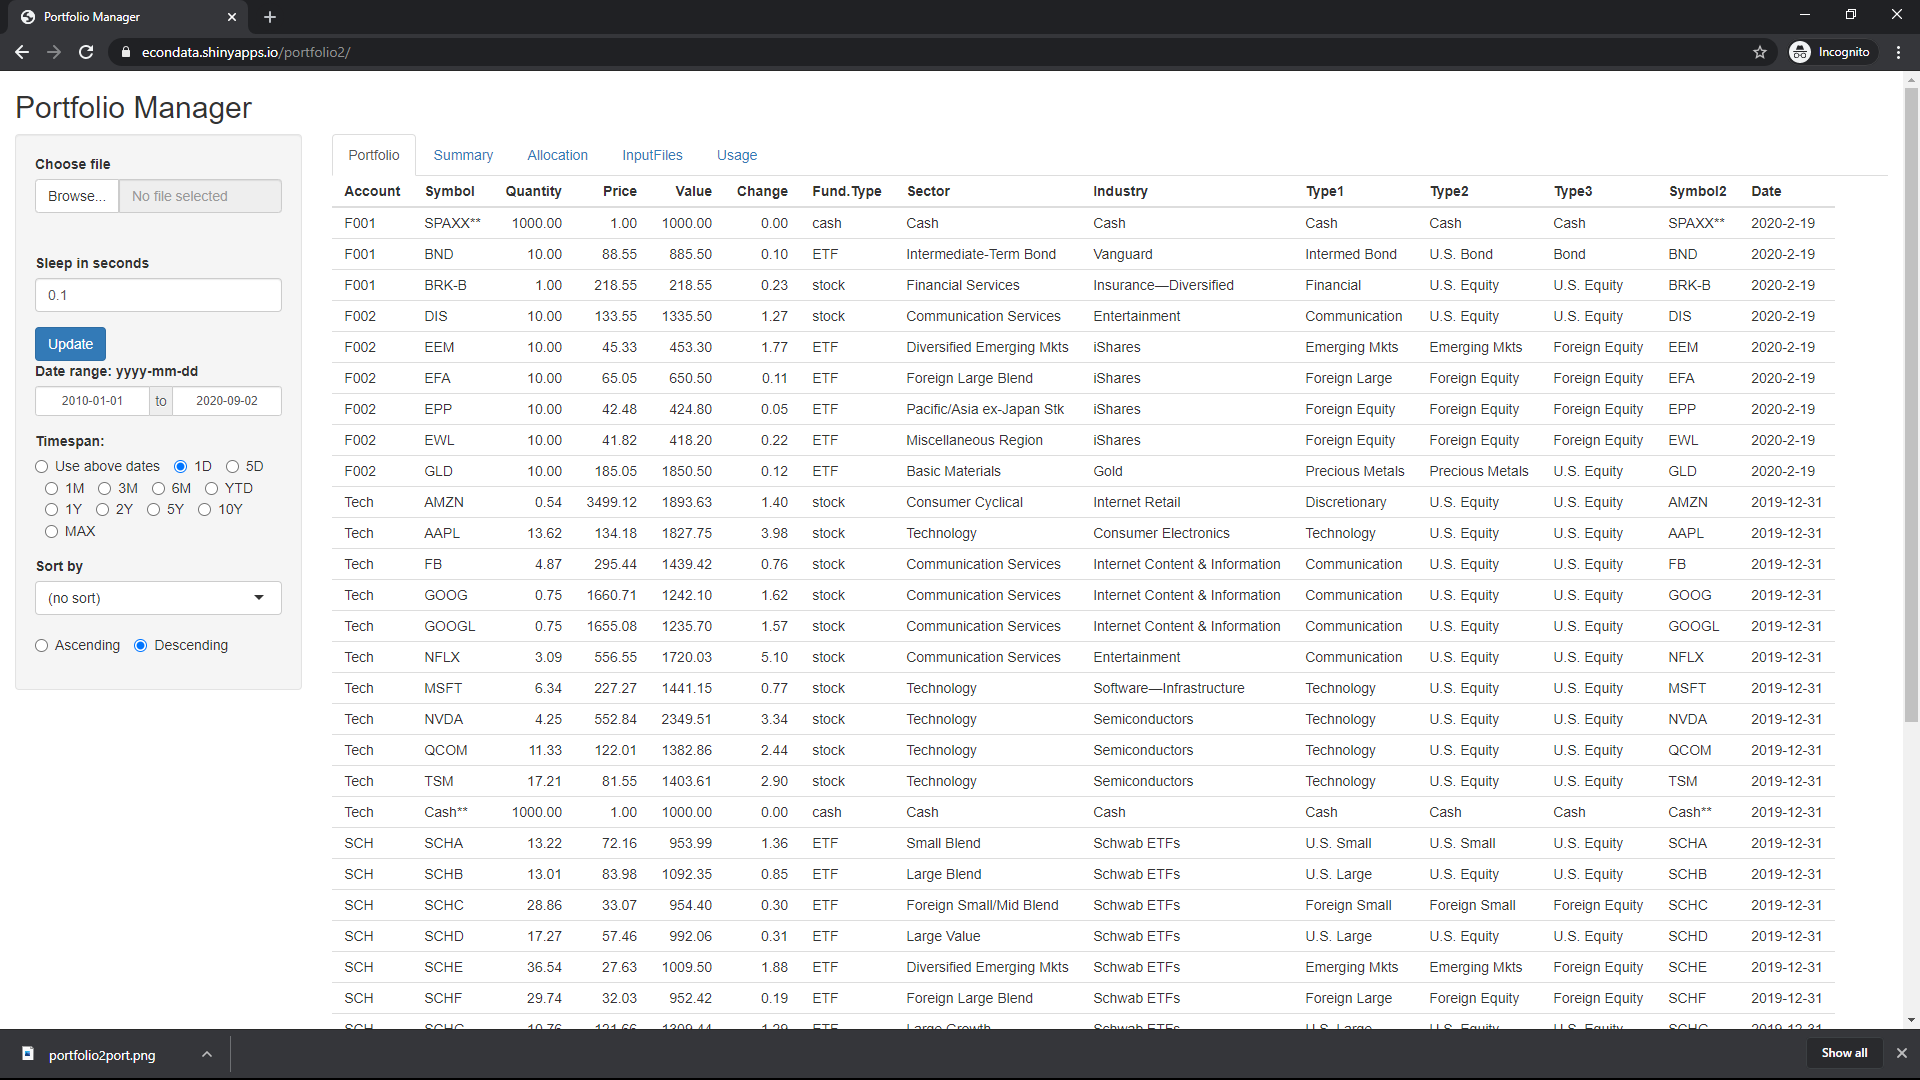
Going back to the Portfolio tab, note that Change is set to zero for every asset. This is the percent change of the assets between the closing price specified by the Timespan input and the current price. In order to get the current price, hit the 'Update' button once. The screen will then update to something like the following:
Now change the 'Sort by' select list to 'Change'. The screen will do a descending sort on the Change column and result in the following:
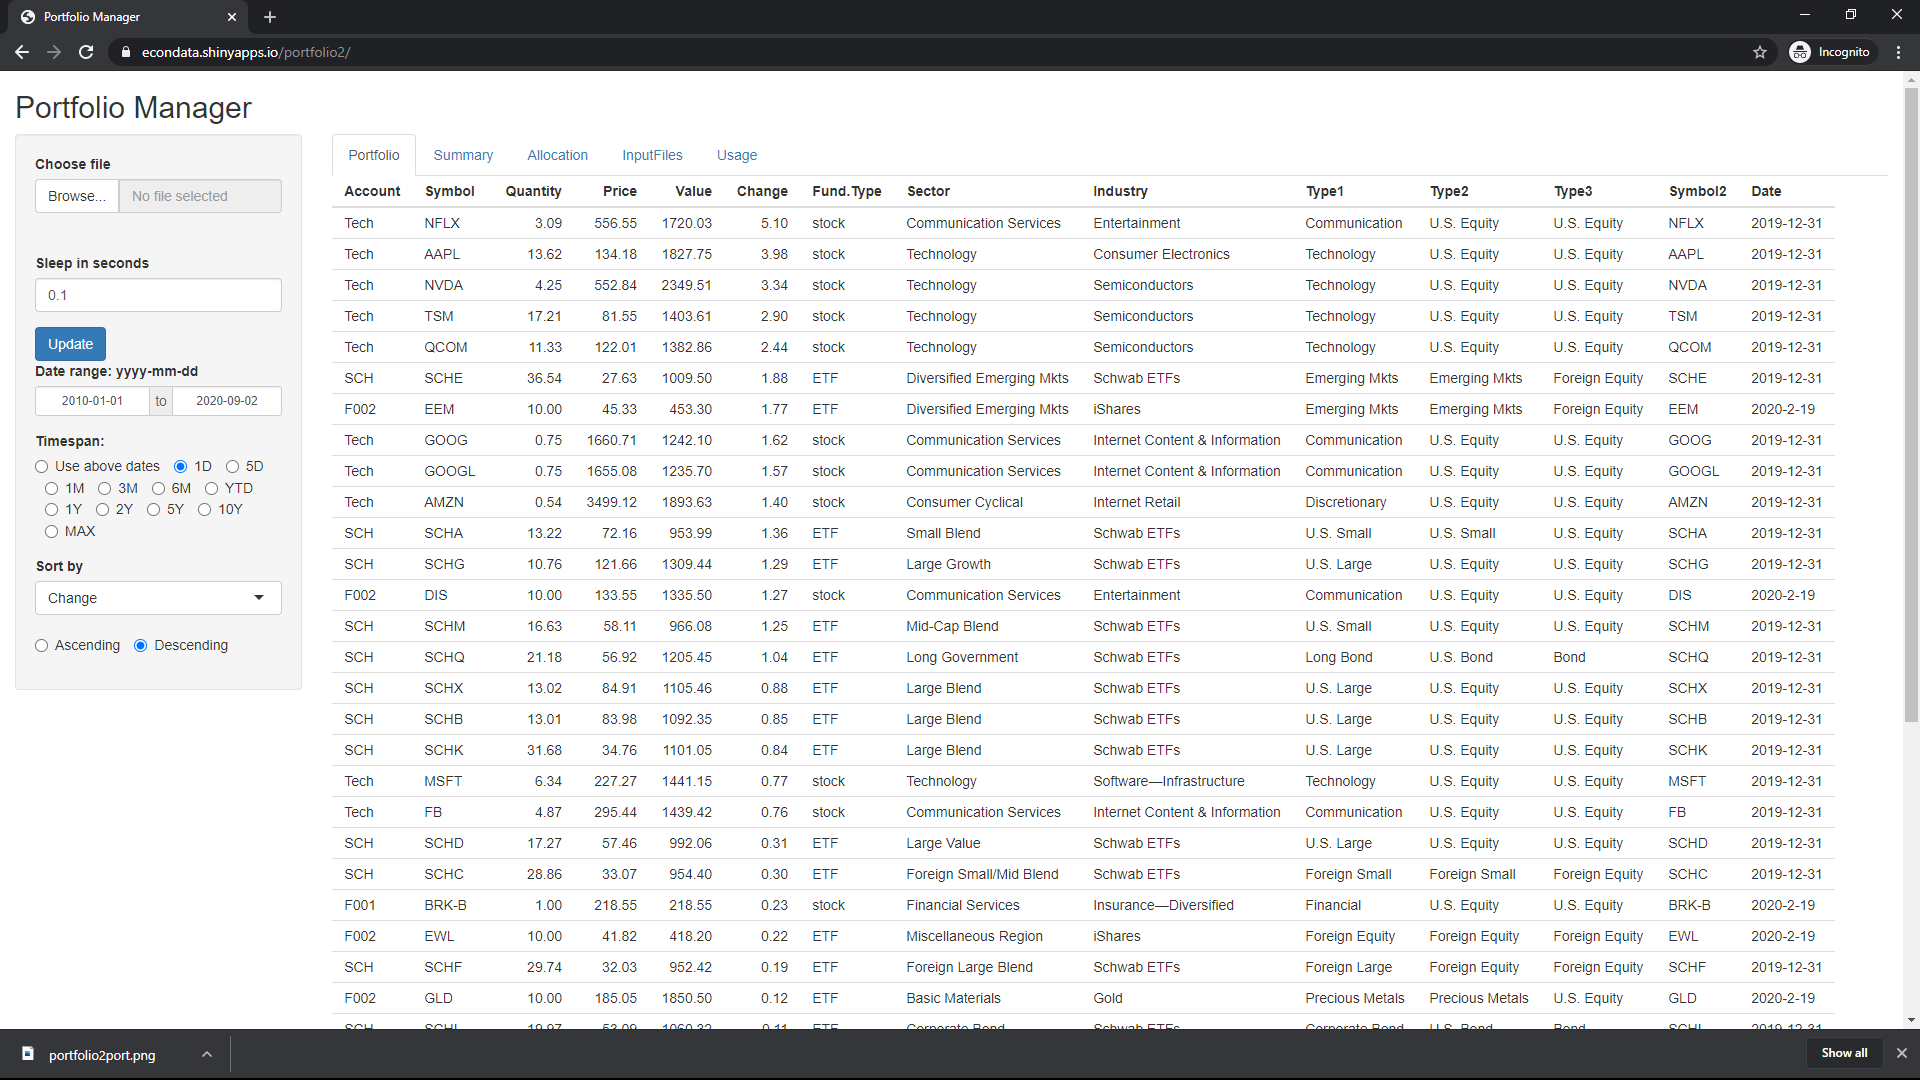
As can be seen, NFLX had the largest gain on this day (September 1, 2020) of 5.10 percent. This matches the gain shown on the Yahoo Finance page. To find the largest changes since the beginning of the year, set the 'Timespan' select list to 'YTD' (Year To Date). This results in the following:
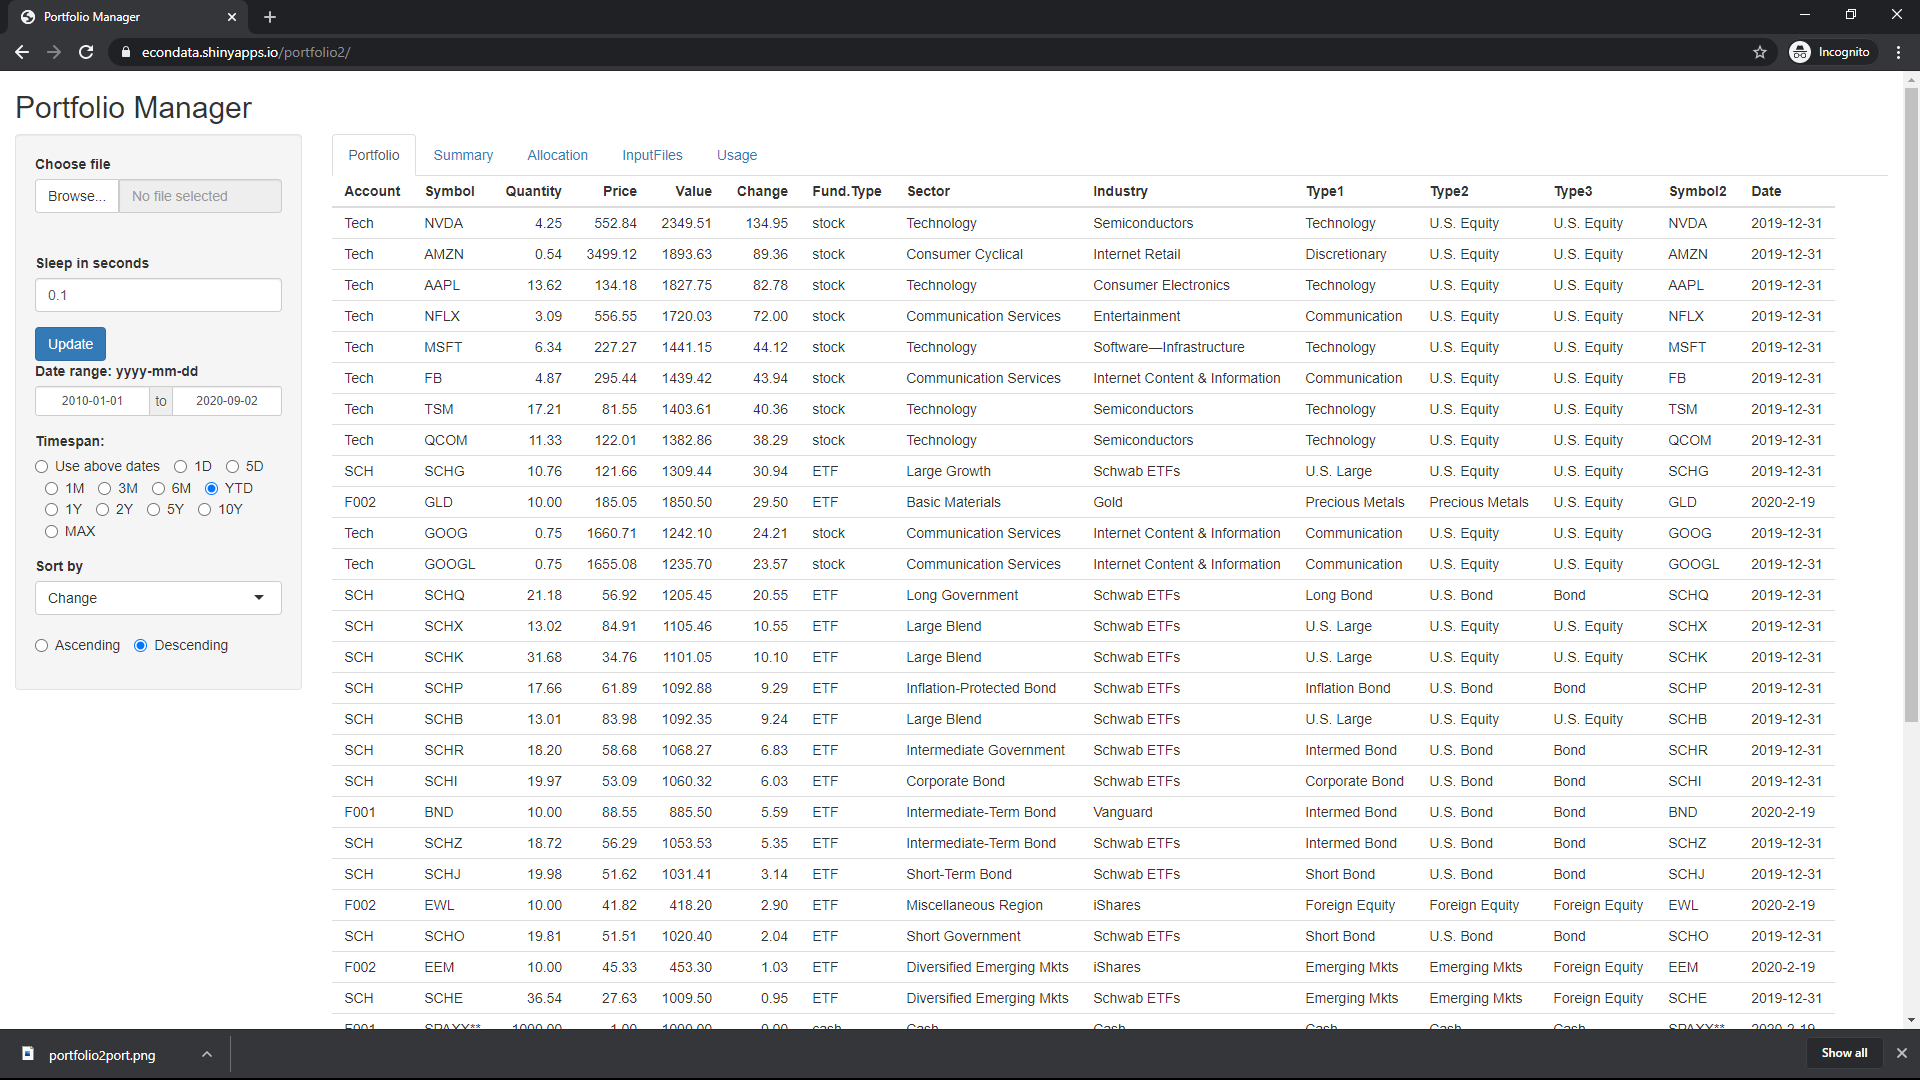
As can be seen, NVDA has had the largest gain of 134.95 percent. This matches with the fact that its value of $2349.51 is 134.951 percent greater the its value of $1000 at the close of business on December 31, 2019. This is the correct measure of YTD (Year To Date). Most of the other selections for Timespan measure from the current date. '5D' is 5 days before September 1st which would be the closing price on August 27, 2020. The one exception is '1D'. Up until the start of each trading day, it measures the change between the last closing price and the closing price of the day before that. Once a trading day starts, it measures the change between the current price and the prior closing price.
The following table lists all of the columns listed on the Portfolio tab:
Column     Description
---------  -----------
Account    The account name as specified by the AcctLabel in the main Portfolio file, followed by the last AcctN characters of the column specified by AcctName, if given.
Symbol     The symbol of the asset.  Unrecognized symbols are assumed to be cash or cash-equivalent.
Quantity   The number of shares except for cash positions for which it is equal to the cash value.
Price      The price of the asset accept for cash position for which it is equal to 1.
Value      The current value of the asset.
Change     The percent change since the time specified by the Timespan selector.
Fund.Type  The type of fund.  This can be stock, ETF, fund, or cash.
Sector     The sector as specified by the Yahoo Profile page in the Sector(s) field for a stock, the Category field for an ETF or fund, or 'Cash' for a cash position.
Industry   The industry as specified by the Yahoo Profile page in the Industry field for a stock, the 'Fund Family' field for an ETF or fund, or 'Cash' for a cash position.
Type1      These are the most detailed asset classifications.
Type2      These are the second most detailed asset classifications.
Type3      These are the least detailed asset allocations.
Symbol2    Repeat of the symbol of the asset.
Date       Date connected with the prices each secondary portfolio file.
Selecting the Allocation tab results in the following screen:
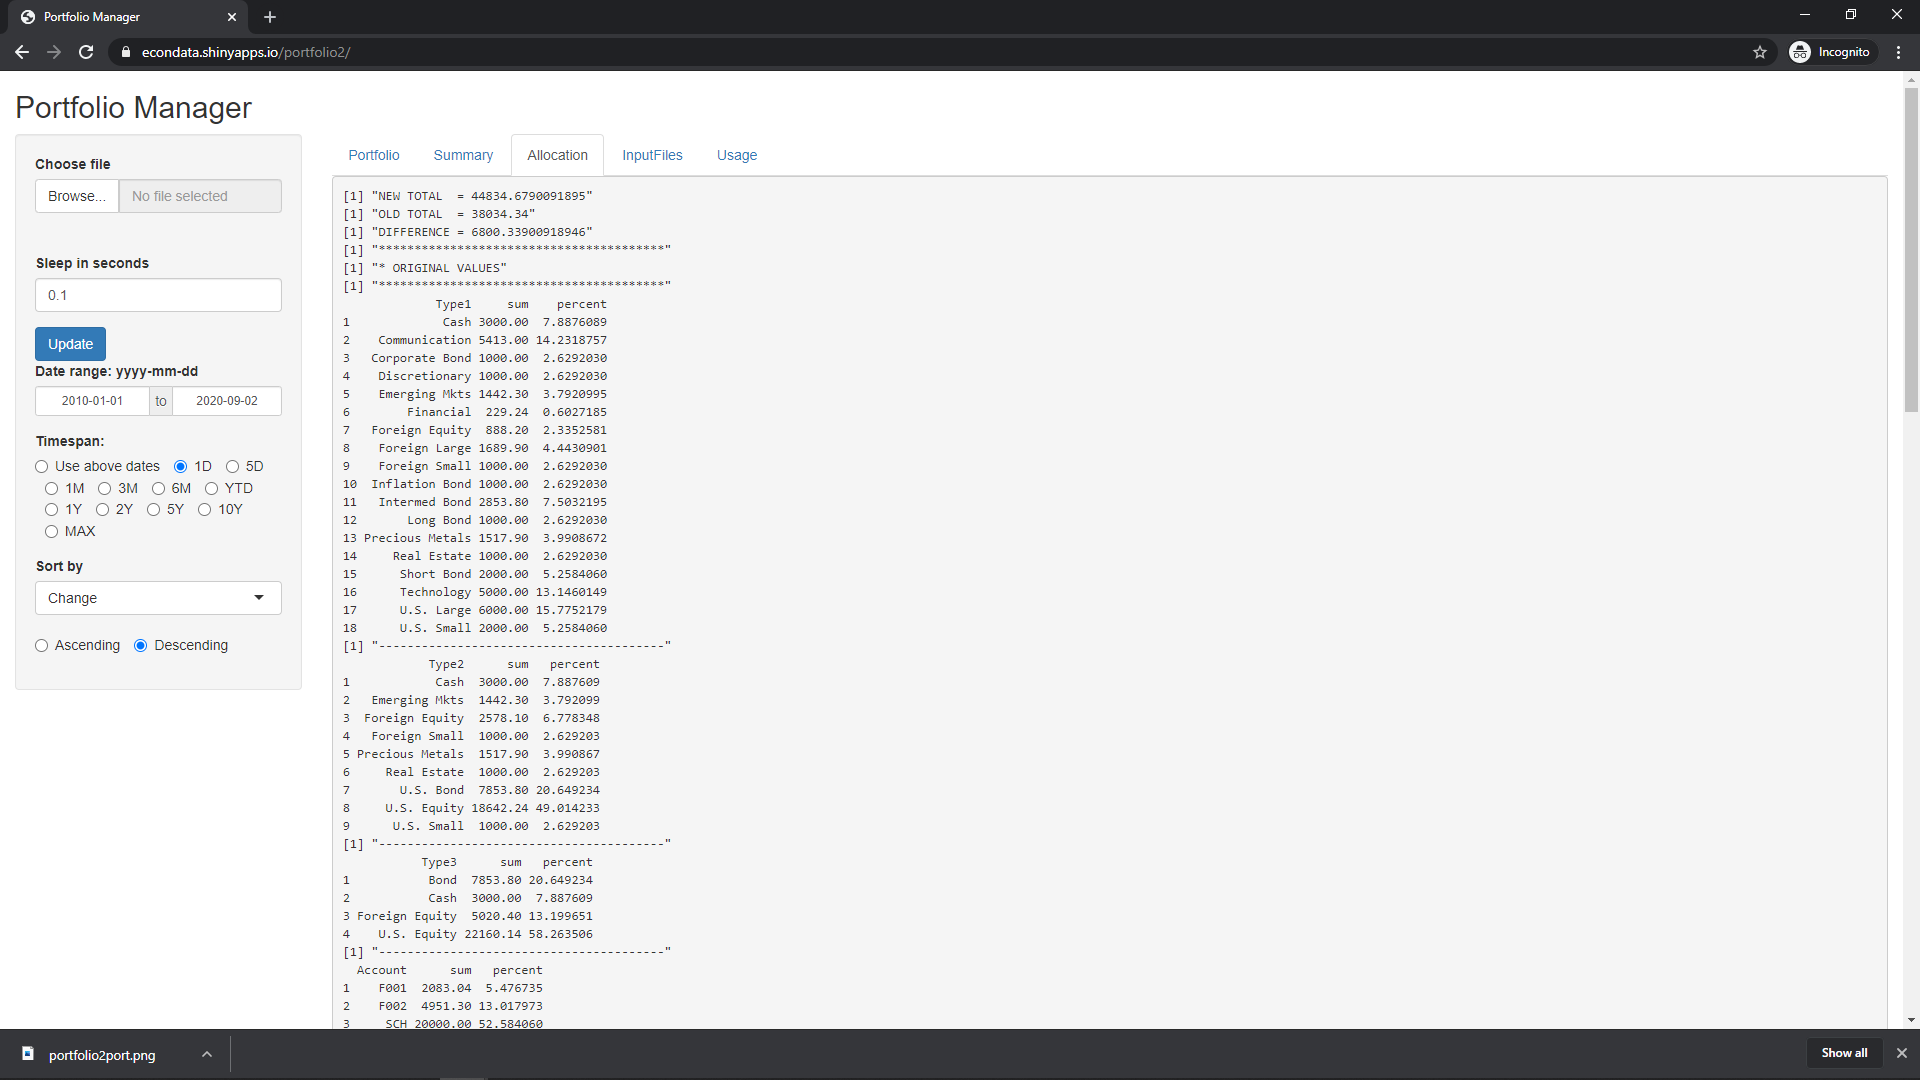
The first line give the total value of the portfolio using the newest prices obtained when the Update button was last pressed. The second line gives the total value of the portfolio as shown by the secondary portfolio files. This total may not be totally consistent since the files may contain snapshots of different points in time as specified by Date in the primary portfolio file. In any case, the third line, shows the difference between the first two lines.
The next section shows the asset allocation of the original portfolio as given by the secondary portfolio files. Scrolling down the page results in the following:
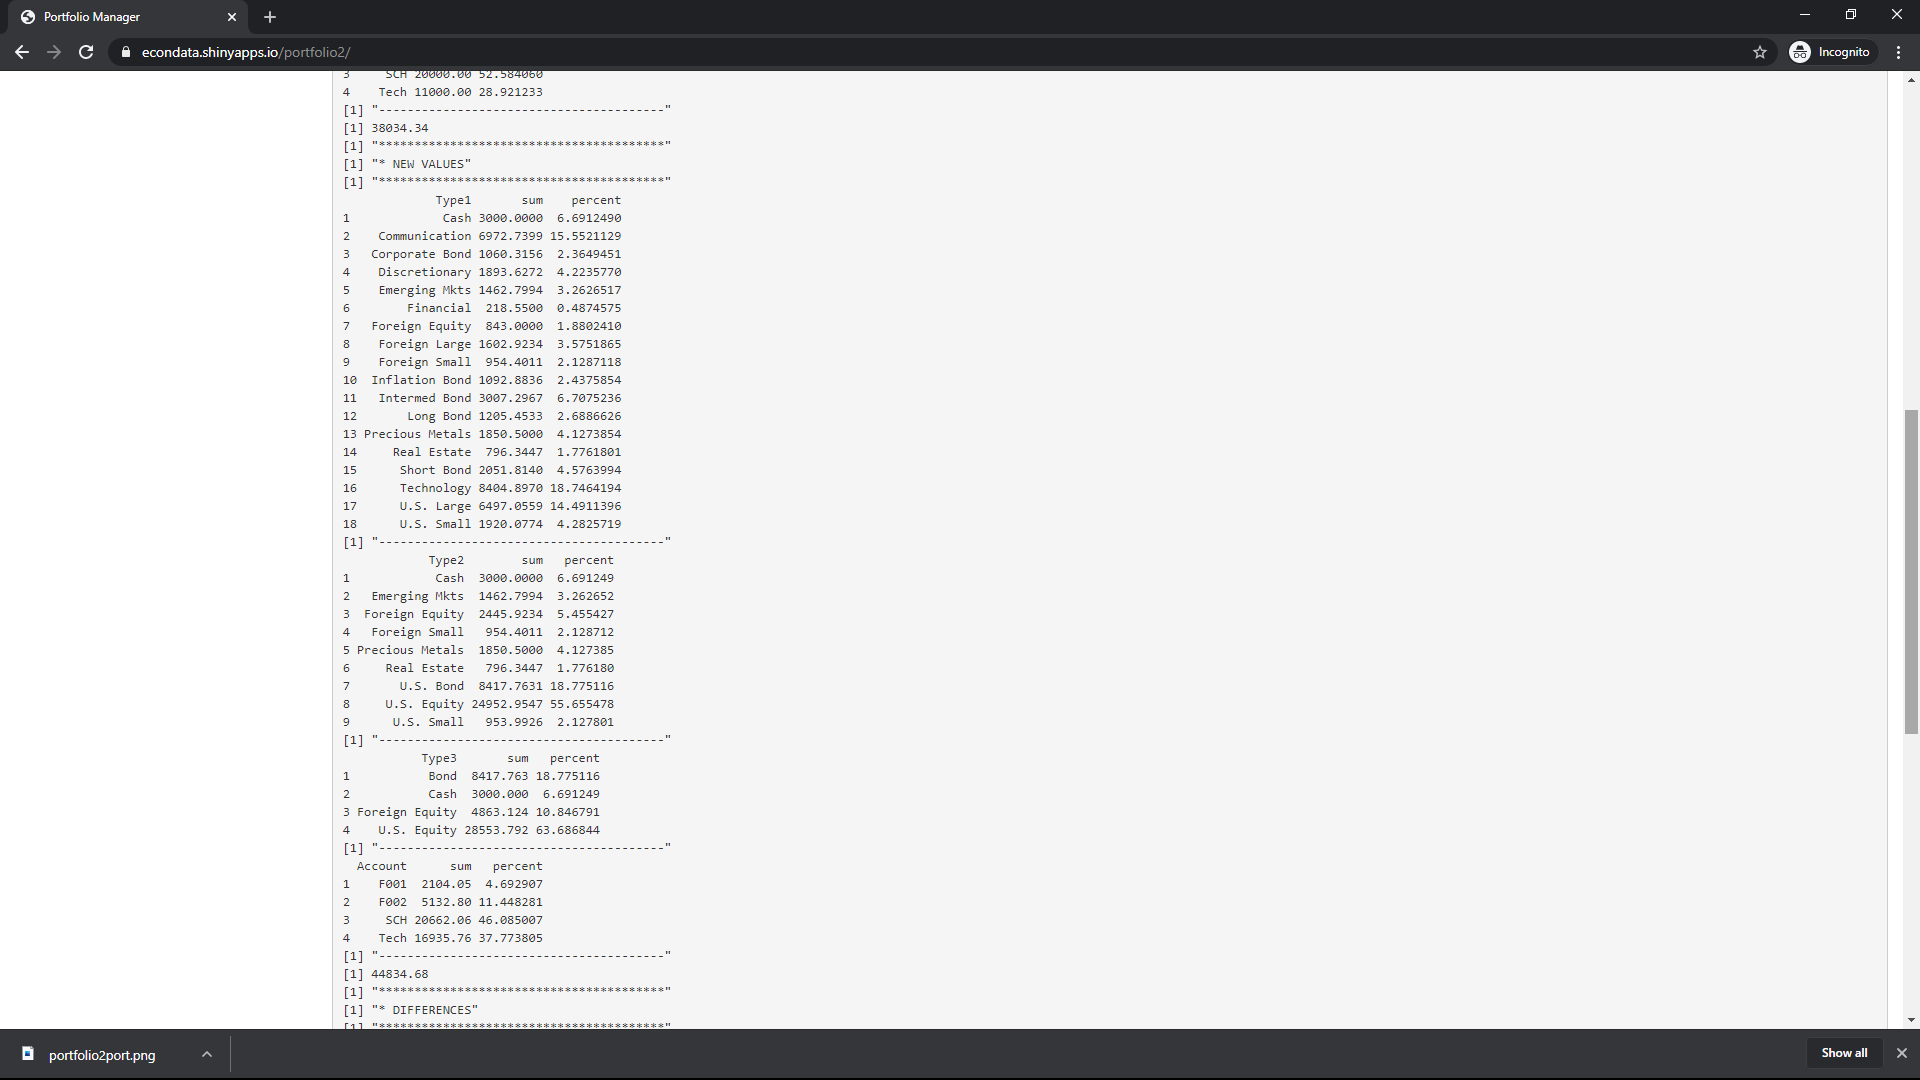
Under the header "NEW VALUES" are the asset allocations of the portfolio using the newest prices obtained when the Update button was last pressed. Type 1 are the most detailed asset categories, Type 2 are the next most detailed asset categories, and Type 3 are the least detailed asset categories. Type 3 only consists of Bond, Cash, Foreign Equity, and U.S. Equity. As shown from the screenshots above, the allocation of Bonds, Cash, and Foreign Equity shrank from 20.6, 7.9, and 13.2 in the original portfolio to 18.8, 6.7, and 10.8 percent using the newest prices. On the other hand, the allocation of U.S. Equity grew from 58.3 percent to 63.7 percent. This is not surprising considering the rapid recent rise in U.S. stocks, especially the tech stocks in this portfolio. The Type 1 categories show that a large protion of this growth was in Technology stocks which grew from 13.1 to 18.7 percent. Beneath the allocation numbers are listed the allocation numbers for the 4 accounts. Not surprisingly, the allocation to the 'Tech' account grew from 28.9 to 37.8 percent.
Under the header 'DIFFERENCES' are simply the changes in the total asset value and percentages of each asset category.
Selecting the Summary tab results in the following screen:
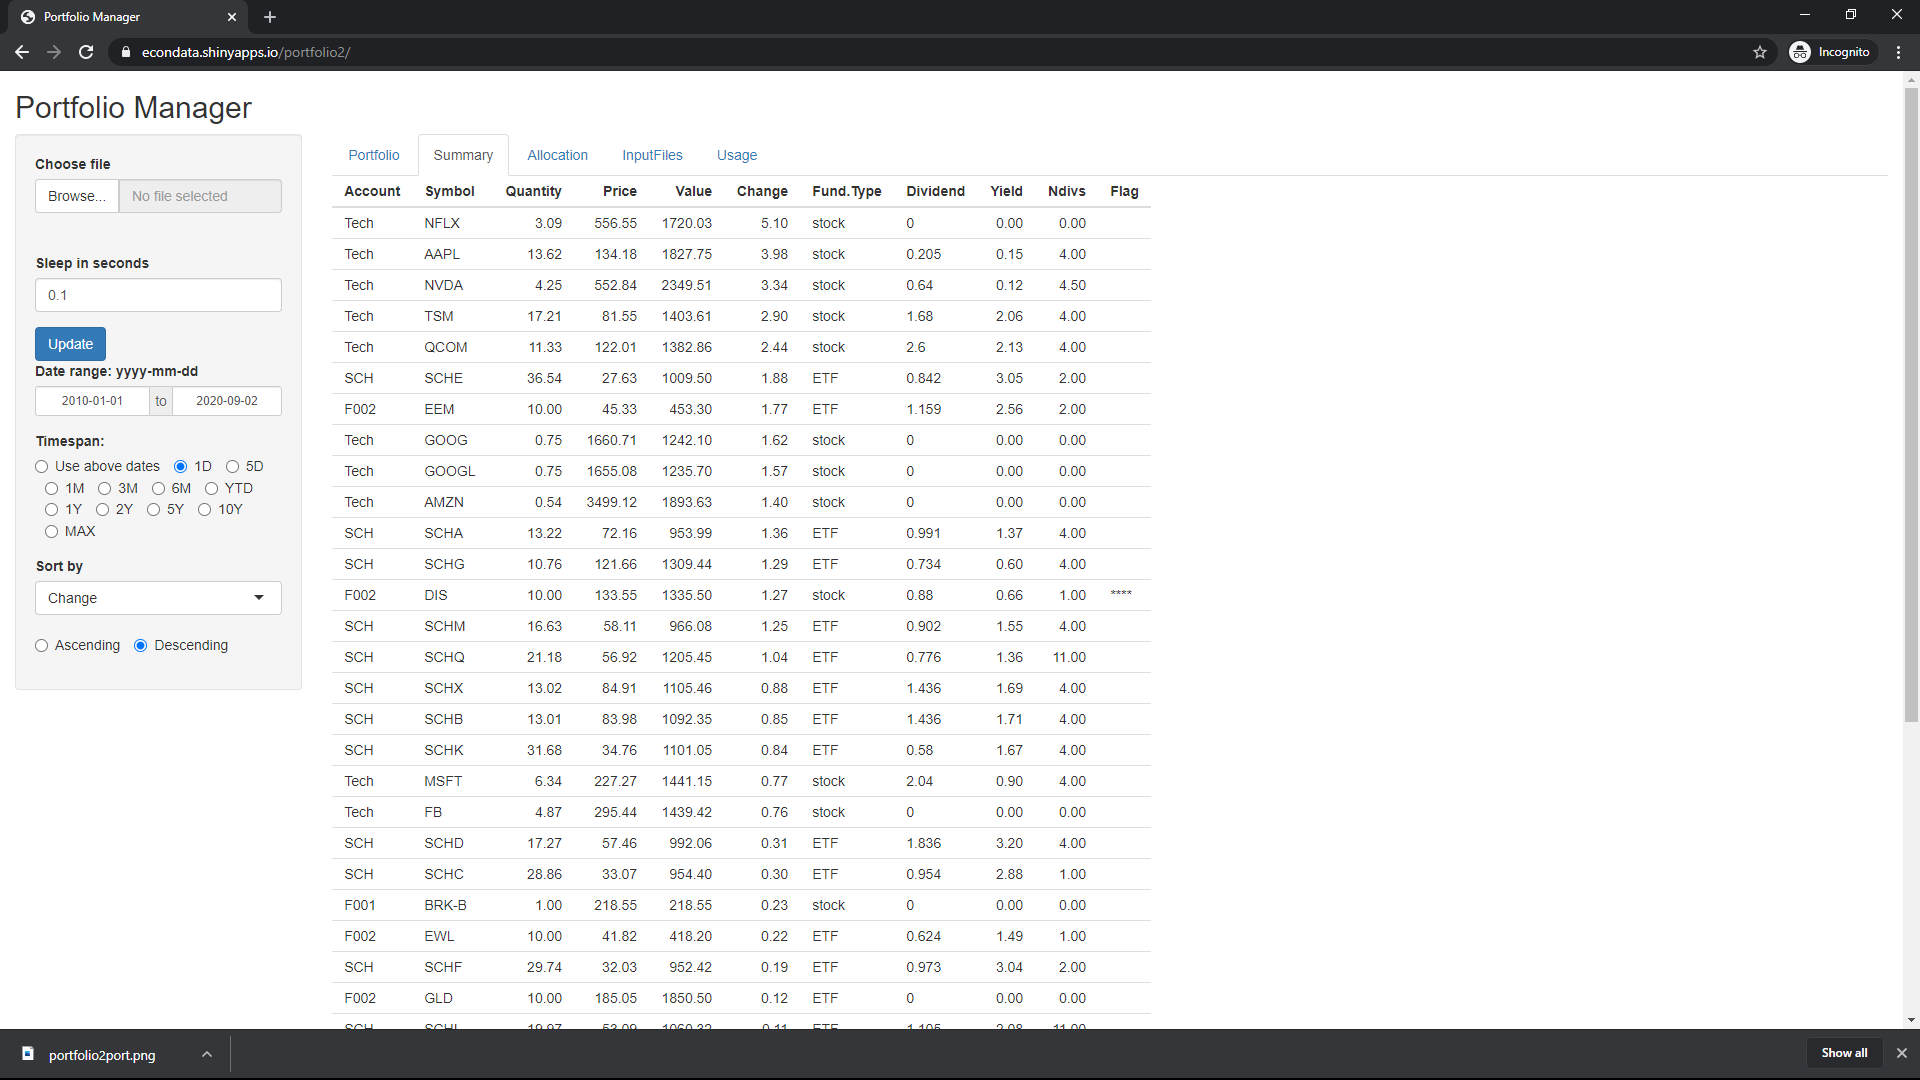
This page currently has the same first 7 columns in the Portfolio tab, followed by Dividend, Yield, Ndivs, and Flag. The following table lists all of the columns listed on the Summary tab:
Column     Description
---------  -----------
Account    The account name as specified by the AcctLabel in the main Portfolio file, followed by the last AcctN characters of the column specified by AcctName, if given.
Symbol     The symbol of the asset.  Unrecognized symbols are assumed to be cash or cash-equivalent.
Quantity   The number of shares except for cash positions for which it is equal to the cash value.
Price      The price of the asset accept for cash position for which it is equal to 1.
Value      The current value of the asset.
Change     The percent change since the time specified by the Timespan selector.
Fund.Type  The type of fund.  This can be stock, ETF, fund, or cash.
Dividend   Estimate of the total dividends paid over the past year.  For stocks, the last quarterly dividend is multiplied by 4 to try to duplicate the forward dividend shown on the Yahoo Summary tab.
Yield      Estimate of the current yield equal to the total dividends paid over the past year divided by the current price.
Hdivs      Estimate of the number of dividend payments over the past year. Fractions like 4.50 shown for NVDA indicates that 5 dividend payments were found over the last year plus 15 days but only 4 appear to belong to this year.
Flag       **** indicates a stock with 1 to 4 dividends payments over the past year. This may indicate a suspended dividend as is the case for DIS (Disney).
Currently, the updated asset values do not include dividends, splits, or interest. One or more of these may be added in the future to make the new portfolio value more accurate. Also, additional information may be added to this and other tabs.
The file selector on the left panel can be used to select the primary portfolio file on the local machine. When this application is running on the local machine, the primary file can reference secondary files on the same local machine. Unfortunately, this is not the case with the current web version hosted at shinyapps.io. In this case, the secondary files are assumed to exist on the server. The primary portfolio file can be downloaded from this link and various lines deleted so as to reference a subset of the current secondary files that exist on the server. In the future, some feature may be added so that watch lists at least can be specified in the primary portfolio file or by some other means. Currently, however, the full functionality of this application requires that it be run on the local machine. This may be preferable if the secondary portfolio files contain any sensitive information.