Sector Analysis is defined in Investopedia as follows:
Sector analysis is an assessment of the economic and financial condition and prospects of a given sector of the economy. Sector analysis serves to provide an investor with a judgment about how well companies in the sector are expected to perform. Sector analysis is typically employed by investors who specialize in a particular sector, or who use a top-down or sector rotation approach to investing.
Sectors are used most commonly to refer to Global Industry Classification Standard (GICS) sectors. These are described in Investopedia as follows:
The Global Industry Classification Standard was developed by index providers MSCI and Standard and Poor's. Its hierarchy begins with 11 sectors which can be further delineated to 24 industry groups, 68 industries, and 157 sub-industries. It follows a coding system which assigns a code from each grouping to every company publicly traded in the market. The GICS coding system is integrated throughout the industry allowing for detailed reporting and stock screening through financial technology.
As listed on this Fidelity webpage, the 11 broad GICS sectors include Communication Services, Consumer Discretionary, Consumer Staples, Energy, Financials, Health Care, Industrials, Information Technology, Materials, Real Estate, and Utilities. That page also points to a document titled The Business Cycle Approach to Equity Sector Investing which discusses an approach to investing in these 11 sectors.
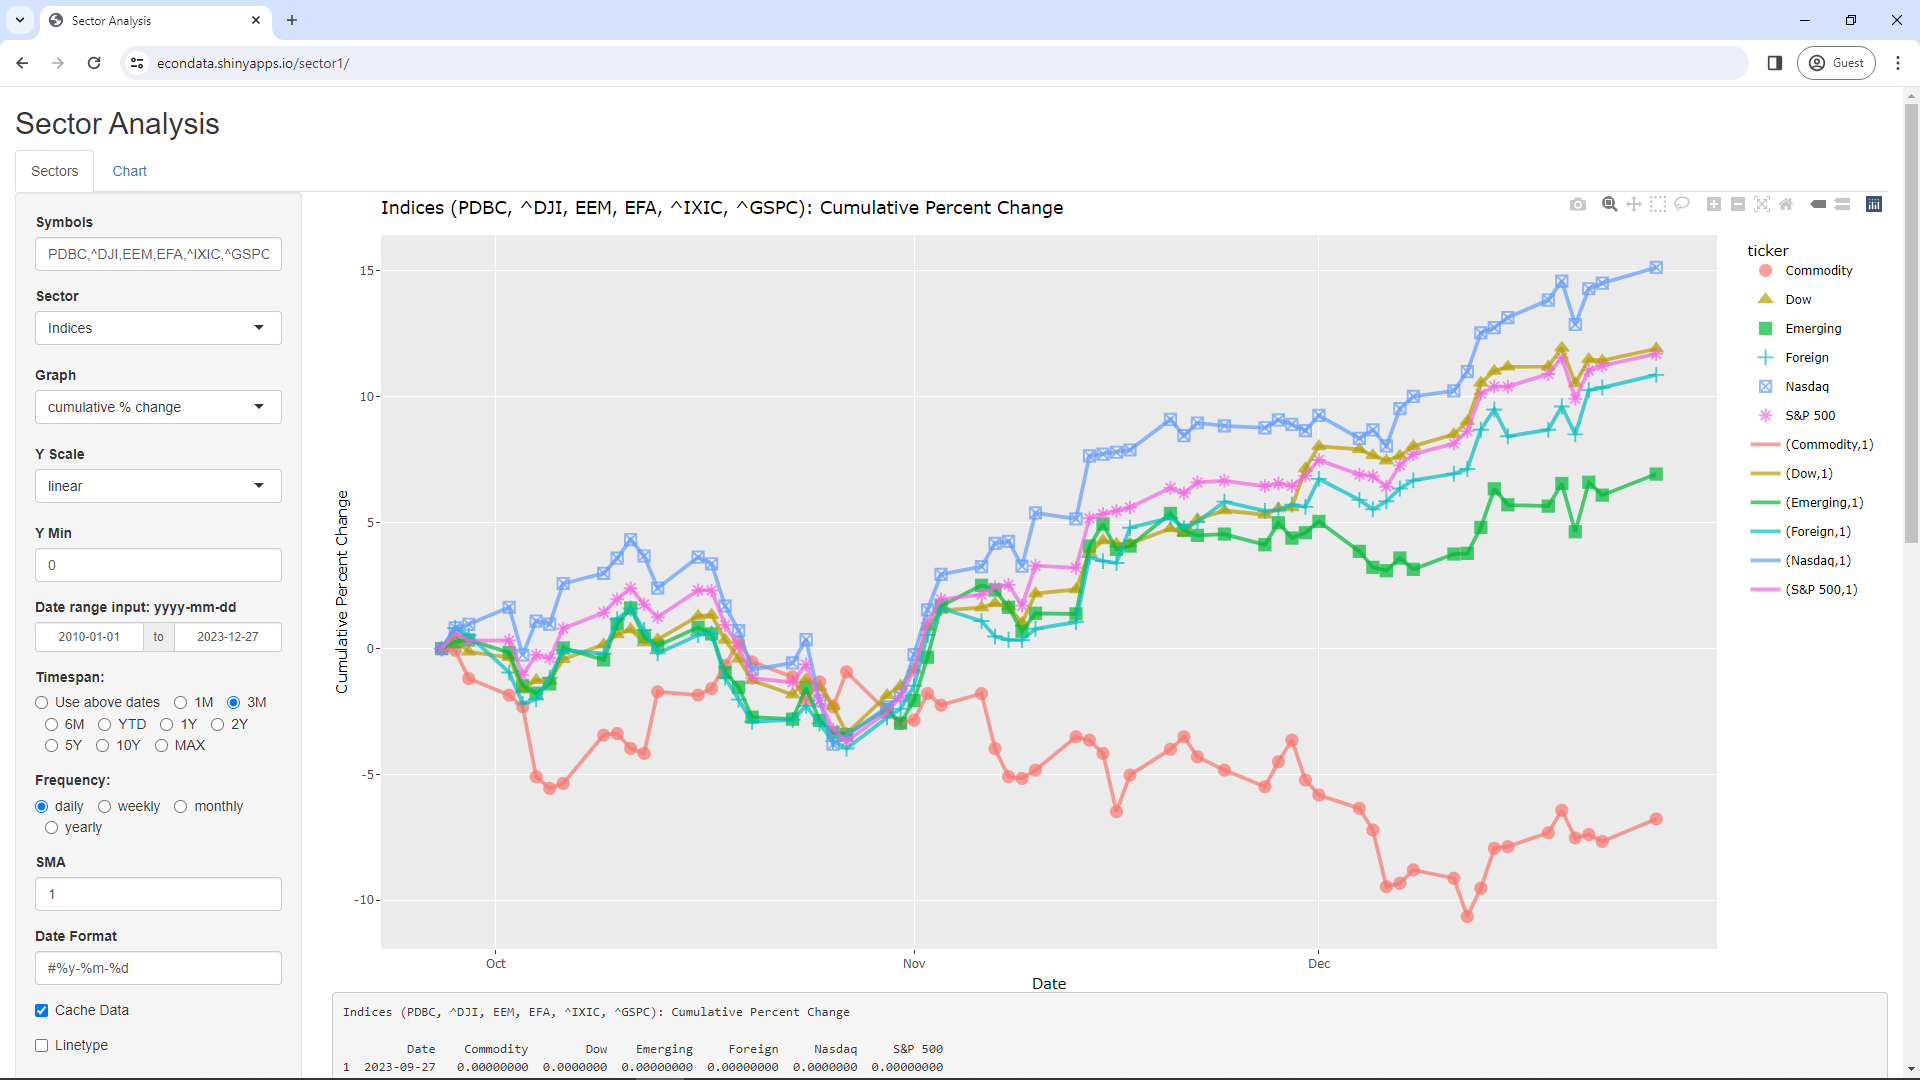
The R Shiny application at https://econdata.shinyapps.io/sector1/ contains various graphs for looking at sector performance. Since the sectors are defined using ticker symbols, it's possible for these graphs to be used to look at any financial instruments that have tickers including indices, stocks, funds, and ETFs. This Fidelity webpage lists various market indices along with the 11 GICS sectors. In any event, following is the application's initial page:
This initial page displays the cumulative percent change over 3 months in the Dow, Nasdaq, and S&P 500 indices and 3 ETFs (PDBC, EEM, and EFA) that estimate commodity, emerging markets, and foreign equity indices. The time span can be changed from 3 months to everything from the year 2020 on via the following steps:
Changing Sector from Index to "Bond ETFs" will display the following:
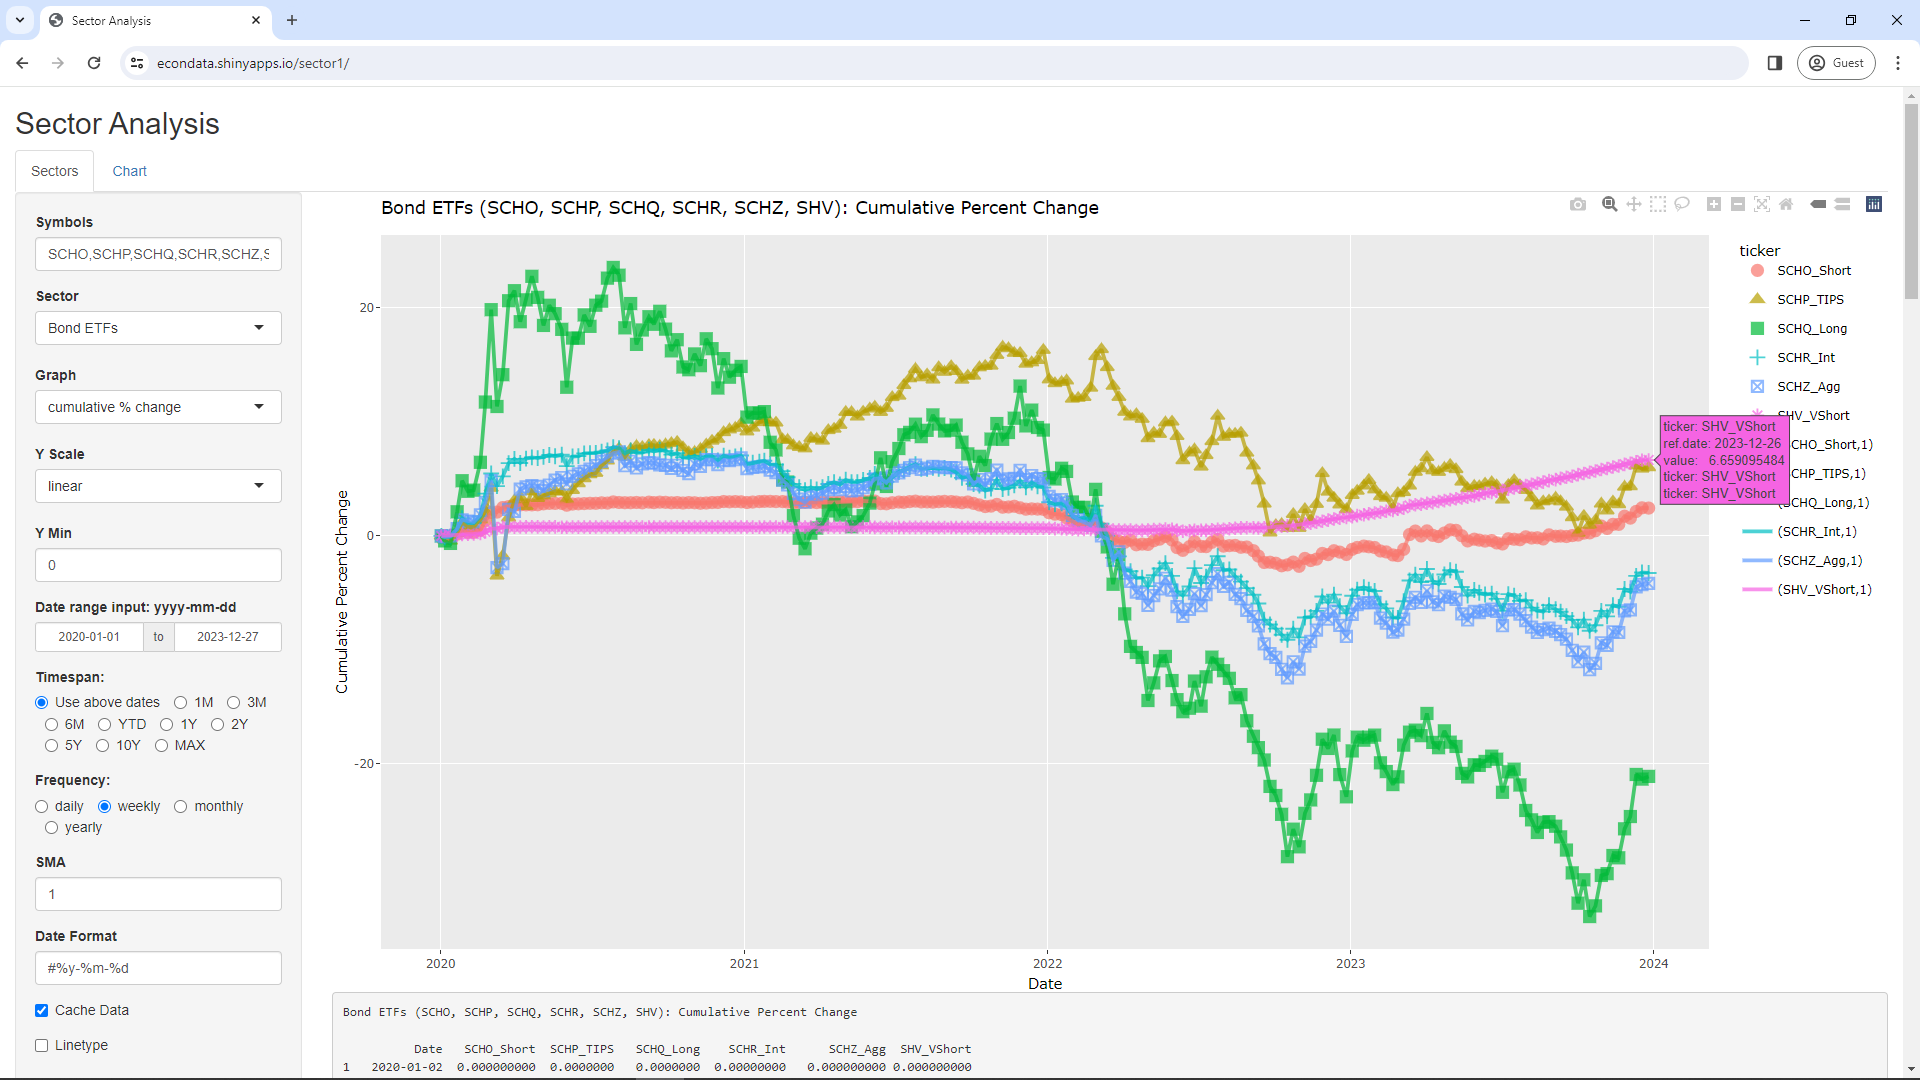
As can be seen, nearly all of the Bond ETFs fell from the end of 2021 through the end of 2022. The one exception was SHV which, according to this link, had an ultrashort duration of about 0.27 years. This January 7, 2023 article starts with the following key points:
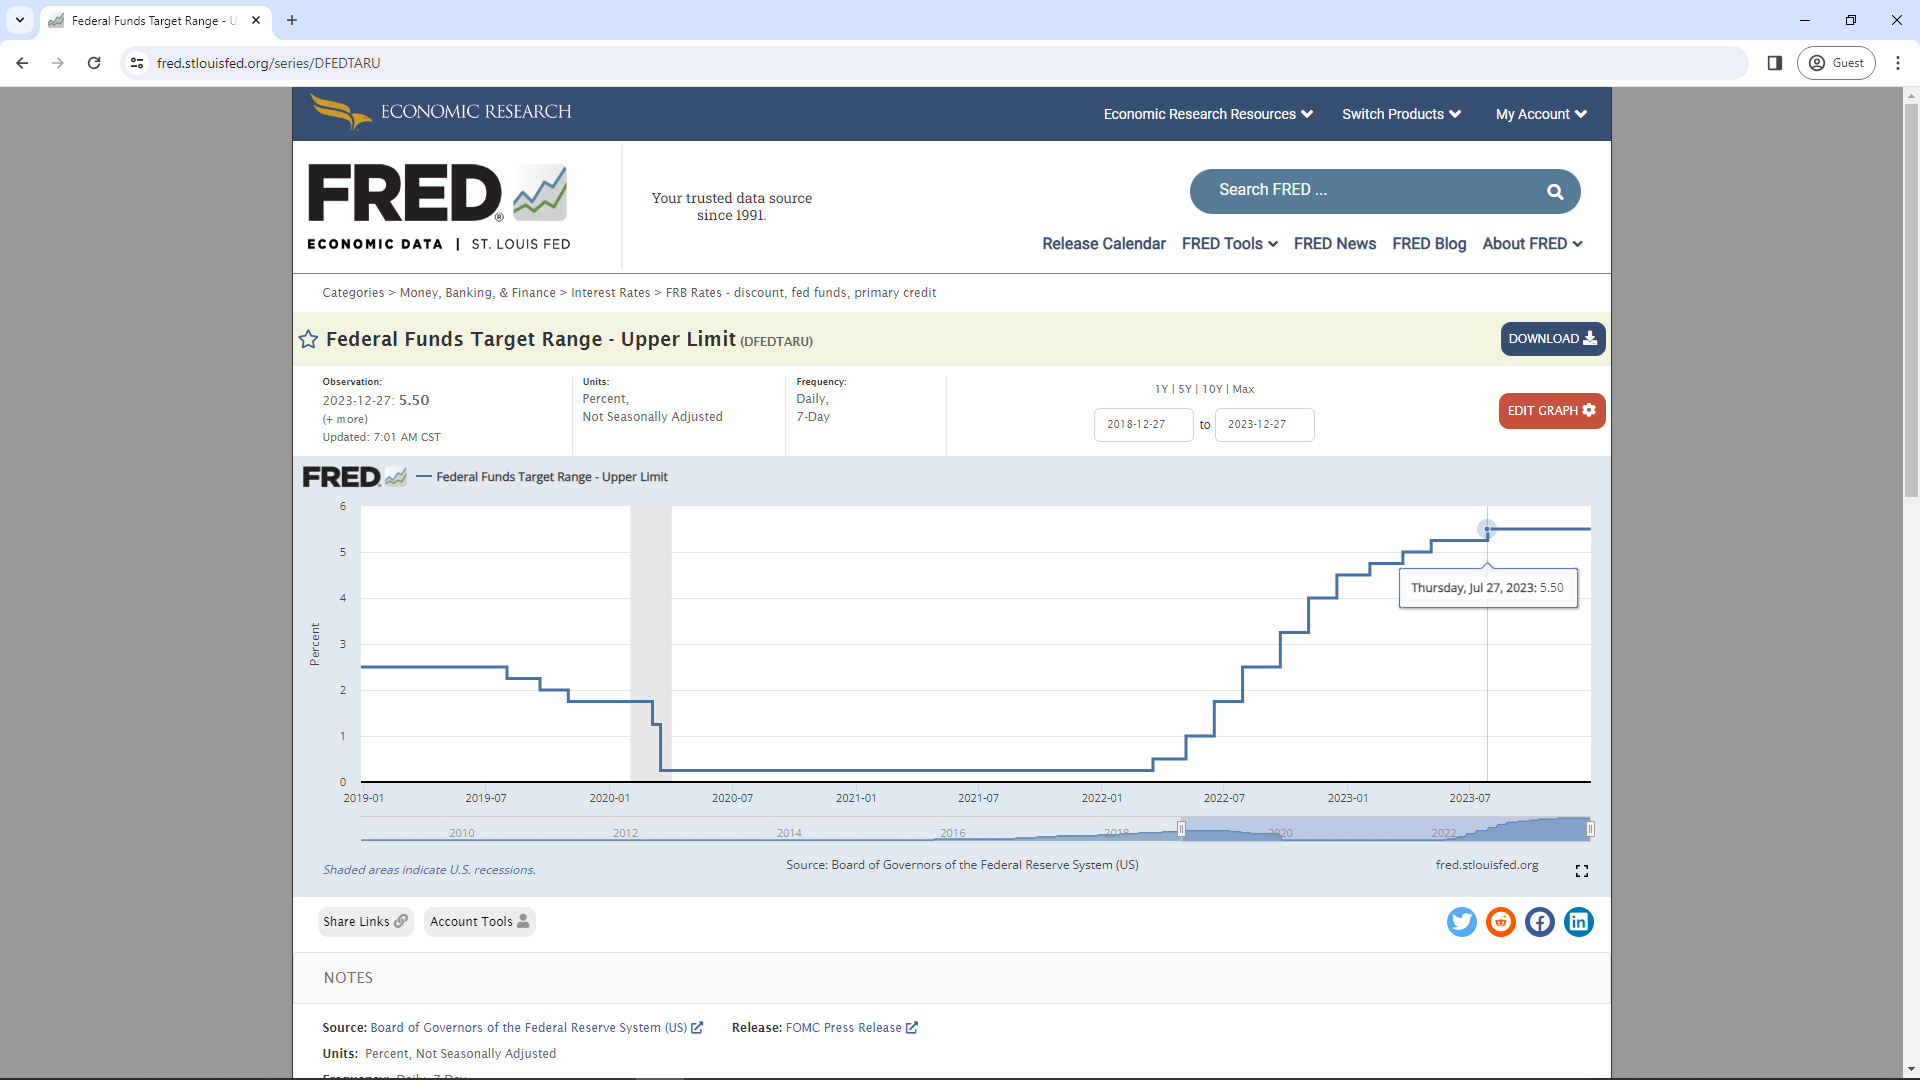
Regarding 2023, the article did go on to state:
The Federal Reserve is poised to continue raising interest rates, but the increase is unlikely to be as dramatic or rapid — in which case the impact on bonds would be more muted, advisors said.
As the bond ETFs graph shows, the value of long-term bonds did drop futher in 2023 but the drop was more muted as the article suggested. Since about October 19, 2023, the value of bonds have been rising.
The sector graphs look at the adjusted prices which should adjust them for any dividends or splits. Still, it's possible to verify the graphs by looking at the results on Morningstar via the following steps:
This should display the following graph:
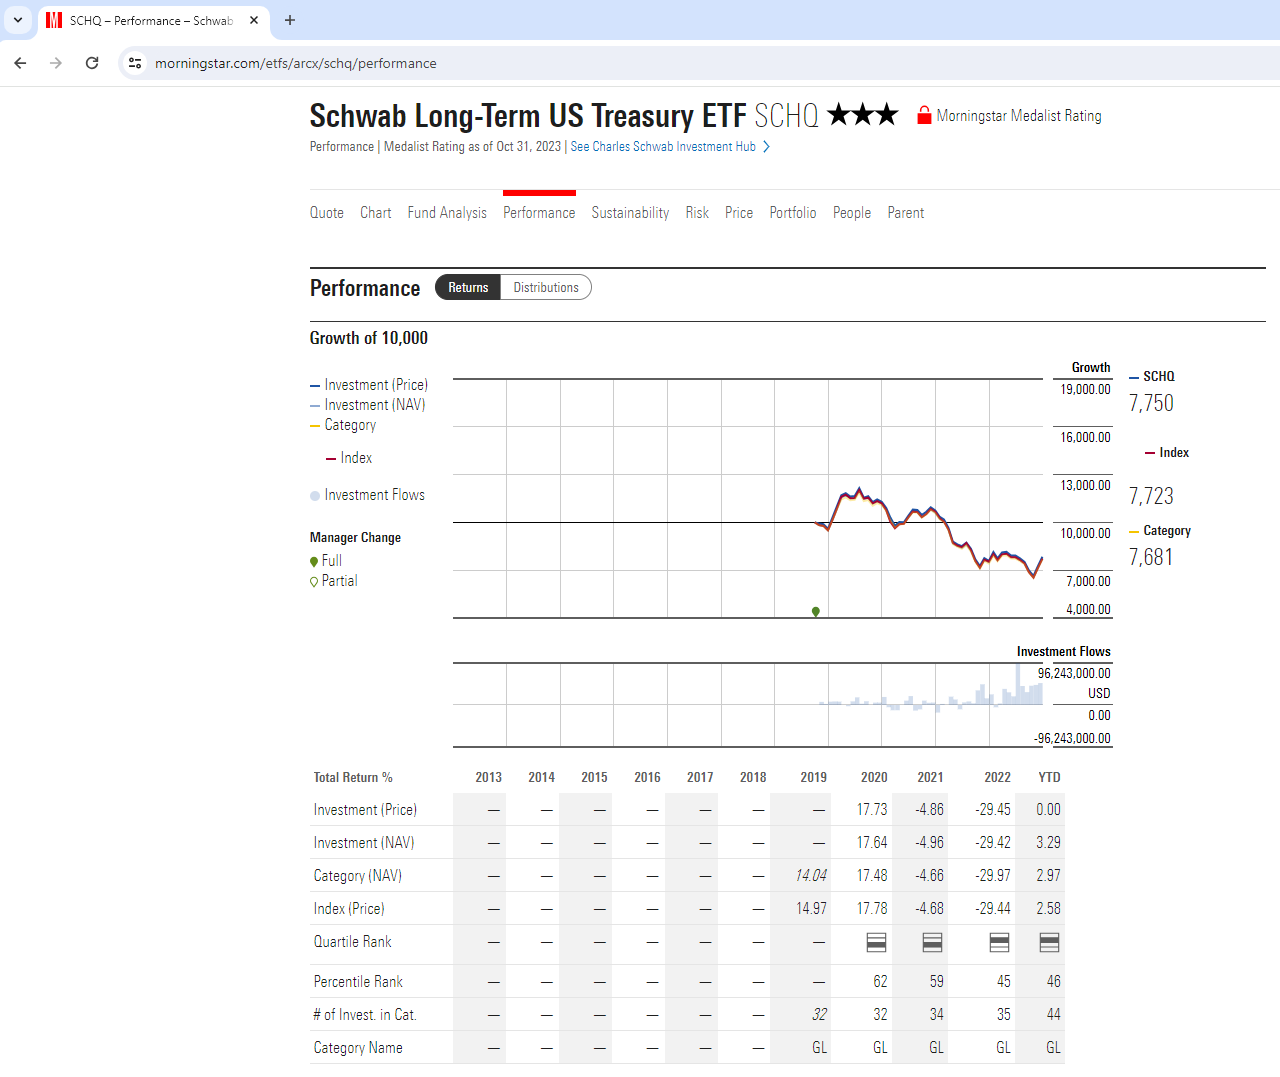
As can be seen, the above graph is similar to the green line for SCHQ in the Bond ETFs graph above.
Changing Sector to "Equity ETFs" will display the following:
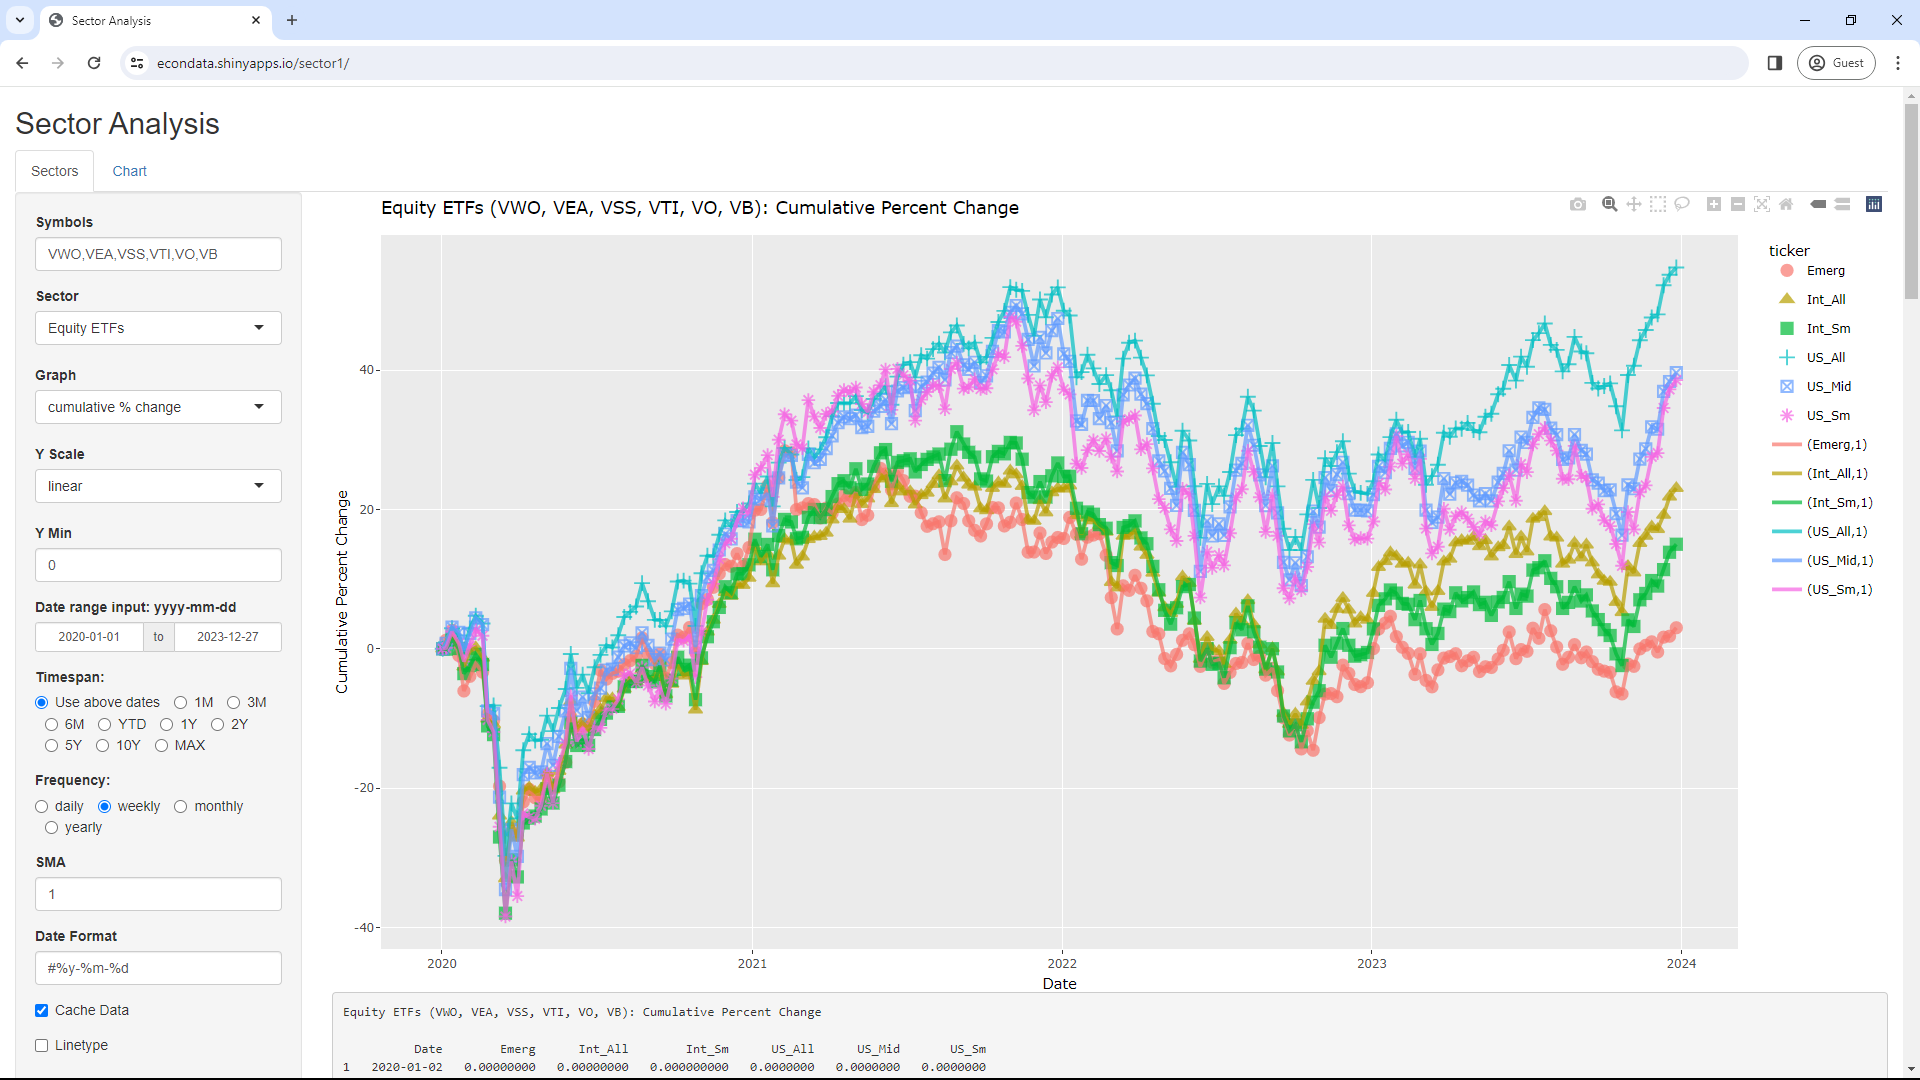
This graph shows the cumulative percent change for 6 equity ETFs since 2020. The 3 U.S. equity ETFs (VTI, VO, and VB) represent all, midcap, and small U.S. stocks and the 3 international equity ETFs (VWO, VEA, and VSS) represent Emerging Markets and all and small international stocks. As can be seen, the U.S. ETFs appear to have outperformed the international ETFs since early 2020.
Changing Sector to "Sectors1" will display the following:
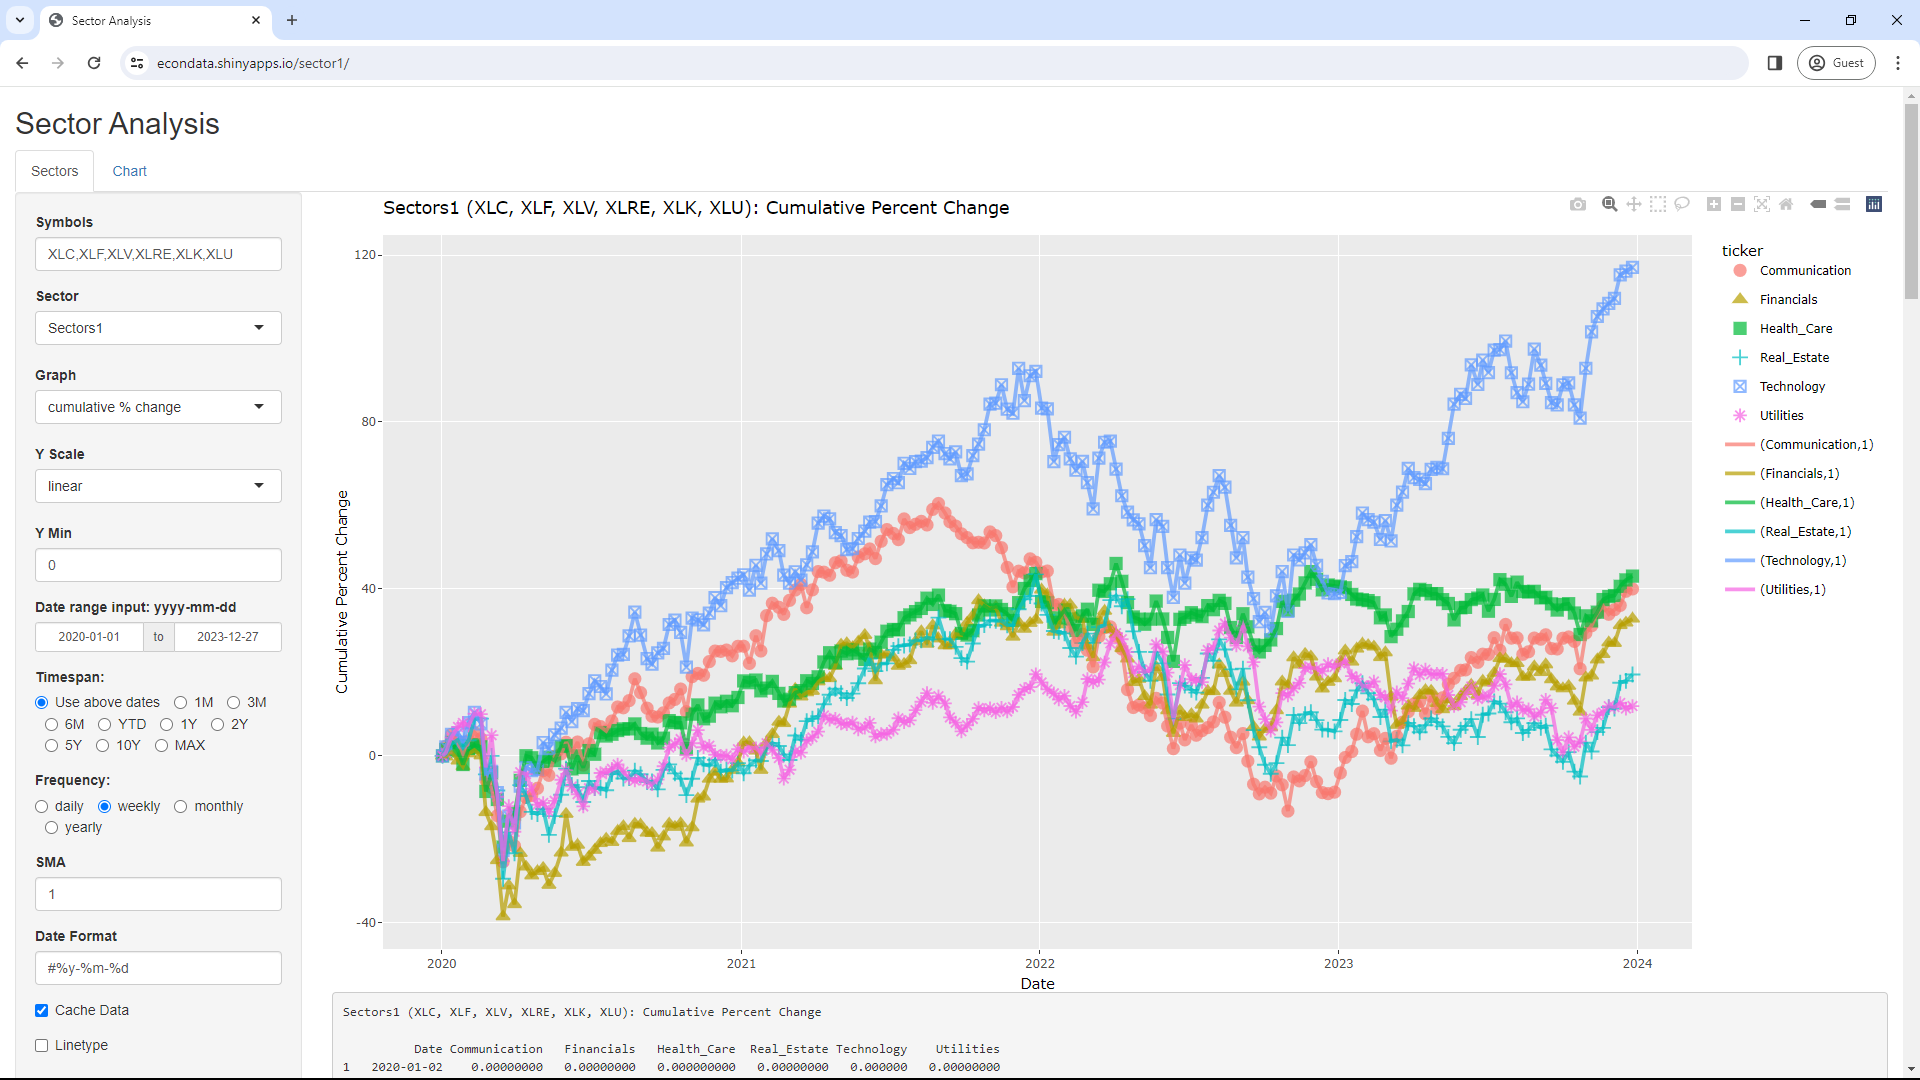
This graph shows the cumulative percent change for the first 6 of the 11 sectors. Those are Communications, Financials, Health_Care, Real_Estate, Technology, and Utilities. As can be seen, all are above the level at which they began 2020 but Technology appears to have greatly outperformed the other 5 sectors since equity ETFs since 2020. The 3 U.S. equity ETFs (VTI, VO, and VB) represent all, midcap, and small U.S. stocks and the 3 international equity ETFs (VWO, VEA, and VSS) represent Emerging Markets and all and small international stocks. As can be seen, the U.S. ETFs appear to have outperformed the international ETFs in 2023.
Changing Sector to "Sectors2" will display the following:
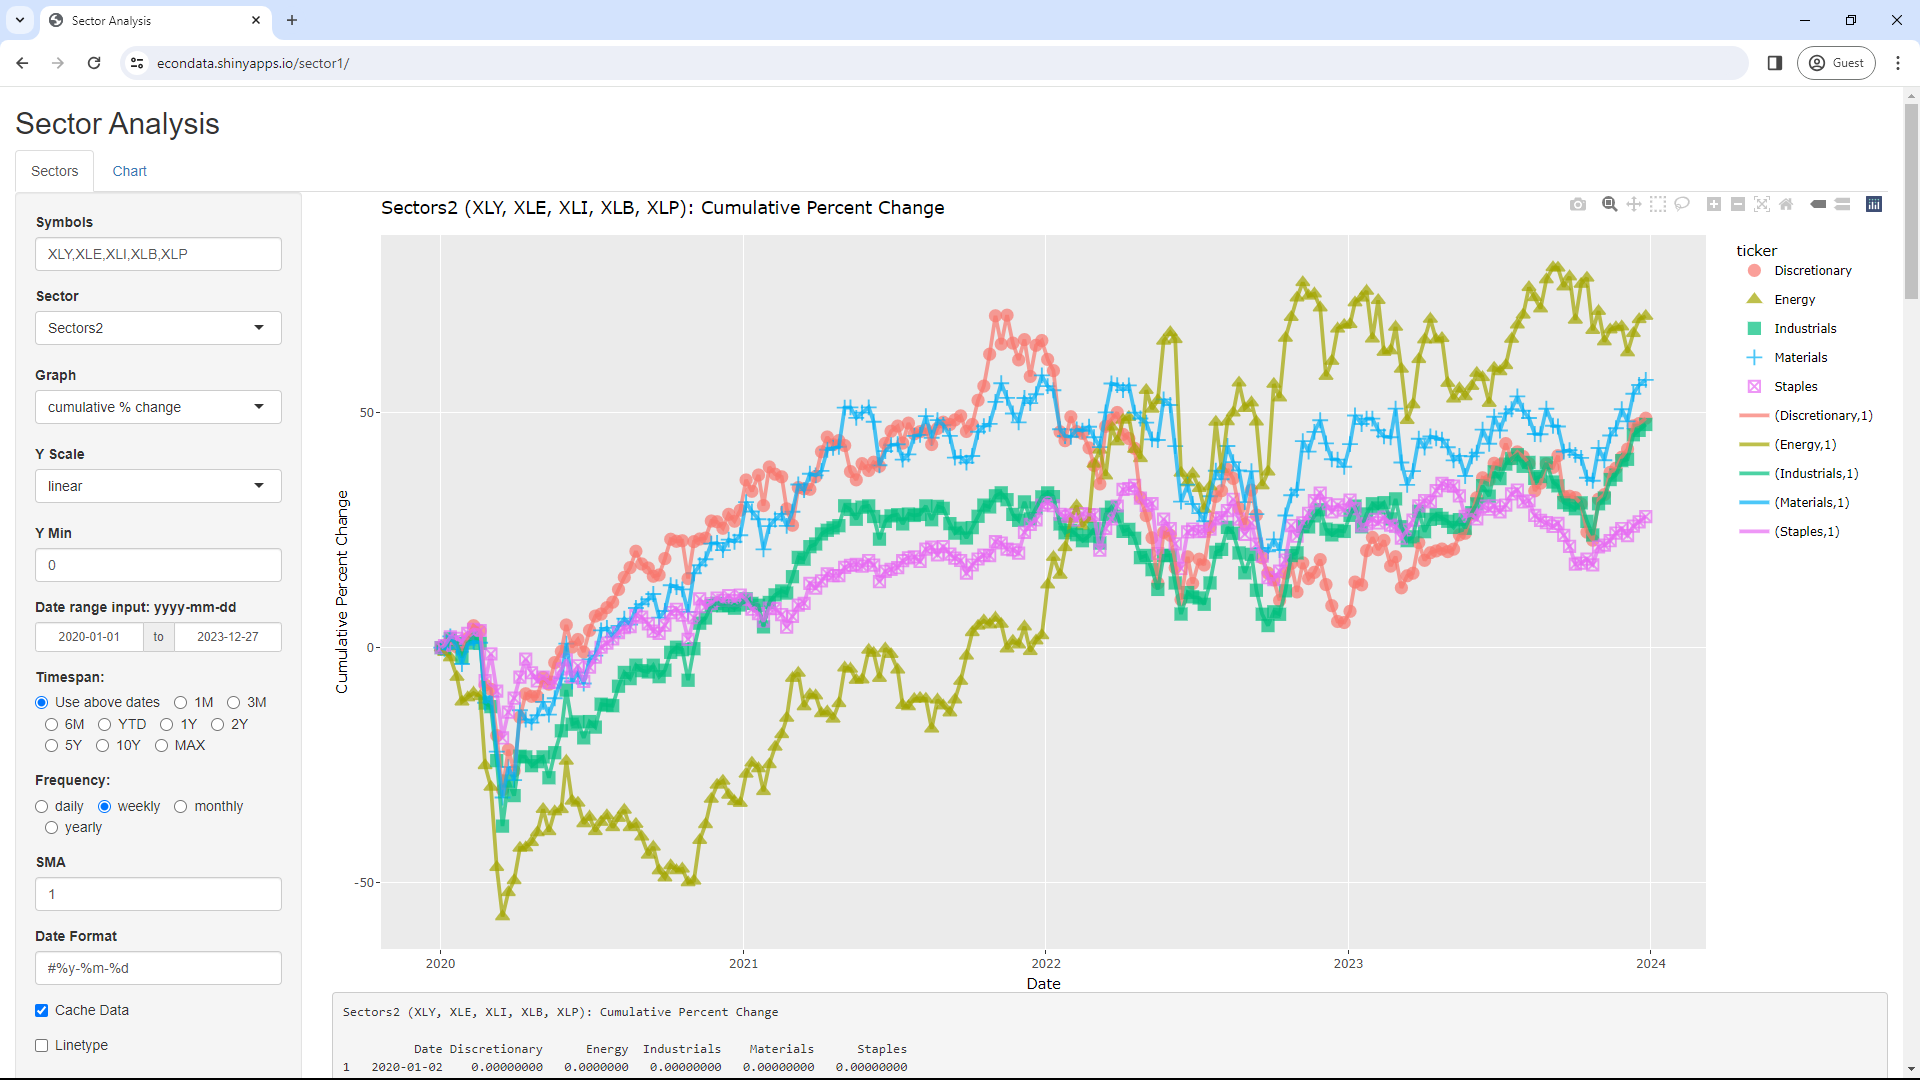
This graph shows the cumulative percent change for the other 5 of the 11 sectors. Those are Discretionary, Energy, Industrials, Materials, and Staples. As can be seen, all are above the level at which they began 2020. However, Energy performed much more poorly until 2022 when it took off and became the best overall performer of those 5 sectors through 2023.
Finally, changing Sector to "Tech1 (FANG)" will display the following:
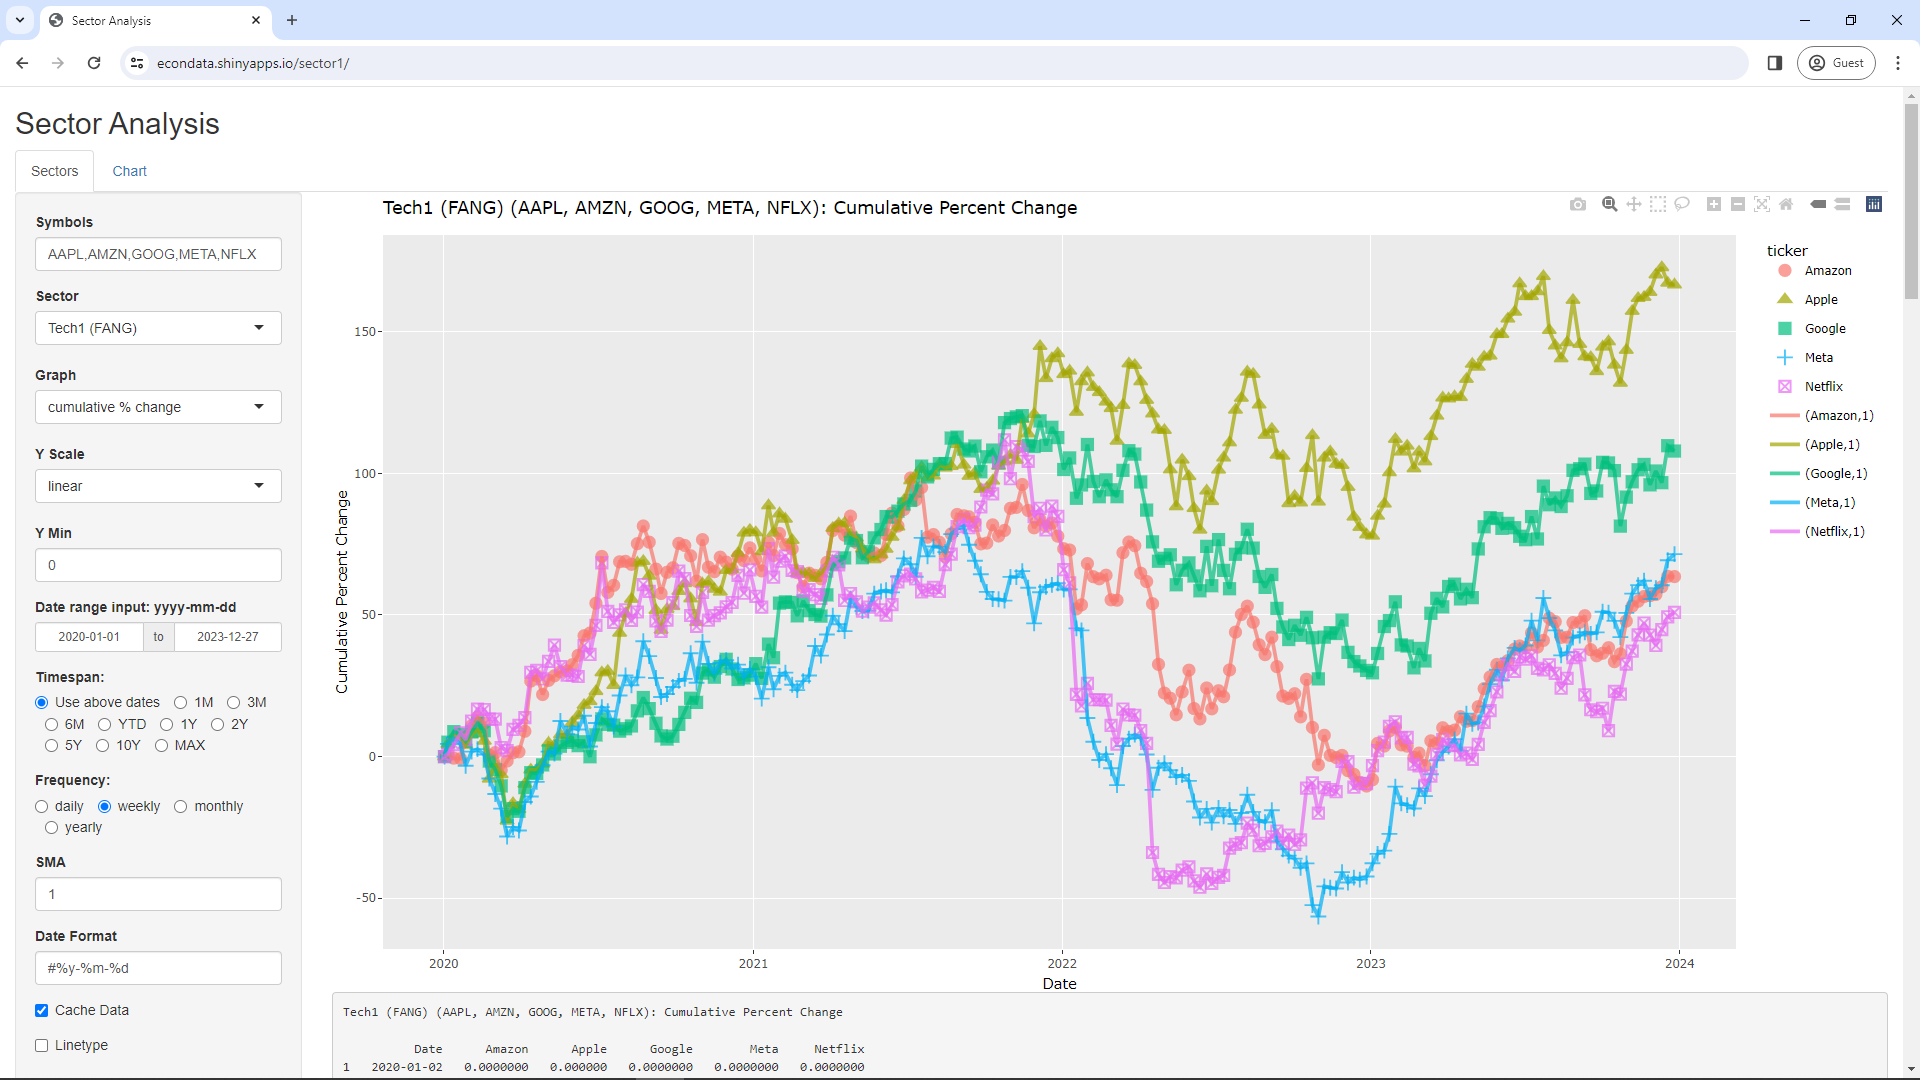
This graph shows the cumulative percent change for the original 5 FAANG stocks of Facebook (now Meta Platforms), Amazon, Apple, Netflix, and Google (now Alphabet). As can be seen, Apple has performed the best since 2020, gaining over 150 percent. Google is next at over 100 percent, followed by Facebook, Amazon, and Netflix, all 3 with over 50 percent gains.
This application is under continuing development. If anyone should run into any issues or have any suggestions for additional features, feel free to let me know via the Contact box at the bottom of this page.