SMARTelections Press Release Regarding Drop-off Factor in 2024 Election Results
North Carolina - Percent Dropoff in Votes from President to NC Attorney General in 2024
SMARTelections Press Release Regarding Drop-off Factor in 2024 Election Results
On December 17, 2024, SMARTelections.us put out a release titled Drop-off factor in Election Data Raises Questions About 2024 Election Results. Following is the first paragraph from that release:
As electors in each state are voting for President and Vice President today, SMART Elections, a nonpartisan organization focused on security and public oversight of U.S. elections, is releasing a comprehensive analysis of the 2024 Presidential election phenomenon commonly referred to as "drop-off". The detailed study includes six swing and eleven non-swing states and confirms what has been widely discussed on social media, Substacks, Reddit forums and among political advocates on both the left and right: in six of the seven swing states, and in all but four of the non-swing states they examined, there are considerably more votes for the Republican presidential candidate than for the next down-ballot race. The study calls this pattern "drop-off" and tracks the percentage of the drop-off and the number of votes involved, county by county, in all 17 states. The analysis for each state is available at SMARTelections.us.
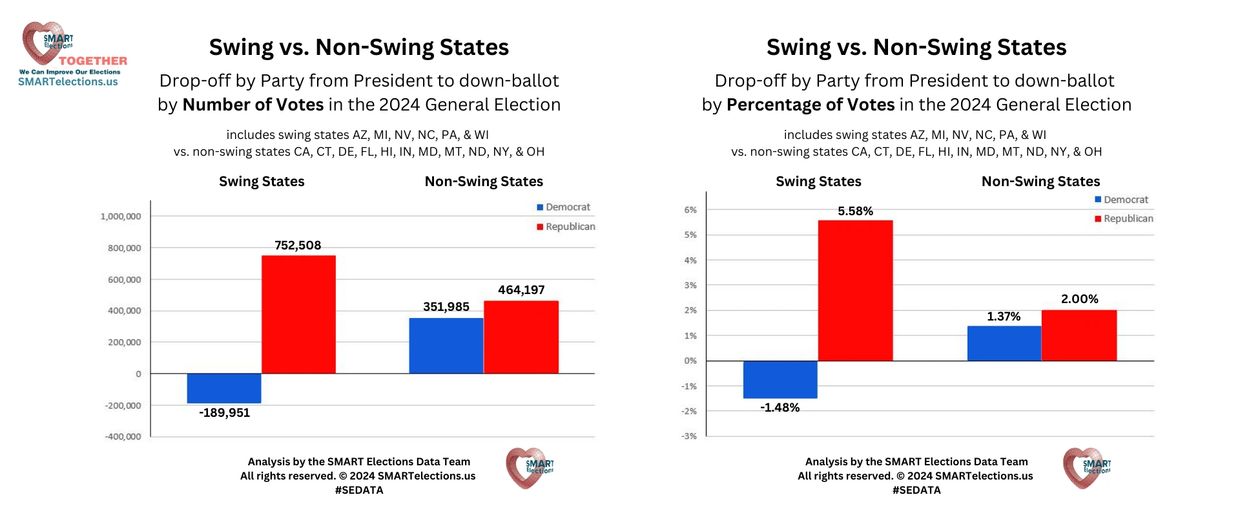
That analysis begins with the following charts:

The analysis includes similar charts for the 6 mentioned swing states and 11 mentioned non-swing states.
In order to further explore this topic, there is an R Shiny app at https://econdata.shinyapps.io/dropoff/ that displays this and related drop-off information. Following is the initial screens:
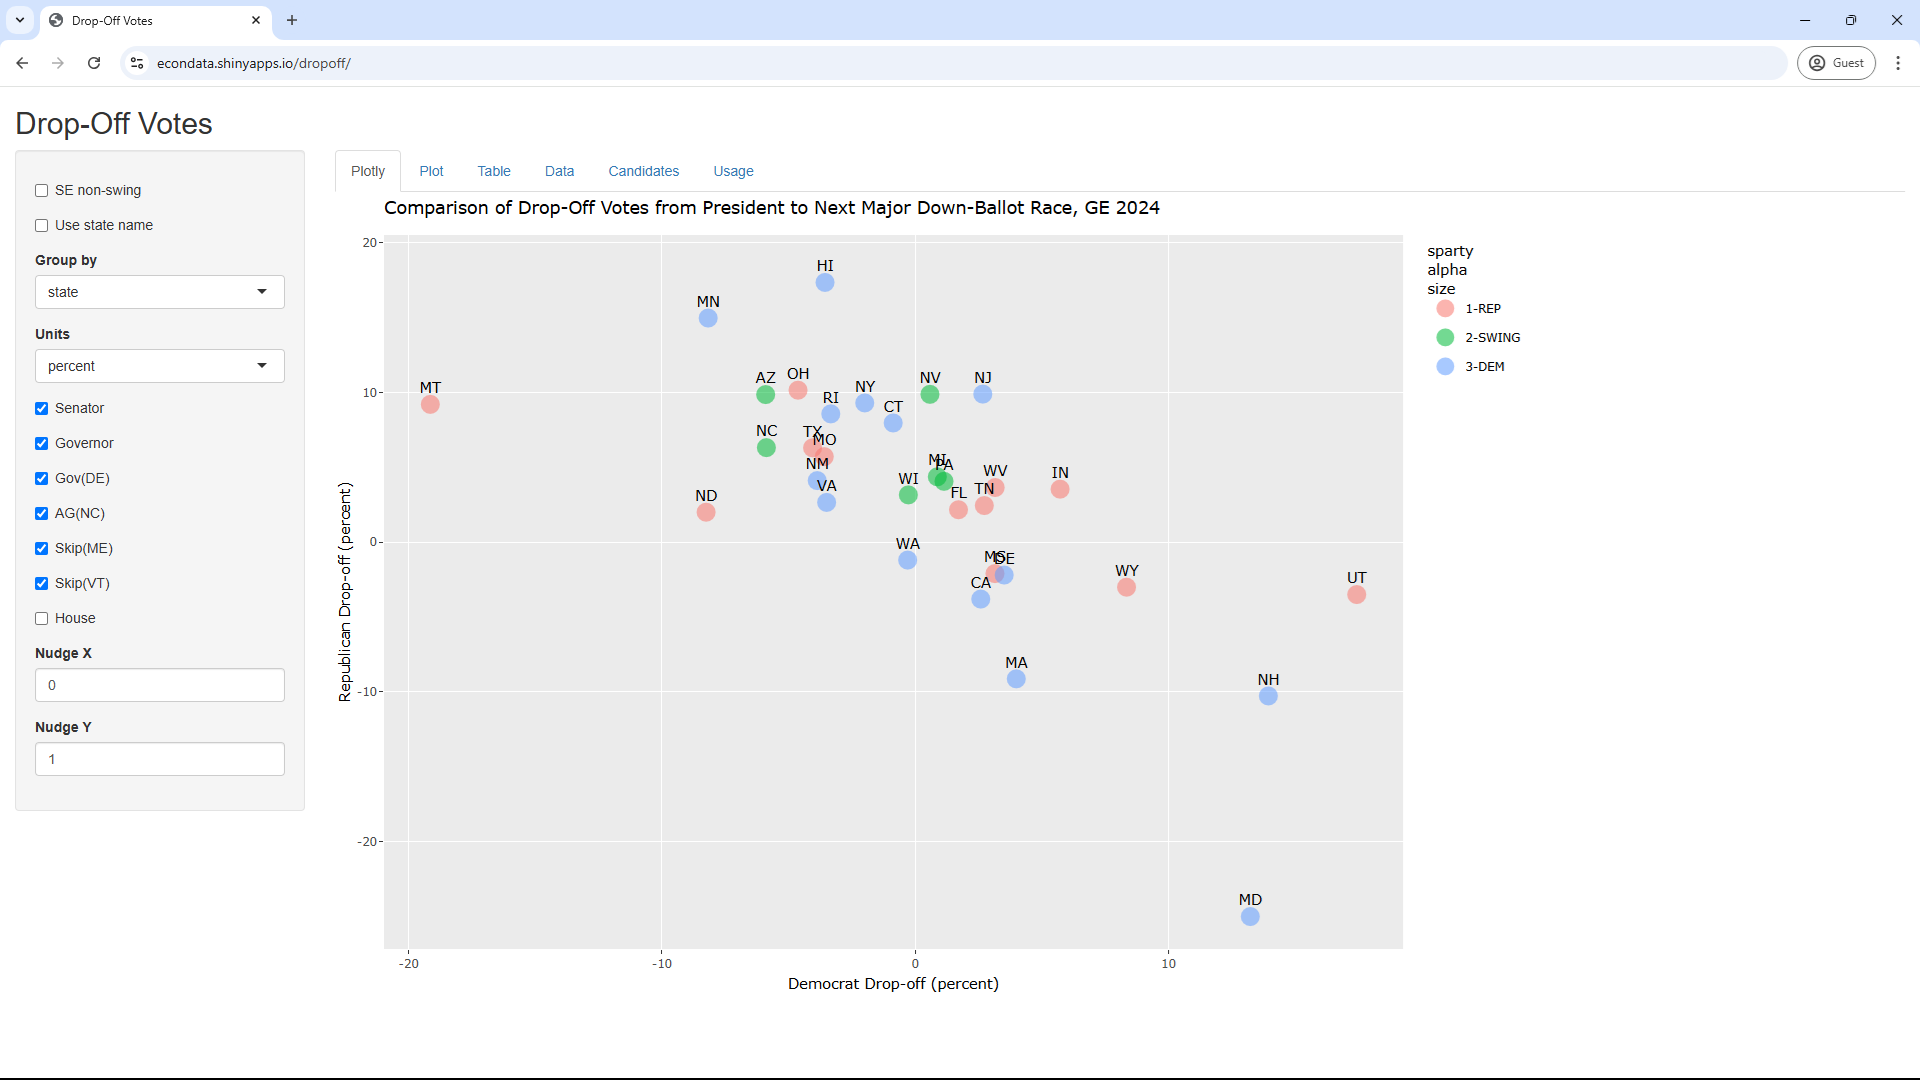
The data used to generate this graph came from this CBS web page and was copied on 12/20/2024, just before 11 AM. That brings up an important topic of obtaining updated election data. I was not able to find any place where I could download even state-level vote counts for the major offices (President, Senate, Governor, and House) as a data file (CSV or Excel). I had to look at several media sites and found that I could most easily parse the data on the CBS web site. Unfortunately, it only contains complete data for the Democrat and Republican candidate and not for "Other" in all states. If we really want transparency in our elections, it would seem that we should at least make this data available in a format that can be easily processed.
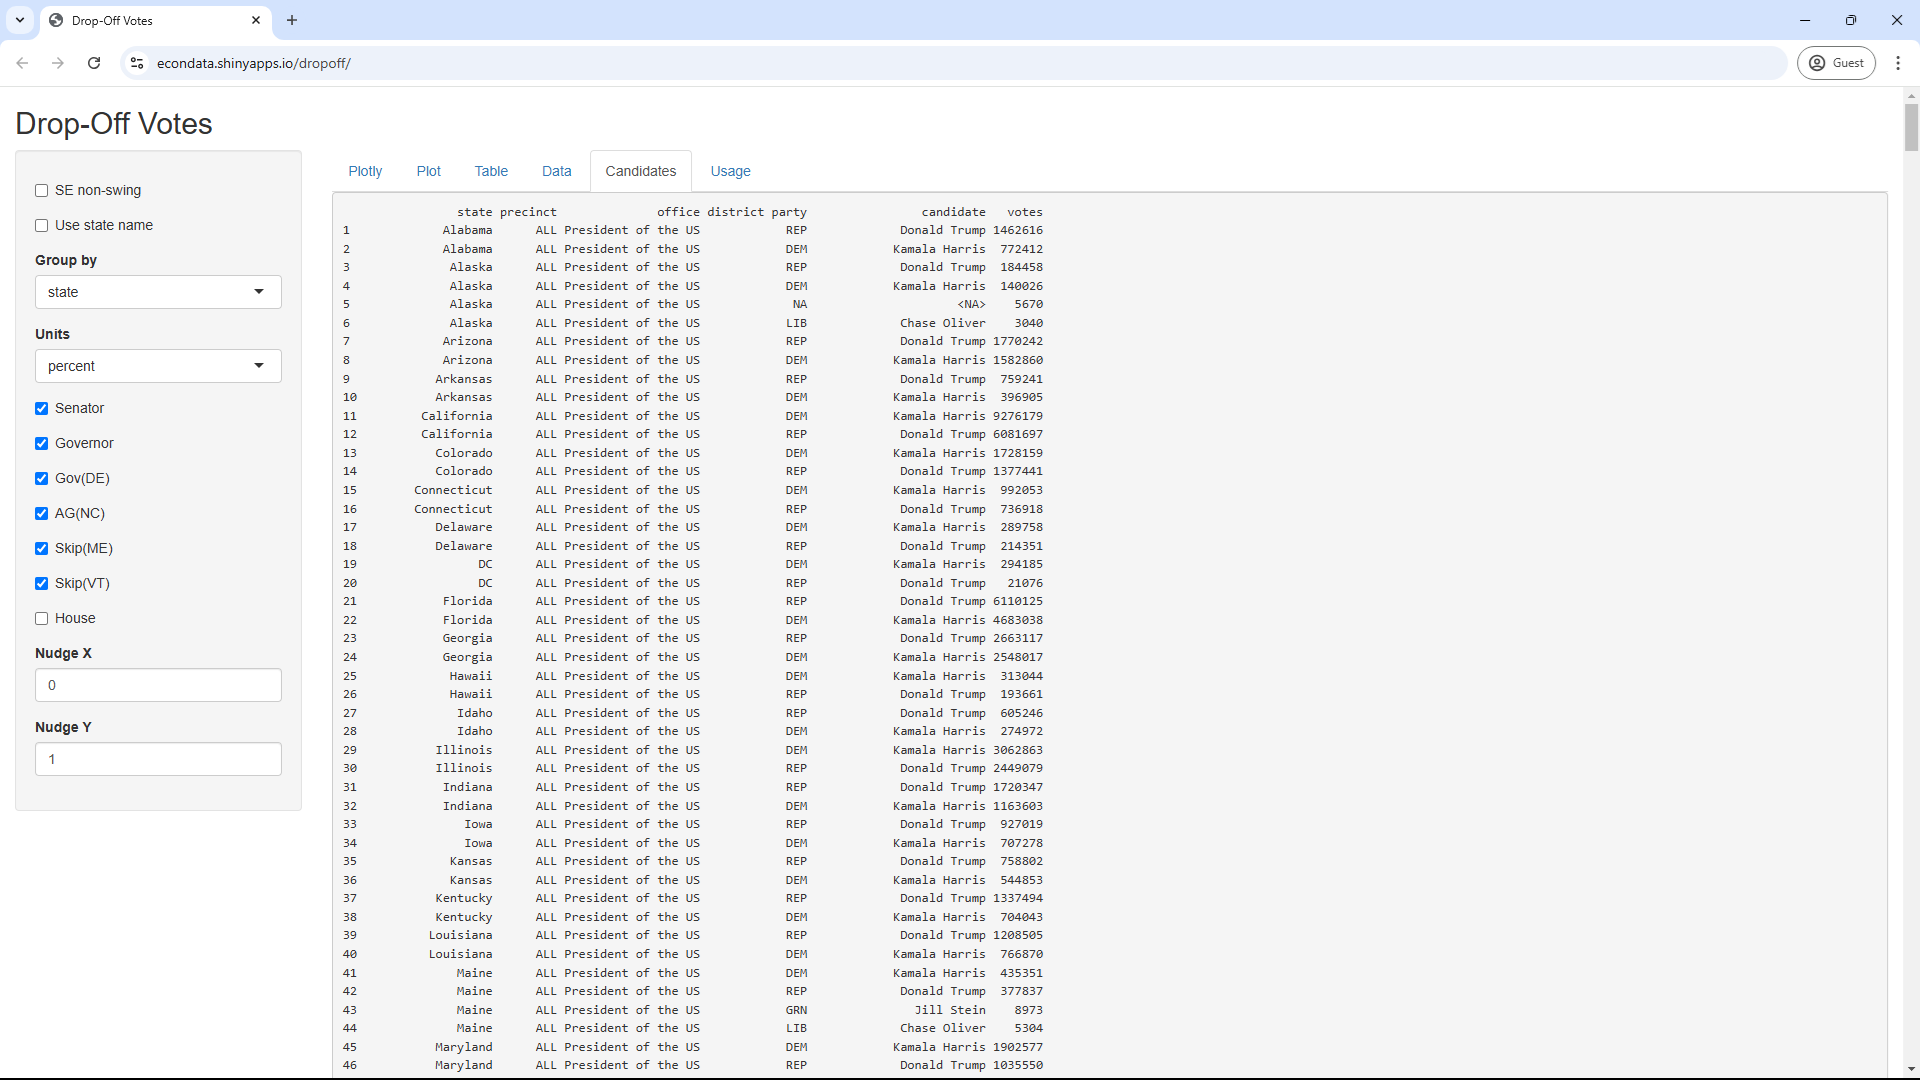
In any case, clicking the Candidates tab will display the candidate vote counts that were obtained from the CBS web page, as seen in the following screen:
Clicking the Data tab will display the data used to calculate the Democrat and Republican drop-off values, as seen on the following screen:
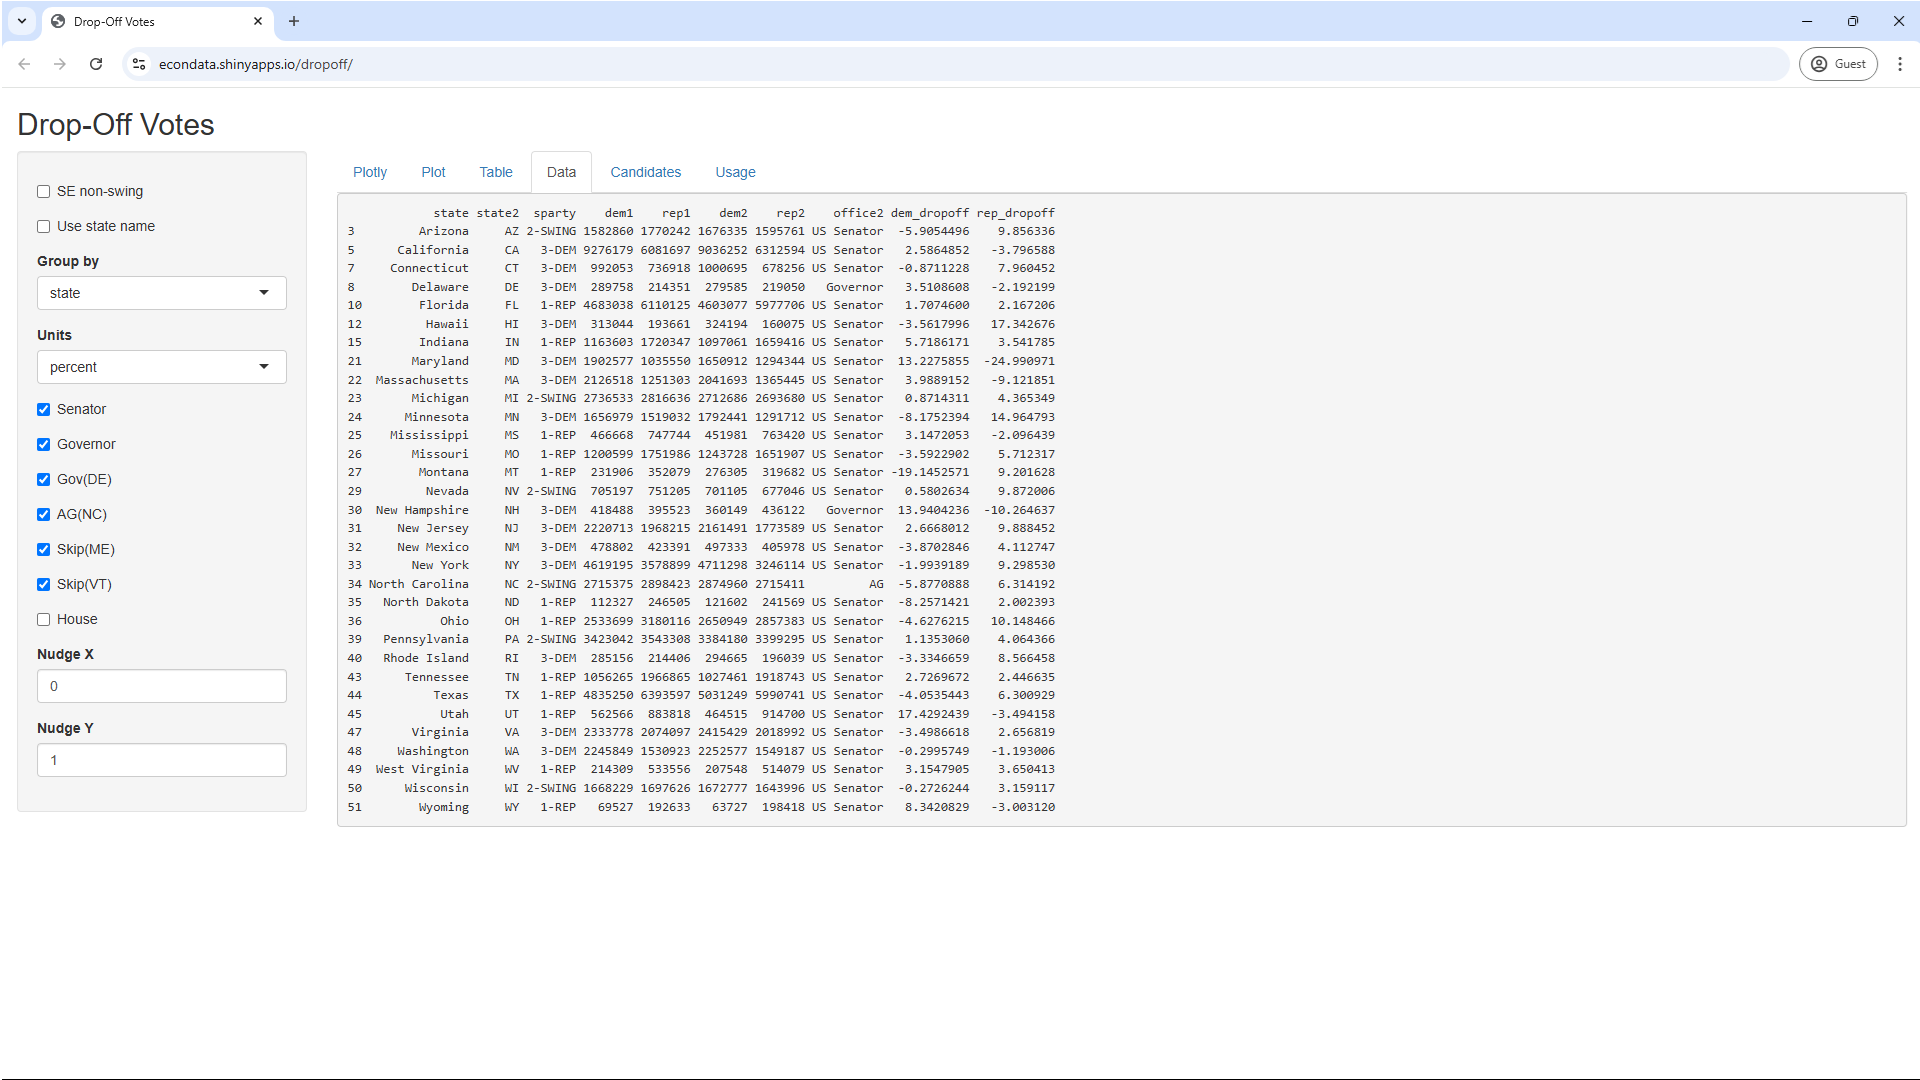
As mentioned in the SMARTelections.us analysis, "drop-off" refers to the difference between the votes for the President and the next down-ballot race. Many of the checkboxes along the left panel above determine how the next down-ballot race is selected. If "Senator" is checked, the next down-ballot race will be the Senate race, if there was one in 2024. If there was not one and "Governor" is checked, the next down-ballot race will be the Governor race, if there was one in 2024. If there was not one and "House" is checked, the next down-ballot race will be the House races and the vote count will be the sum total of all of the House races. If "House" is not checked, those remaining states will not be displayed.
SMARTelections made a few exceptions to this process. For North Carolina, the next-down ballot race is taken to be Attorney General race. This is likely due to the fact that the normal down-ballot race would have been the Governor since North Carolina had a Governor, but not a Senate, race. However, the Republican candidate for Governor, Mark Robinson, was reported in a CNN article to have "made a series of inflammatory comments on a pornography website's message board more than a decade ago, in which he referred to himself as a 'black NAZI!' and expressed support for reinstating slavery". This would presumedly have artificially increased the Republican drop-off so SMARTelections chose the Attorney General race instead. In any case, this exception can be reproduced by checking the "Gov(DE)" checkbox.
The other main exception was that SMARTelections chose the Governor race instead of the Senate race as the down-ballot race in Delaware. This is likely because Republican candidate for Senate, Mike Hansen, got just 39.5% of the vote. This was likely due to some combination of Hansen being a first-time candidate and the Independent candidate, Mike Katz, getting 3.9% of the vote. This again would have increased the Republican drop-off. This exception can be reproduced by checking the "AG(NC)" checkbox.
The "Skip(ME)" and "Skip(VT)" checkboxes can be checked to skip the Maine and Vermont races, respectively. This is because both have Senate races that were won by Independents (Angus King in Maine and Bernie Sanders in Vermont) which would increase the Democrat and/or Republican drop-offs in those states. For a similar reason, the "House" checkbox is not checked by default. This is because a number of House races have strong Independent candidates and/or no Democrat or Republican candidate and this can skew the drop-offs in some states.
In any case, checking the "SE non-swing" checbox will limit the non-swing states to those used in the SMARTelections analysis. Doing this and setting the "Units" select list to "count" will display the following screen:
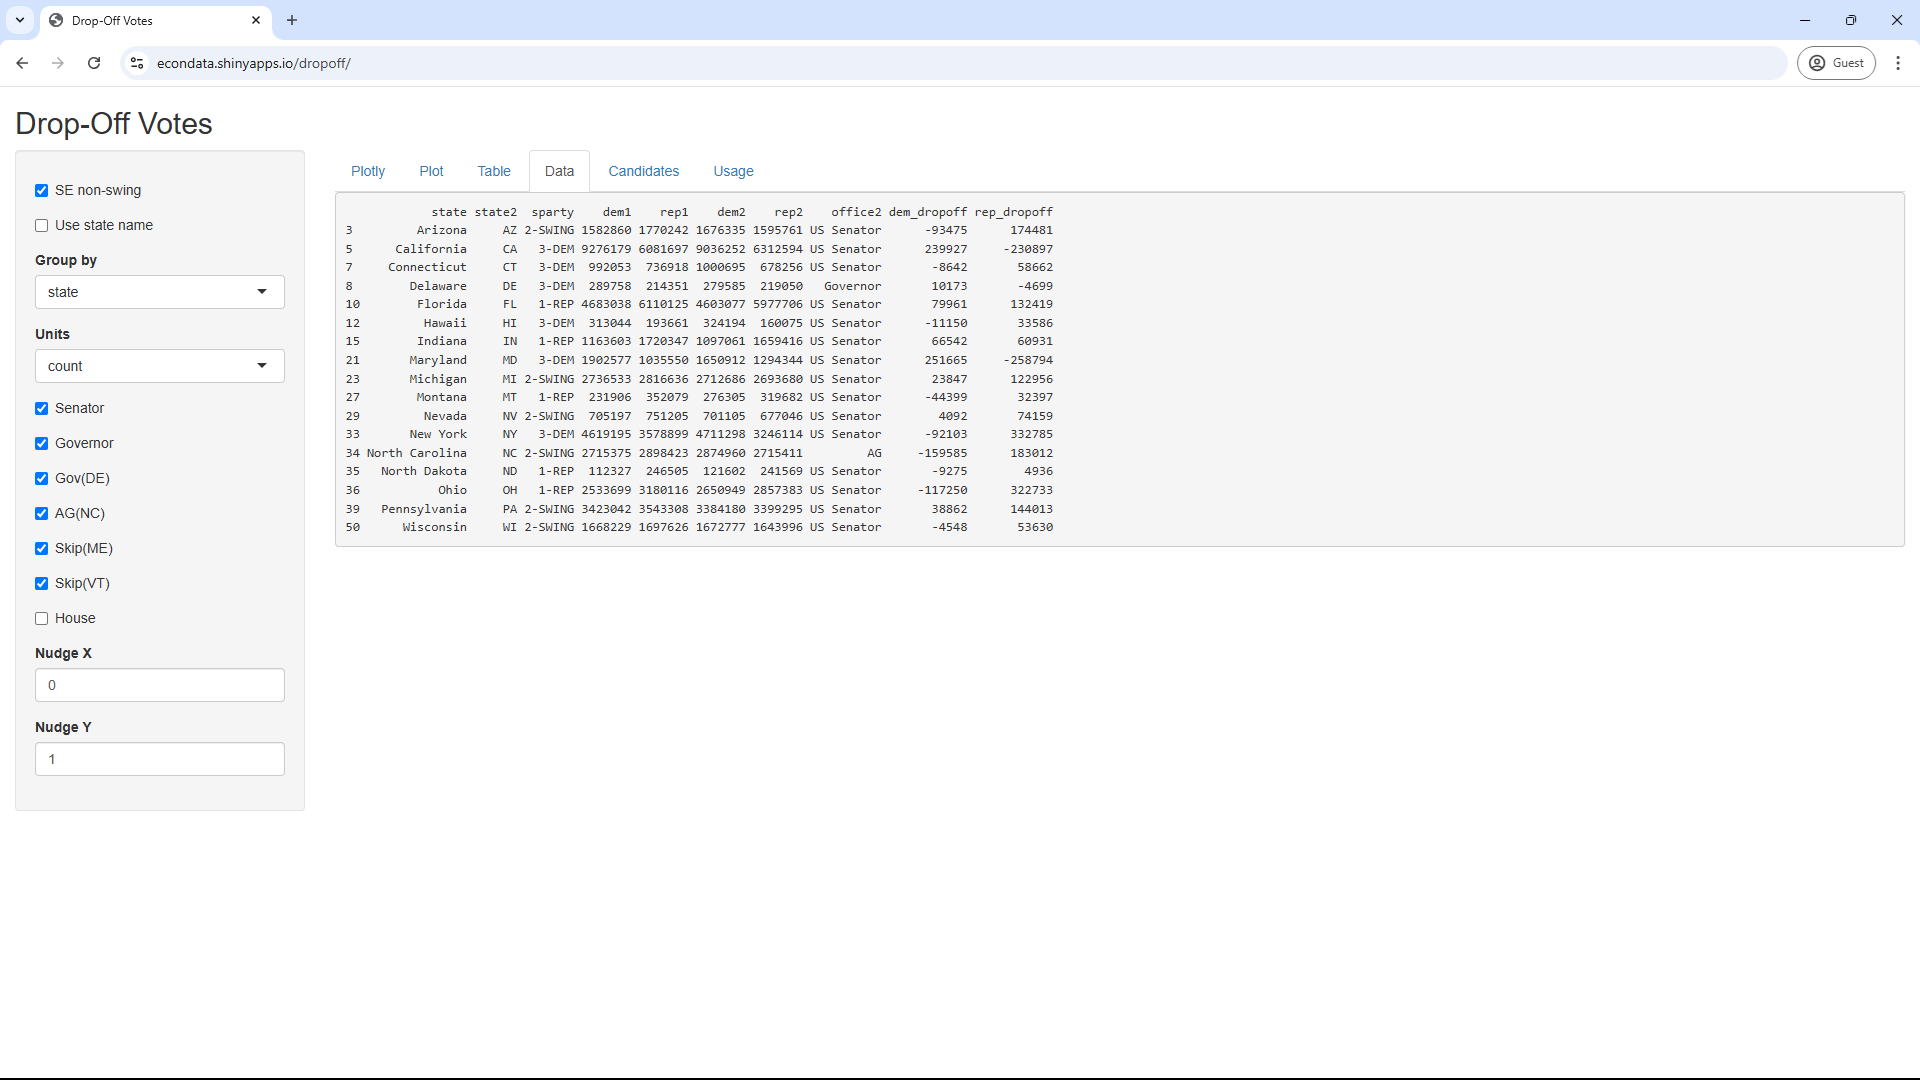
Checking the last two columns against the SMARTelection drop-off counts at SMARTelections.us shows identical vote drop-offs in the 10 states of AZ, DE, FL, HI, MD, MI, NV, ND, OH, and WI with relatively small differences in the remaining 7 states of CA, CT, IN, MT, NY, NC, and PA. These are likely due to the fact that the vote counts in those 7 states are continuing to go through minor updates.
Setting the "Units" select list back to "percent" and setting the "Group by" select list to "swing/non-swing" will change the data to the following:
        state      state2      sparty     dem1     rep1     dem2     rep2 dem_dropoff rep_dropoff
1 1-NON-SWING 1-NON-SWING 1-NON-SWING 26117379 23450248 25751930 22966189    1.399256    2.064196
2       SWING       SWING     2-SWING 12831236 13477440 13022043 12725189   -1.487051    5.581557
The drop-offs of -1.49% and 5.58% for SWING states are almost identical to the -1.48% and 5.58% shown in the SMARTelections analysis. Similarly, the drop-offs of 1.40% and 2.06% for NON-SWING states are almost identical to the 1.37% and 2.00% shown in the SMARTelections analysis. Again, this minor difference is likely due to the fact that the vote counts in some states are continuing to have relatively minor updates.
Changing the "Group by" select list from "swing/non-swing" to "swing/dem/rep" will change the data to the following:
  state state2  sparty     dem1     rep1     dem2     rep2 dem_dropoff rep_dropoff
1   DEM    DEM   3-DEM 17392806 11841076 17002936 11910433   2.2415590  -0.5857322
2   REP    REP   1-REP  8724573 11609172  8748994 11055756  -0.2799105   4.7670583
3 SWING  SWING 2-SWING 12831236 13477440 13022043 12725189  -1.4870508   5.5815570
This selection splits the non-swing states into those which lean Democratic and those which lean Republican. In fact, they are designated here as how the non-swing states voted for Harris and Trump. As can be seen, the Democratic and Republican drop-offs in the Democrat non-swing states was about 2.42% and -0.59%. In contrast, the Democratic and Republican drop-offs in the Republican non-swing states was about -0.28 and 4.77%, something of the reverse but with a larger positive drop-off for their preferred candidate, Trump. However, the swing states were even further in the Republican direction with Democratic and Republican drop-offs of -1.49% and 5.58%. Clicking on the Plotly tab will display the following graphical representation of this relationship:
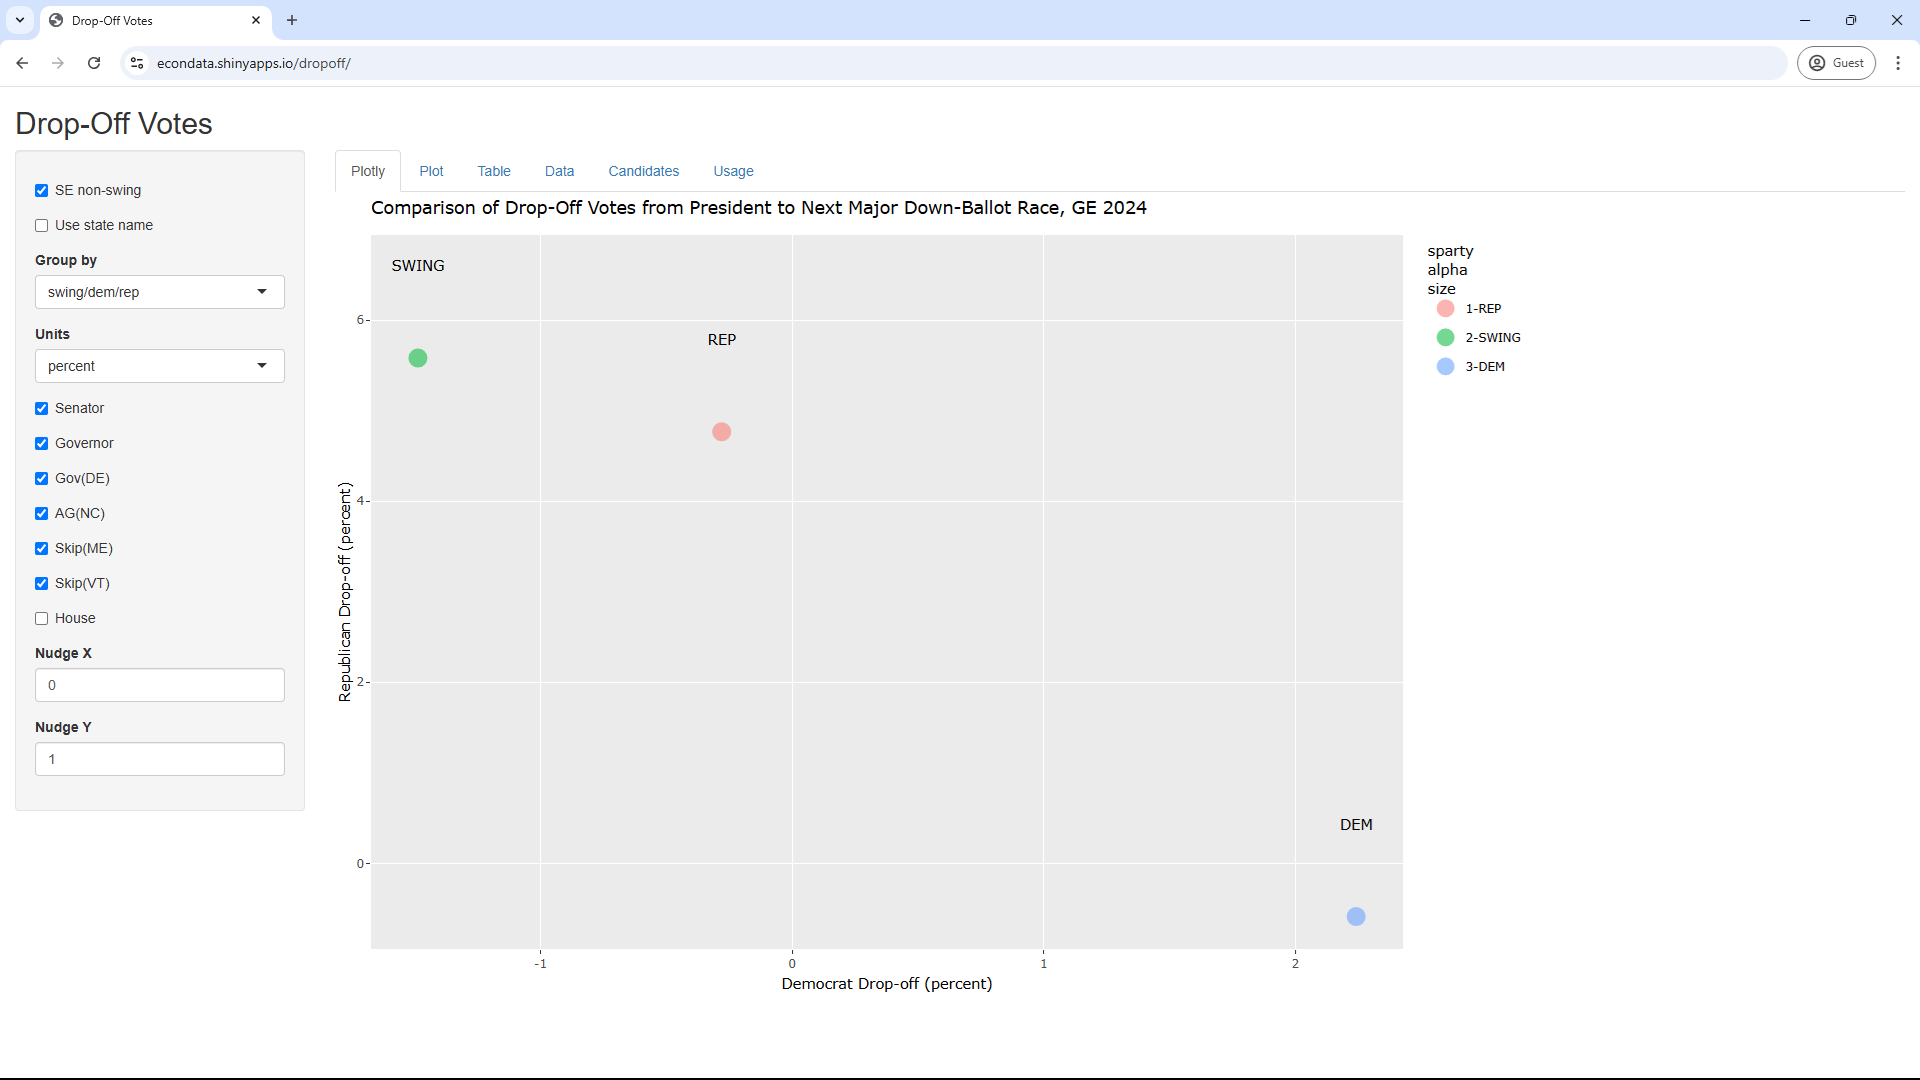
As can be seen, the swing states had a bit higher Republican drop-off than the Republican-leaning non-swing states (5.58% to 4.77%) but they had a markedly more negative Democrat drop-off (-1.49% to -0.28%). The fact that the swing states not only all voted Republican but were even more Republican than Republican-leaning states in this regard would seem to merit further investigation. Hopefully, this app can help in that process.
North Carolina - Percent Dropoff in Votes from President to NC Attorney General in 2024
On January 13, 2025, SMARTelections.us put out a release titled So Clean - Is that really how voters behave?. That release bagan as follows:
In EVERY COUNTY in North Carolina, according to the official election results, Vice President Kamala Harris received fewer votes than the Democratic candidate for Attorney General.
North Carolina complete drop-off votes and election results are here.
We covered this in the last Substack. But there's more now. If you're not sure what drop-off is, please read our original Substack on the topic, or check out our website.
Much of the data on this Substack is being released for the first time here.
Identical voter behavior in every county is not believable voter behavior. It seems highly unlikely that Vice President Harris got less votes than the Democratic candidate for Attorney General in every single county in North Carolina, at the same time that President Trump got more votes than the Republican candidate for Attorney General in every single county in North Carolina.
An R Shiny application using the same data duplicates this result, generating the following two screens:
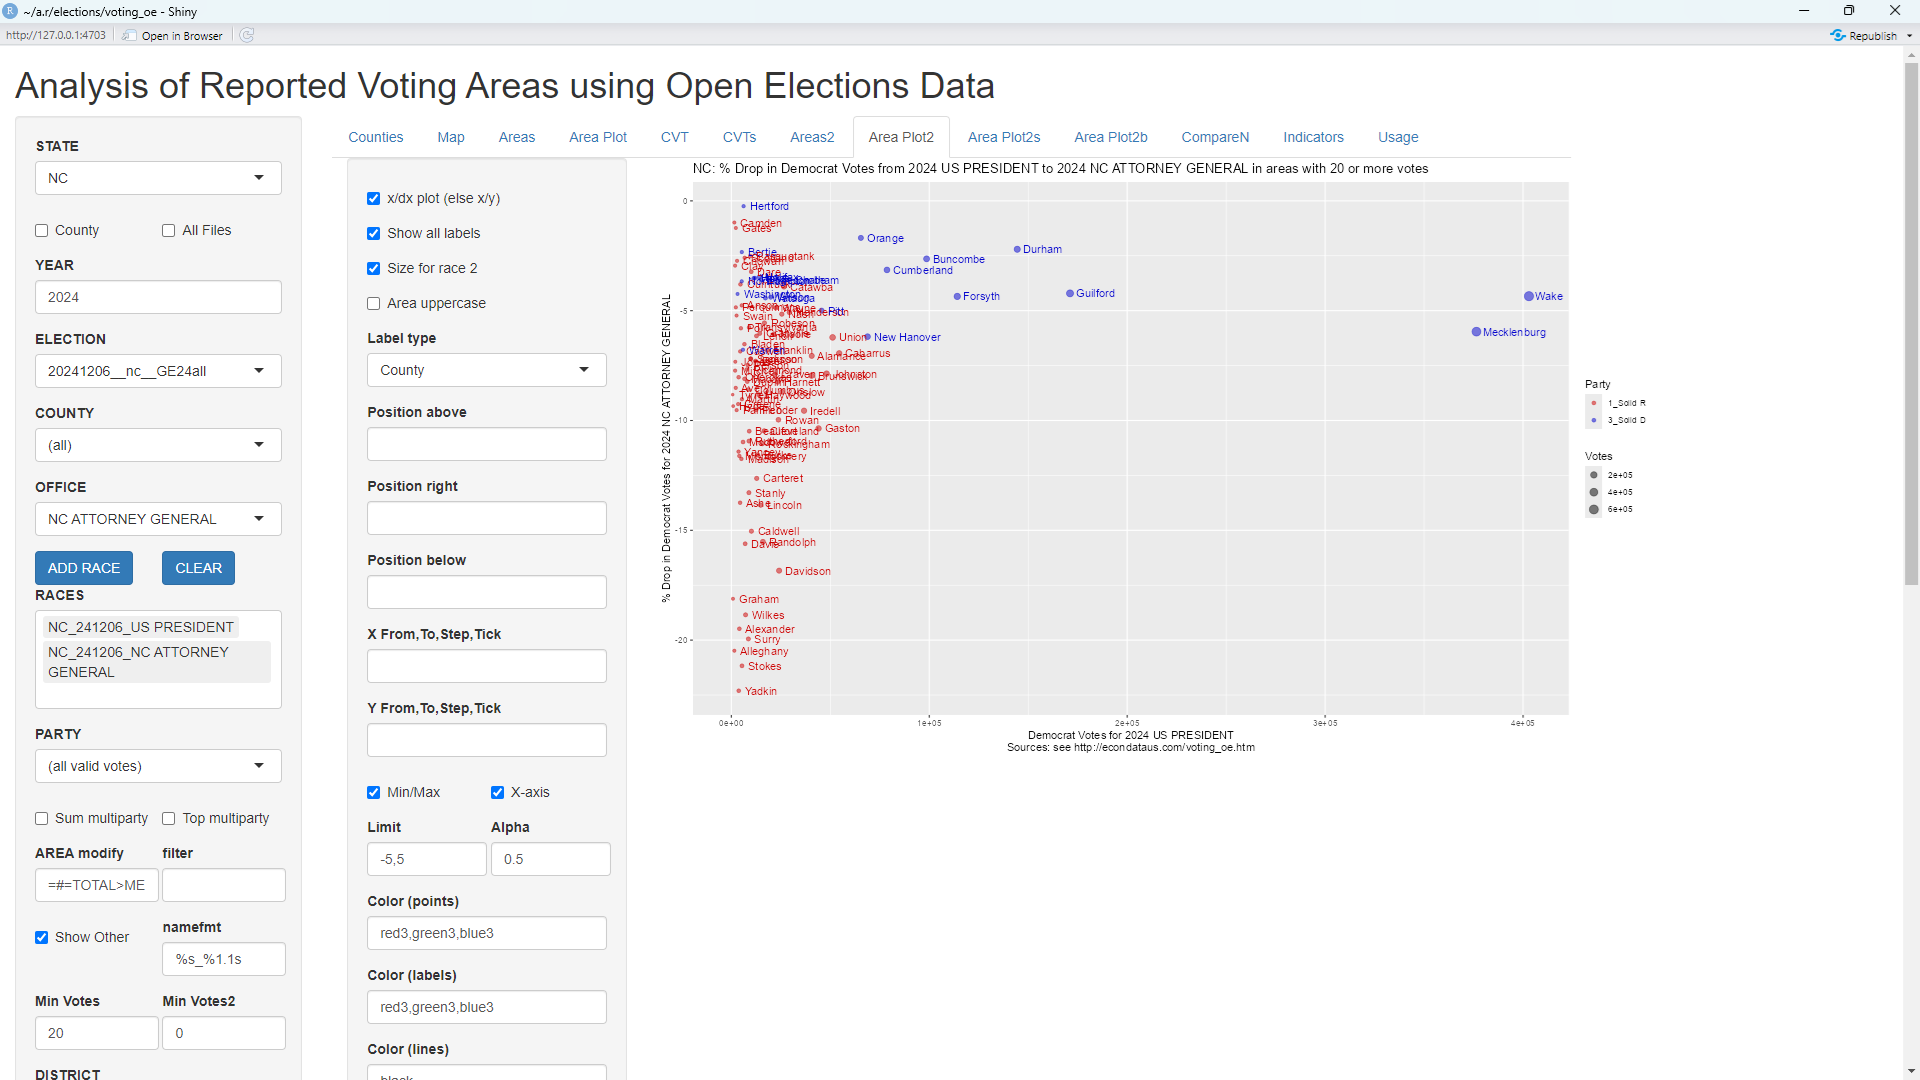
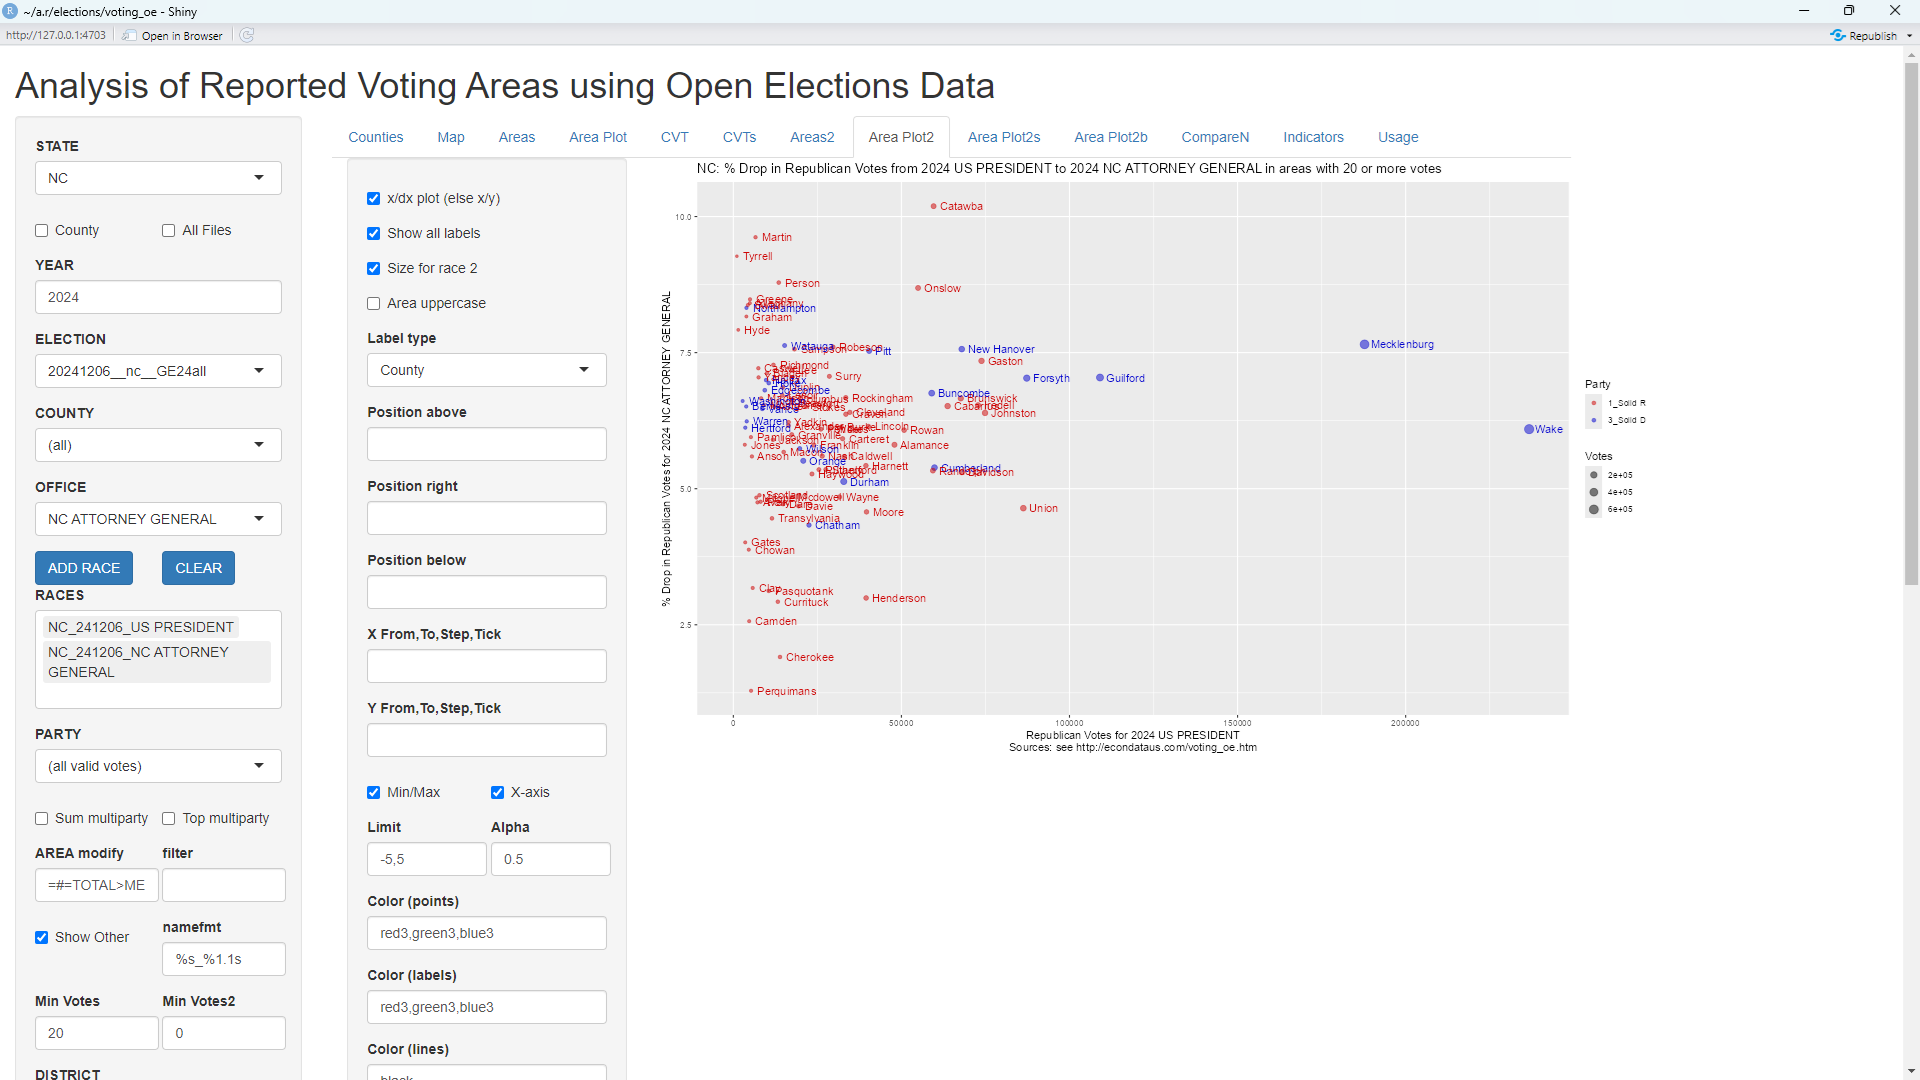
As can be seen, the dropoff in Democrat votes is negative in every county and the dropoff in Republican votes is positive in every county. Now one could argue that this was caused by split-ticket voting where many voters who voted for the Democrat Attorney General candidate voted for Trump. However, the SMARTelections release continues:
For example, Durham County is one of the most solidly Democratic Counties in the country. It is 80% Democratic. It is absurd to think that Harris got 3,000 votes less than the Democratic Candidate for Attorney General there.
Also, the following graph shows that there was a negative dropoff in Durham County for ALL voters, irregardless of party or split-ticket voting. That is, looking at all voters irregardless of party, more voters voted for the Attorney General race than for the Presidential race in Durham County. The same thing occurred in the solid Democrat counties of Wake, Mecklenburg, Chatham, Warren, and a number of solid Republican counties. This would seems very unexpected, at least.
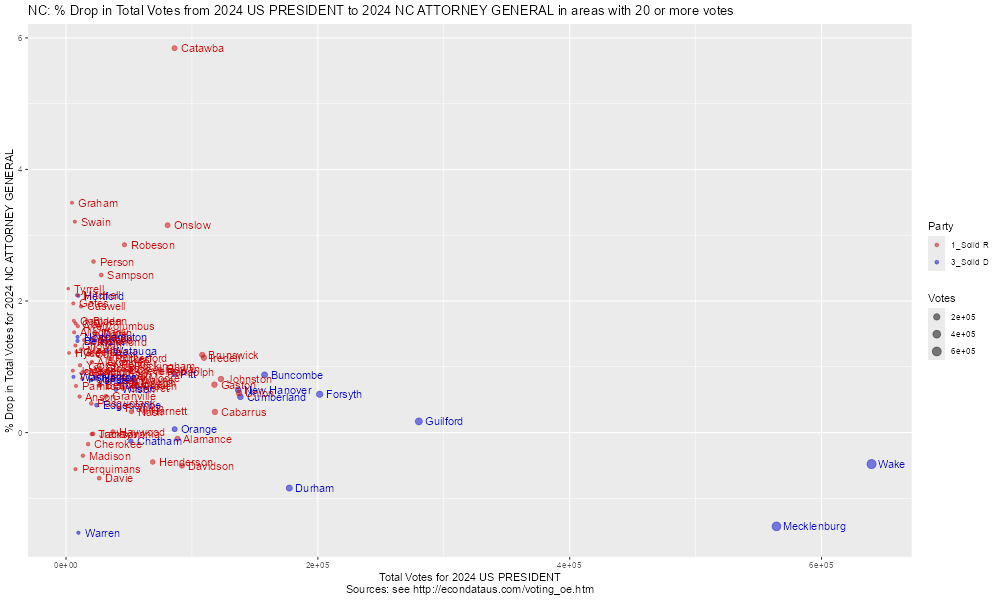
The following two graphs show that this pattern of the dropoff in Democrat votes being negative and the dropoff in Republican votes being positive in every county does not hold in every precinct.
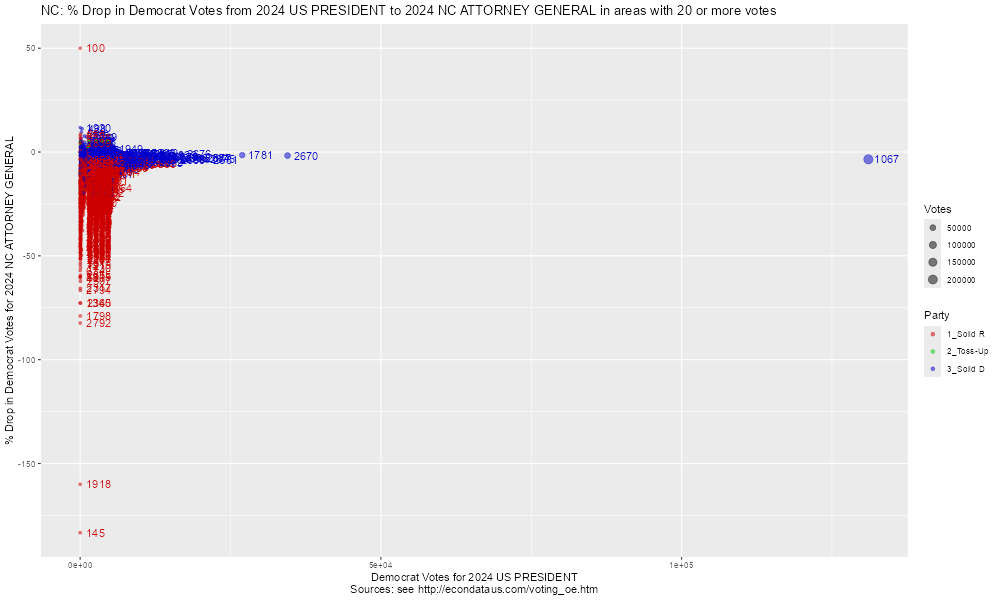
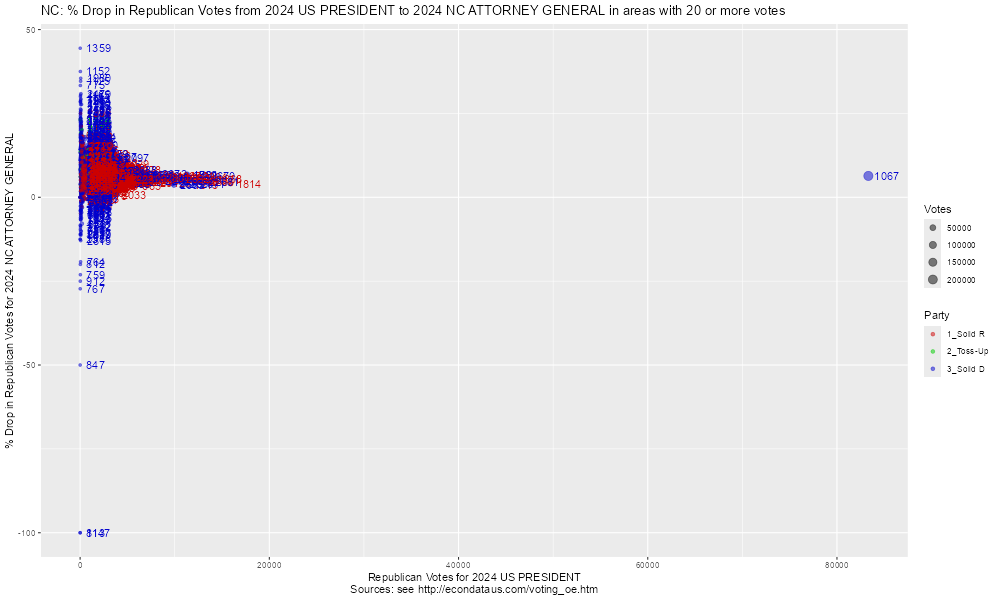
However, the following two graphs show that this pattern does hold if you look at just those precincts with 7090 or more votes:
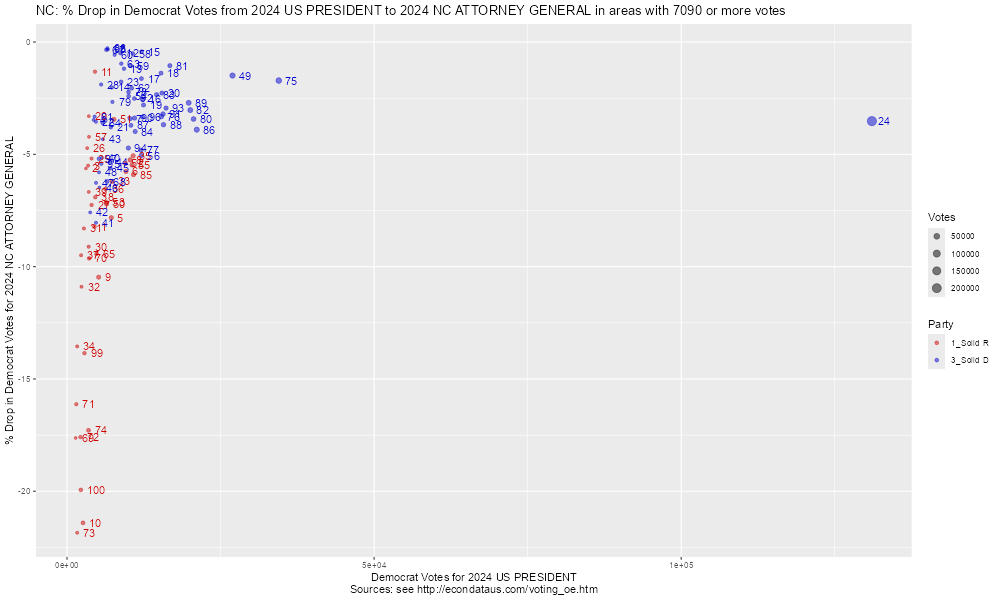
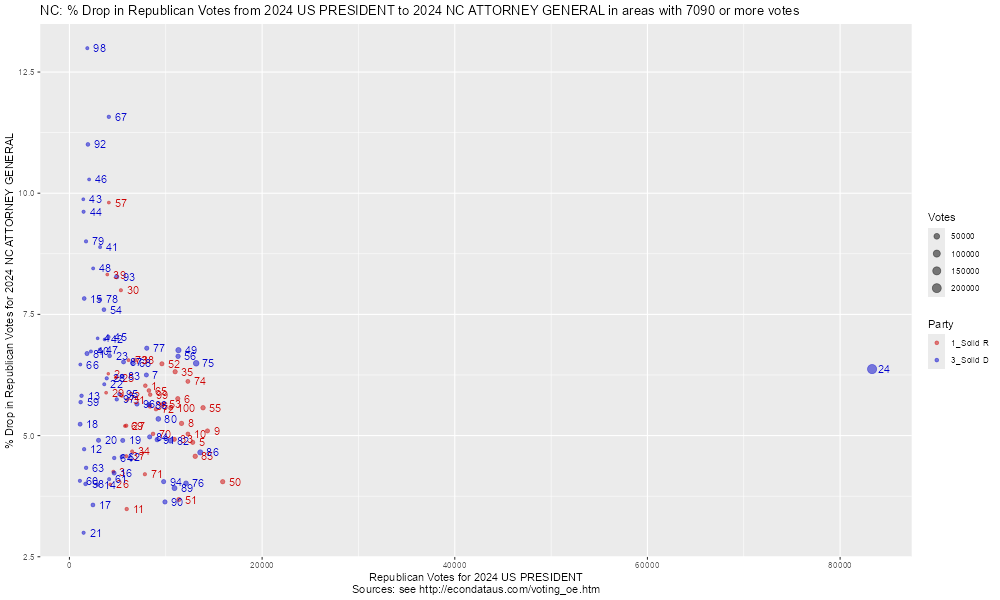
The limit of 7090 was chosen because there was a precinct with 7089 votes that broke the pattern. Still, the following table lists all North Carolina precincts with 7090 or more votes and includes the 100 largest precincts.
NC: % Drop in Republican Votes from 2024 US PRESIDENT to 2024 NC ATTORNEY GENERAL (Count % drop)
COUNTY AREA Dem Rep MARGIN1 TOTAL1 Dem.1 Rep.1 MARGIN2 TOTAL2 DEM_SH REP_SH MAR_SH TOT_SH
1 BEAUFORT EV-BOE 4,465 7,878 -3,413 12,343 4,832 7,403 -2,571 12,235 -8.22 6.03 24.67 0.87
2 BRUNSWICK NB07 3,073 4,032 -959 7,105 3,246 3,779 -533 7,025 -5.63 6.27 44.42 1.13
3 BRUNSWICK SB03 3,435 4,559 -1,124 7,994 3,624 4,365 -741 7,989 -5.50 4.26 34.07 0.06
4 CABARRUS ABSENTEE 4,323 2,926 1,397 7,249 4,473 2,721 1,752 7,194 -3.47 7.01 -25.41 0.76
5 CABARRUS EV-CAE 7,210 12,798 -5,588 20,008 7,774 12,176 -4,402 19,950 -7.82 4.86 21.22 0.29
6 CABARRUS EV-KTD 9,596 11,247 -1,651 20,843 10,149 10,599 -450 20,748 -5.76 5.76 72.74 0.46
7 CABARRUS EV-LOB 10,286 7,984 2,302 18,270 10,637 7,485 3,152 18,122 -3.41 6.25 -36.92 0.81
8 CABARRUS EV-NGA 10,274 11,636 -1,362 21,910 10,813 11,025 -212 21,838 -5.25 5.25 84.43 0.33
9 CALDWELL EV-CRC 5,149 14,325 -9,176 19,474 5,688 13,595 -7,907 19,283 -10.47 5.10 13.83 0.98
10 CALDWELL EV-SRC 2,602 12,297 -9,695 14,899 3,159 11,678 -8,519 14,837 -21.41 5.03 12.13 0.42
11 DARE EARLY VOTING KDH 4,551 5,941 -1,390 10,492 4,611 5,734 -1,123 10,345 -1.32 3.48 19.21 1.40
12 DURHAM ABS 8,682 1,526 7,156 10,208 8,725 1,454 7,271 10,179 -0.50 4.72 -1.61 0.28
13 DURHAM EV BOE 9,275 1,254 8,021 10,529 9,385 1,181 8,204 10,566 -1.19 5.82 -2.28 -0.35
14 DURHAM EV CMCC 7,270 2,933 4,337 10,203 7,417 2,816 4,601 10,233 -2.02 3.99 -6.09 -0.29
15 DURHAM EV DUKE 12,146 1,533 10,613 13,679 12,198 1,413 10,785 13,611 -0.43 7.83 -1.62 0.50
16 DURHAM EV EAST 12,273 4,638 7,635 16,911 12,585 4,442 8,143 17,027 -2.54 4.23 -6.65 -0.69
17 DURHAM EV ENO 12,115 2,438 9,677 14,553 12,312 2,351 9,961 14,663 -1.63 3.57 -2.93 -0.76
18 DURHAM EV MAIN 15,303 1,108 14,195 16,411 15,515 1,050 14,465 16,565 -1.39 5.23 -1.90 -0.94
19 DURHAM EV NORTH 12,450 5,531 6,919 17,981 12,799 5,260 7,539 18,059 -2.80 4.90 -8.96 -0.43
20 DURHAM EV SOUTH 15,459 3,019 12,440 18,478 15,810 2,871 12,939 18,681 -2.27 4.90 -4.01 -1.10
21 DURHAM EV ZAKAT 7,131 1,469 5,662 8,600 7,402 1,425 5,977 8,827 -3.80 3.00 -5.56 -2.64
22 EDGECOMBE EARLY VOTING 1 4,707 3,615 1,092 8,322 4,874 3,396 1,478 8,270 -3.55 6.06 -35.35 0.62
23 GUILFORD ABSENTEE 8,806 4,169 4,637 12,975 8,962 3,892 5,070 12,854 -1.77 6.64 -9.34 0.93
24 GUILFORD EARLYVOTE 131,049 83,320 47,729 214,369 135,663 78,011 57,652 213,674 -3.52 6.37 -20.79 0.32
25 HALIFAX EV ROANOKE RAPIDS 3,991 4,825 -834 8,816 4,198 4,526 -328 8,724 -5.19 6.20 60.67 1.04
26 HARNETT PR01 3,281 4,235 -954 7,516 3,436 4,066 -630 7,502 -4.72 3.99 33.96 0.19
27 HARNETT PR07 3,998 5,899 -1,901 9,897 4,288 5,592 -1,304 9,880 -7.25 5.20 31.40 0.17
28 HOKE BOE 5,555 3,867 1,688 9,422 5,660 3,628 2,032 9,288 -1.89 6.18 -20.38 1.42
29 HOKE ROCKFISH 3,546 3,807 -261 7,353 3,663 3,583 80 7,246 -3.30 5.88 130.65 1.46
30 IREDELL CC3-1 3,523 5,339 -1,816 8,862 3,844 4,912 -1,068 8,756 -9.11 8.00 41.19 1.20
31 IREDELL DV1B-1 2,747 5,976 -3,229 8,723 2,975 5,633 -2,658 8,608 -8.30 5.74 17.68 1.32
32 IREDELL FT 2,359 5,447 -3,088 7,806 2,616 5,130 -2,514 7,746 -10.89 5.82 18.59 0.77
33 JOHNSTON EV-ARCHER LODGE 7,333 10,888 -3,555 18,221 7,788 10,352 -2,564 18,140 -6.20 4.92 27.88 0.44
34 JOHNSTON EV-BENSON 1,653 6,505 -4,852 8,158 1,877 6,201 -4,324 8,078 -13.55 4.67 10.88 0.98
35 JOHNSTON EV-CLAYTON 10,764 10,971 -207 21,735 11,309 10,278 1,031 21,587 -5.06 6.32 598.07 0.68
36 JOHNSTON EV-CLEVELAND 6,257 8,370 -2,113 14,627 6,666 7,901 -1,235 14,567 -6.54 5.60 41.55 0.41
37 JOHNSTON EV-PROVIDENCE 2,296 5,902 -3,606 8,198 2,514 5,632 -3,118 8,146 -9.49 4.57 13.53 0.63
38 JOHNSTON EV-SMITHFIELD 4,603 6,844 -2,241 11,447 4,921 6,395 -1,474 11,316 -6.91 6.56 34.23 1.14
39 MARTIN EARLY VOTING 3,537 3,929 -392 7,466 3,773 3,602 171 7,375 -6.67 8.32 143.62 1.22
40 MECKLENBURG 145 5,658 2,227 3,431 7,885 5,950 2,077 3,873 8,027 -5.16 6.74 -12.88 -1.80
41 MECKLENBURG 148 4,712 3,184 1,528 7,896 5,091 2,901 2,190 7,992 -8.04 8.89 -43.32 -1.22
42 MECKLENBURG 202 3,771 3,652 119 7,423 4,057 3,397 660 7,454 -7.58 6.98 -454.62 -0.42
43 MECKLENBURG 211 5,846 1,438 4,408 7,284 6,099 1,296 4,803 7,395 -4.33 9.87 -8.96 -1.52
44 MECKLENBURG 212 7,021 1,466 5,555 8,487 7,396 1,325 6,071 8,721 -5.34 9.62 -9.29 -2.76
45 MECKLENBURG 229 7,067 4,038 3,029 11,105 7,464 3,754 3,710 11,218 -5.62 7.03 -22.48 -1.02
46 MECKLENBURG 230 5,280 2,042 3,238 7,322 5,622 1,832 3,790 7,454 -6.48 10.28 -17.05 -1.80
47 MECKLENBURG 241 4,722 3,159 1,563 7,881 5,018 2,945 2,073 7,963 -6.27 6.77 -32.63 -1.04
48 MECKLENBURG 243 5,207 2,462 2,745 7,669 5,509 2,254 3,255 7,763 -5.80 8.45 -18.58 -1.23
49 MECKLENBURG ABSENTEE BY MAIL 26,943 11,314 15,629 38,257 27,345 10,549 16,796 37,894 -1.49 6.76 -7.47 0.95
50 MOORE EV AG 6,431 15,909 -9,478 22,340 6,894 15,265 -8,371 22,159 -7.20 4.05 11.68 0.81
51 MOORE EV RS 7,637 11,358 -3,721 18,995 7,900 10,940 -3,040 18,840 -3.44 3.68 18.30 0.82
52 NEW HANOVER EARLY VOTING BOE 9,491 9,598 -107 19,089 10,003 8,976 1,027 18,979 -5.39 6.48 1,059.81 0.58
53 NEW HANOVER EARLY VOTING CB 6,390 9,704 -3,314 16,094 6,846 9,156 -2,310 16,002 -7.14 5.65 30.30 0.57
54 NEW HANOVER EARLY VOTING CFCC 10,035 3,580 6,455 13,615 10,277 3,308 6,969 13,585 -2.41 7.60 -7.96 0.22
55 NEW HANOVER EARLY VOTING NLB 10,603 13,868 -3,265 24,471 11,183 13,095 -1,912 24,278 -5.47 5.57 41.44 0.79
56 NEW HANOVER EARLY VOTING SRC 12,085 11,274 811 23,359 12,696 10,526 2,170 23,222 -5.06 6.63 -167.57 0.59
57 ONSLOW EN03 3,579 4,089 -510 7,668 3,730 3,688 42 7,418 -4.22 9.81 108.24 3.26
58 ORANGE EV CHL 10,712 1,674 9,038 12,386 10,767 1,607 9,160 12,374 -0.51 4.00 -1.35 0.10
59 ORANGE EV CL 10,322 1,160 9,162 11,482 10,430 1,094 9,336 11,524 -1.05 5.69 -1.90 -0.37
60 ORANGE EV COTC 7,750 1,082 6,668 8,832 7,794 1,038 6,756 8,832 -0.57 4.07 -1.32 0.00
61 ORANGE EV ECC 4,489 4,122 367 8,611 4,638 3,953 685 8,591 -3.32 4.10 -86.65 0.23
62 ORANGE EV OW 10,514 5,457 5,057 15,971 10,730 5,208 5,522 15,938 -2.05 4.56 -9.20 0.21
63 ORANGE EV SCH 8,838 1,730 7,108 10,568 8,923 1,655 7,268 10,578 -0.96 4.34 -2.25 -0.09
64 PITT EV AG CENTER 5,779 4,650 1,129 10,429 5,987 4,439 1,548 10,426 -3.60 4.54 -37.11 0.03
65 PITT EV BOYD LEE 4,803 8,247 -3,444 13,050 5,256 7,758 -2,502 13,014 -9.43 5.93 27.35 0.28
66 PITT EV EPPES 6,572 1,129 5,443 7,701 6,590 1,056 5,534 7,646 -0.27 6.47 -1.67 0.71
67 PITT EV STUDENT CENTER 6,389 4,086 2,303 10,475 6,411 3,613 2,798 10,024 -0.34 11.58 -21.49 4.31
68 PITT EV WINTERVILLE 6,552 6,535 17 13,087 6,959 6,110 849 13,069 -6.21 6.50 -4,894.12 0.14
69 RANDOLPH TR 1,407 5,753 -4,346 7,160 1,655 5,454 -3,799 7,109 -17.63 5.20 12.59 0.71
70 STANLY EV-BOE 3,603 8,679 -5,076 12,282 3,950 8,242 -4,292 12,192 -9.63 5.04 15.45 0.73
71 STANLY EV-LOC 1,507 7,830 -6,323 9,337 1,750 7,501 -5,751 9,251 -16.12 4.20 9.05 0.92
72 STOKES EV KING 2,189 8,983 -6,794 11,172 2,574 8,485 -5,911 11,059 -17.59 5.54 13.00 1.01
73 SURRY EARLY VOTING 1 1,657 6,132 -4,475 7,789 2,019 5,730 -3,711 7,749 -21.85 6.56 17.07 0.51
74 SURRY EARLY VOTING 3 3,500 12,293 -8,793 15,793 4,105 11,541 -7,436 15,646 -17.29 6.12 15.43 0.93
75 WAKE ABSEN 34,479 13,156 21,323 47,635 35,070 12,302 22,768 47,372 -1.71 6.49 -6.78 0.55
76 WAKE EVAB 15,350 12,102 3,248 27,452 15,859 11,616 4,243 27,475 -3.32 4.02 -30.63 -0.08
77 WAKE EVAV 12,050 8,026 4,024 20,076 12,630 7,480 5,150 20,110 -4.81 6.80 -27.98 -0.17
78 WAKE EVBOE 10,015 3,150 6,865 13,165 10,238 2,904 7,334 13,142 -2.23 7.81 -6.83 0.17
79 WAKE EVBR 7,394 1,721 5,673 9,115 7,591 1,566 6,025 9,157 -2.66 9.01 -6.20 -0.46
80 WAKE EVCA 20,604 9,226 11,378 29,830 21,310 8,733 12,577 30,043 -3.43 5.34 -10.54 -0.71
81 WAKE EVCH 16,746 1,823 14,923 18,569 16,922 1,701 15,221 18,623 -1.05 6.69 -2.00 -0.29
82 WAKE EVCS 20,067 10,499 9,568 30,566 20,675 9,985 10,690 30,660 -3.03 4.90 -11.73 -0.31
83 WAKE EVGR 14,590 5,465 9,125 20,055 14,932 5,125 9,807 20,057 -2.34 6.22 -7.47 -0.01
84 WAKE EVHS 11,097 8,326 2,771 19,423 11,539 7,912 3,627 19,451 -3.98 4.97 -30.89 -0.14
85 WAKE EVHT 10,830 13,056 -2,226 23,886 11,469 12,459 -990 23,928 -5.90 4.57 55.53 -0.18
86 WAKE EVJB 21,120 13,583 7,537 34,703 21,944 12,951 8,993 34,895 -3.90 4.65 -19.32 -0.55
87 WAKE EVKD 10,411 5,615 4,796 16,026 10,797 5,249 5,548 16,046 -3.71 6.52 -15.68 -0.12
88 WAKE EVLH 15,706 8,245 7,461 23,951 16,284 7,780 8,504 24,064 -3.68 5.64 -13.98 -0.47
89 WAKE EVLL 19,809 10,905 8,904 30,714 20,345 10,478 9,867 30,823 -2.71 3.92 -10.82 -0.35
90 WAKE EVNR 10,992 9,915 1,077 20,907 11,364 9,555 1,809 20,919 -3.38 3.63 -67.97 -0.06
91 WAKE EVOP 15,635 9,112 6,523 24,747 16,136 8,664 7,472 24,800 -3.20 4.92 -14.55 -0.21
92 WAKE EVSE 10,945 1,917 9,028 12,862 11,220 1,706 9,514 12,926 -2.51 11.01 -5.38 -0.50
93 WAKE EVTA 16,122 4,905 11,217 21,027 16,596 4,499 12,097 21,095 -2.94 8.28 -7.85 -0.32
94 WAKE EVWA 9,981 9,779 202 19,760 10,452 9,383 1,069 19,835 -4.72 4.05 -429.21 -0.38
95 WAKE EVWD 5,579 5,192 387 10,771 5,881 4,888 993 10,769 -5.41 5.86 -156.59 0.02
96 WAKE EVWN 12,303 7,008 5,295 19,311 12,714 6,612 6,102 19,326 -3.34 5.65 -15.24 -0.08
97 WAKE EVZB 5,175 4,907 268 10,082 5,444 4,625 819 10,069 -5.20 5.75 -205.60 0.13
98 WATAUGA EV ASU 6,643 1,855 4,788 8,498 6,665 1,614 5,051 8,279 -0.33 12.99 -5.49 2.58
99 WILKES OFFICE EV 2,837 8,384 -5,547 11,221 3,230 7,894 -4,664 11,124 -13.85 5.84 15.92 0.86
100 YADKIN EARLY VOTING 2,252 10,495 -8,243 12,747 2,701 9,911 -7,210 12,612 -19.94 5.56 12.53 1.06
101 TOTAL TOTAL 2,715,375 2,898,423 -183,048 5,613,798 2,874,960 2,715,411 159,549 5,590,371 -5.88 6.31 187.16 0.42
Source: North Carolina Historical Election Results Data, 2024 numbers downloaded at 8:46 PM PST on 12/06/2024
Note that the 24th precinct is an Earlyvote center in Guilford County that had over 200,000 votes and is on the far right of the prior two graphs.