On March 8, 2033 Bloomberg Businessweek posted an article titled America's $52 Billion Plan to Make Chips at Home Faces a Labor Shortage". Following is an excerpt from that article:
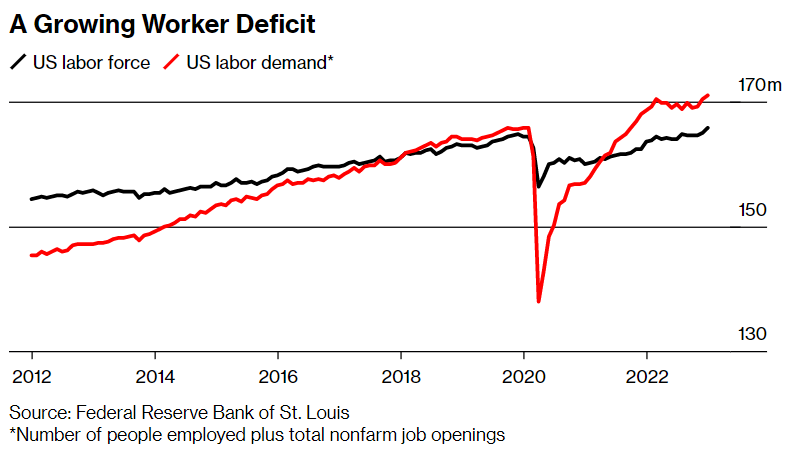
The ultratight labor market is often treated as a pandemic-driven aberration. But there's a strong case to be made that it's really the product of demographic trends that predated, and accelerated with, Covid-19. Experts say that without meaningful government intervention, America's worker deficit could become a tax on growth and trigger a new wave of offshoring, like the one the Chips and Science Act of 2022 is trying to reverse.
The US working-age population shrank in 2018 for the first time since at least 1960, as baby boomer retirements picked up and fewer young people entered the labor force. The cohort, which covers those aged 15 to 64, also contracted in the two years that followed and has edged up since only because of a bounceback in international immigration. (The jump was largely a product of the easing of travel restrictions instituted at the height of the pandemic.)

The above graph does appear based on data from the Federal Reserve Bank of St. Louis as noted. However, if you go to this St. Louis Fed Link, click "EDIT GRAPH", and change Units to "Percent Change from Year Ago", you will get the following graph":

The tooltip showing the 2022 value of 0.97870 is generated by hovering the mouse over that point. Note that this is a marked increase not shown in the Bloomberg graph. The reason for this difference is that the Bloomberg graph shows a five-year rolling average which greatly reduces the increase for 2022 since it includes the decrease in the pandemic of 2020. The Bloomberg graph also notes that 2022 is an estimate. You can download the data by clicking the DOWNLOAD button above the Federal Reserve graph. The downloaded data says nothing about this being an estimate. Of course, all recent employment data is an estimate in the sense that it is often updated in later months. In any event, the use of 5-year rolling averages seems extremely misleading.
As noted, the article text before the graph states that the "US working-age population shrank in 2018 for the first time since at least 1960" and that it "also contracted in the two years that followed and has edged up since only because of a bounceback in international immigration." Strangely, this is not visible in the Bloomberg graph because of the use of 5-year rolling averages. However, it is visible in the graph above that shows 1-year averages! A skeptical person might suspect that the article chose to describe cherry-picked points from the 1-year graph but display the 5-year rolling average graph in order to mislead. In any event, one wonders how the article concluded that the it "edged up since only because of a bounceback in international immigration". The article provides no evidence of this.
Another problem with the graph is that it is looking at the entire U.S. working-age population. Of course, many of the workers at the new chip fabs will need to be skilled. Following is a graph showing the growth in U.S. citizens employed in Computer and Mathematical Occupations, taken from the monthly BLS (Bureau of Labor Statistics) data.
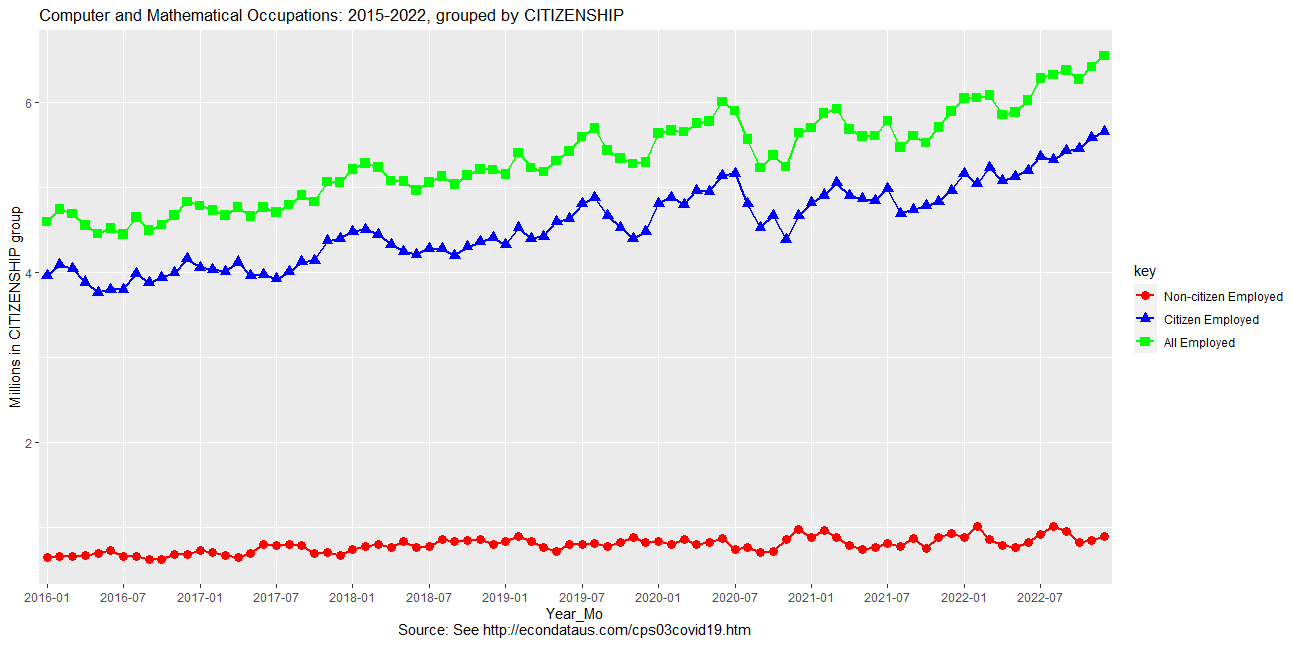
As can be seen, this is definitely not declining, especially since the start of 2022. The numbers and related data can be seen at this link.