Analyzing Establishment Survey Data using Tools on the BLS Website
Analyzing Establishment Survey Data using Tools on the FRED Website
Comparing Employment from the BLS Establishment and Household Surveys
Analyzing Household Survey Data using Tools on the BLS Website
Analyzing Basic Monthly CPS Data using Shiny
Analyzing Establishment Survey Data using Tools on the BLS Website
On January 5th, 2024, an article appeared in the Wall Street Journal titled "IT Employment Grew by Just 700 Jobs in 2023, Down From 267,000 in 2022". The article begins:
The information-technology sector grew by only 700 jobs over 2023, a drastic slowdown from the 267,000 jobs added in 2022, even as artificial intelligence and ChatGPT spawned huge interest from businesses.
Job losses in the first half of 2023, including layoffs at technology-driven companies that dominated the period, hurt overall hiring for tech jobs in all industries, said Victor Janulaitis, chief executive of consulting company Janco Associates. The firm bases its findings on data from the U.S. Department of Labor.
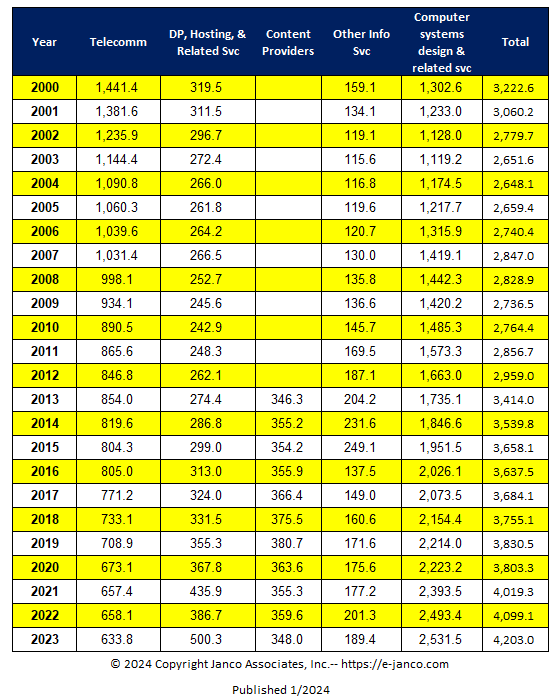
A page on the website of the consulting company quoted in the WSJ article mentions the 700 jobs and contains the following table:
That table lists the following 5 industry categories as being included in IT jobs:

Its also possible to retrieve the data for the 5 industry categories by going to this BLS page, checking the rightmost (Seasonally Adjusted) checkbox for the following 5 lines and clicking the "Retrieve data" button.
Analyzing Establishment Survey Data using Tools on the FRED Website
There was no obvious way to create a graph on the BLS site that summed all 5 categories. However, it is possible to do so on the FRED (Federal Reserve Economic Data) site via the following steps:
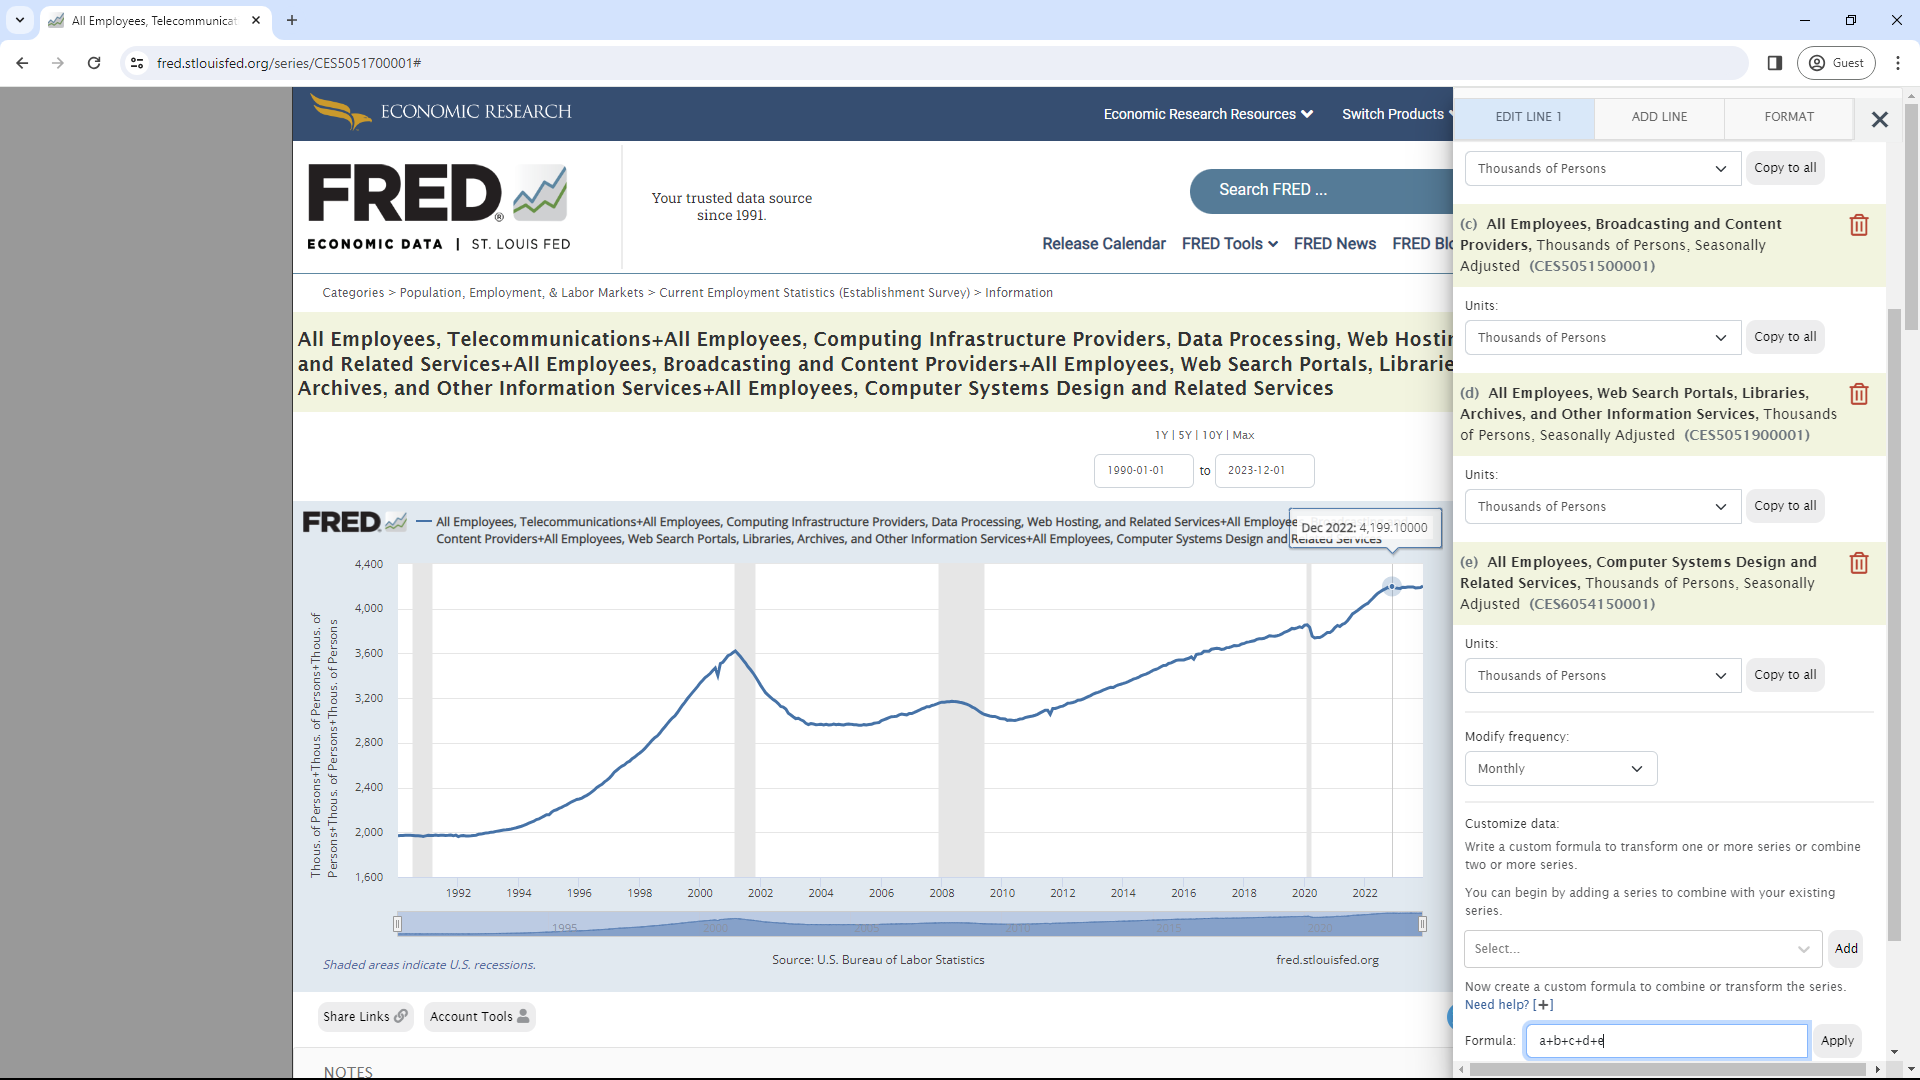
The graph does show a value of 4,199.1 for December 2022 whereas the yellow-striped table above from Janco Associates shows 4099.1 for 2022. This appeared to have been caused by a bad value of 367.8 for "DP, Hosting & Related Svc" in 2022 rather than the correct 467.8.
The 2023 total of 4203.0 is an increase of 3.9 thousand over the correct total of 4199.1 for 2022, not the 700 reported in the article. This may be due to some other adjustment to the data. However, the graph does clearly show that this measure of IT jobs was flat over 2023. The graph also shows that this measure of IT jobs did not surpass the peak of 3,622.3 thousand jobs that it reached in March of 2001 until December of 2016 and, in December of 2023, is only about 16 percent above that 2001 peak.
Comparing Employment from the BLS Establishment and Household Surveys
The analysis above was all done on data from the BLS Establishment Survey. The BLS also publishes the results of the Household Survey. At this page, they give the following comparison of the BLS household and payroll (or establishment) surveys:
The Bureau of Labor Statistics (BLS) has two monthly surveys that measure employment levels and trends: the Current Population Survey (CPS), also known as the household survey, and the Current Employment Statistics (CES) survey, also known as the payroll or establishment survey.
Both surveys are needed for a complete picture of the labor market.
The payroll survey (CES) is designed to measure employment, hours, and earnings in the nonfarm sector, with industry and geographic detail. The survey is best known for providing a highly reliable gauge of monthly change in nonfarm payroll employment. A representative sample of businesses in the U.S. provides the data for the payroll survey.
The household survey (CPS) is designed to measure the labor force status of the civilian noninstitutional population with demographic detail. The national unemployment rate is the best-known statistic produced from the household survey. The survey also provides a measure of employed people, one that includes agricultural workers and the self-employed. A representative sample of U.S. households provides the information for the household survey. <
National employment estimates from both the household and payroll surveys are published in the Employment Situation news release each month. The estimates differ because the surveys have distinct definitions of employment and distinct survey and estimation methods. (See the Comparison of survey concepts, definitions, and methodologies below.)
Analyzing Household Survey Data using Tools on the BLS Website
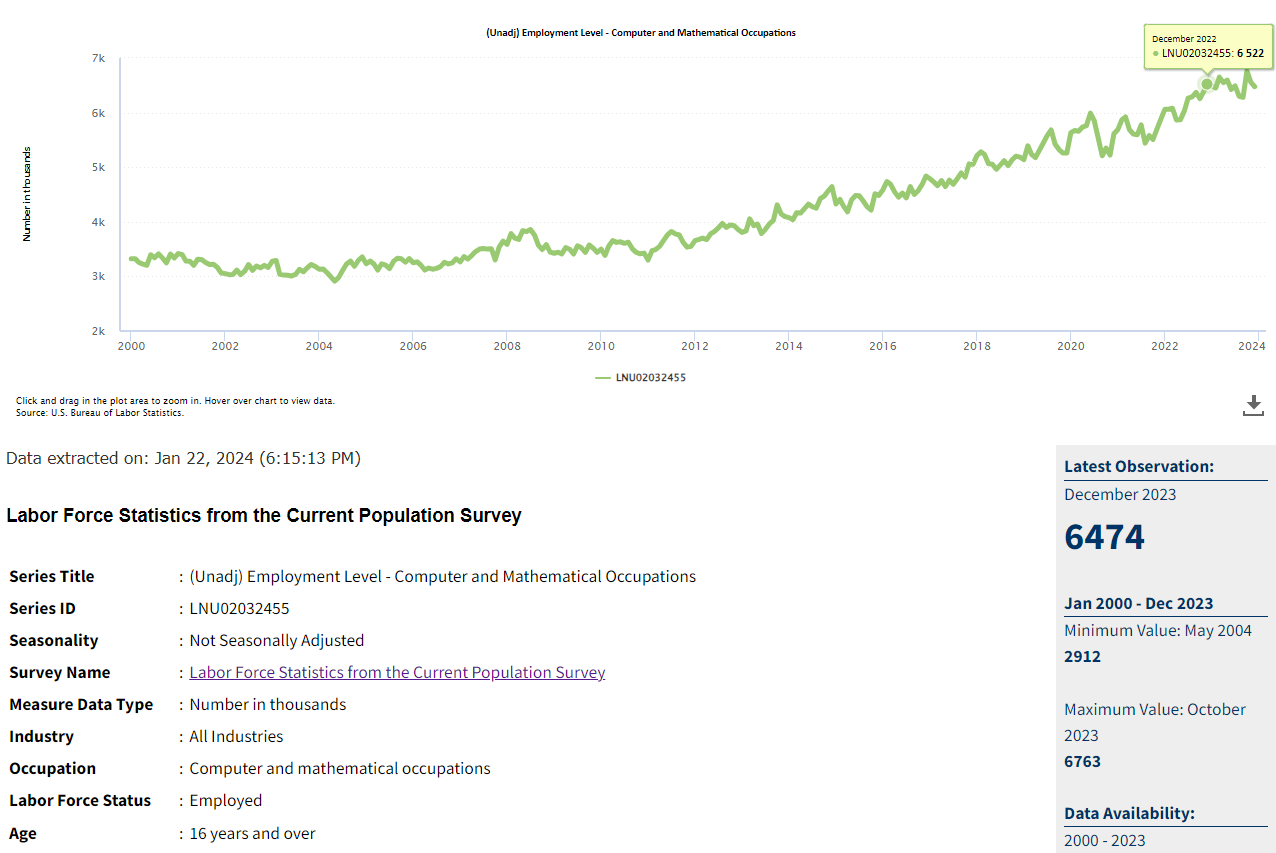
A number of tables of CPS data can be found at this link. Table A-19 shows employed persons by occupation, sex, and age. It shows that the number of employed persons 16 years or older in "Computer and mathematical occupations" actually declined from 6,522 thousand to 6,474 thousand from December of 2022 to December of 2023. That's a decline of 48 thousand. It is possible to graph this on the BLS site via the following steps:
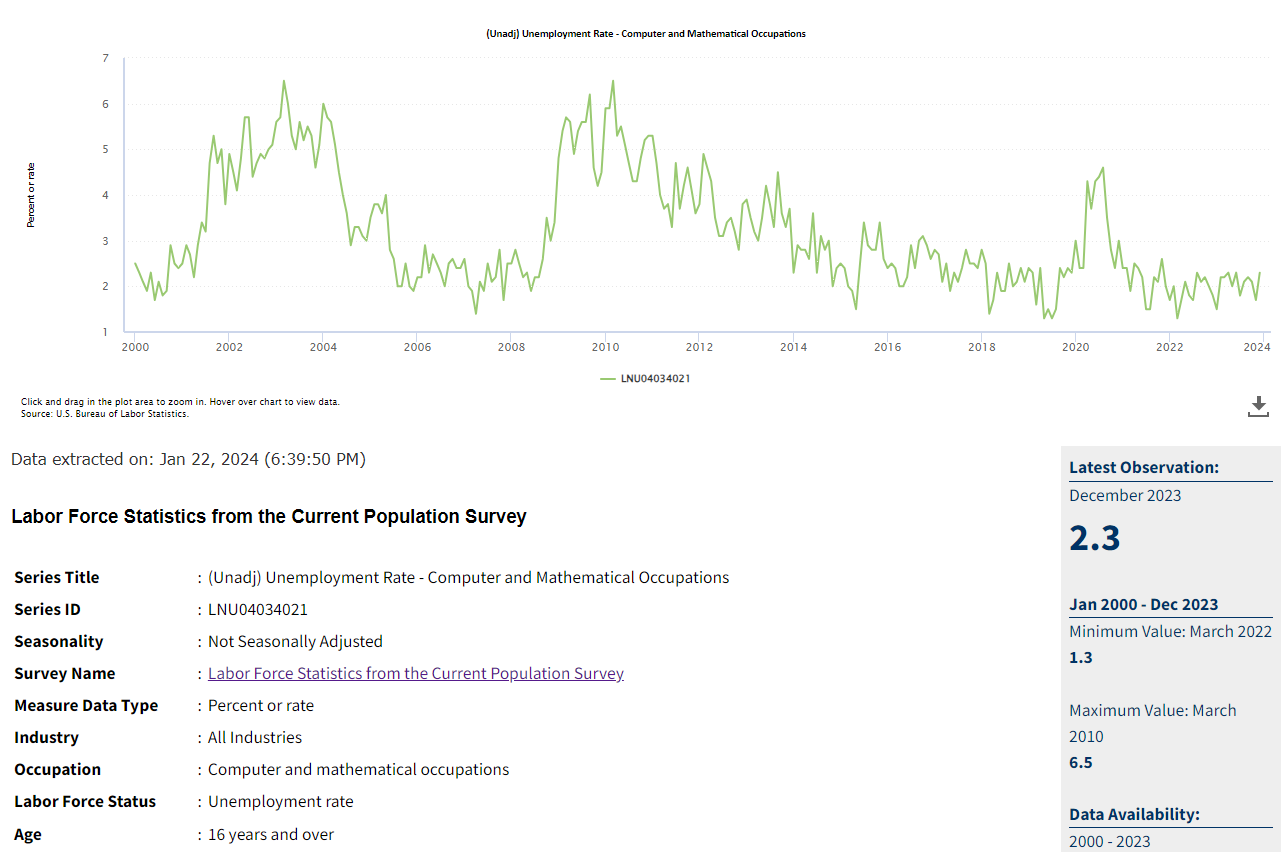
It's possible to graph the unemployment rate of Computer and Mathematical Occupations by changing steps 5 and 6 of the above steps as follows:
Analyzing Basic Monthly CPS Data using Shiny
One drawback of analyzing CPS data with tools on the BLS site is that it's only possible to look at data for which there is a Series ID. It's possible to avoid this restriction by looking directly at Current Population Survey Datasets such as Basic Monthly CPS data posted online at this link. A publicly available Shiny app at https://econdata.shinyapps.io/cps_monthly1/ can be used to analyze some of this data. For example, the Employment Level for Computer and Mathematical Occupations since 2016 can be viewed via the following steps:
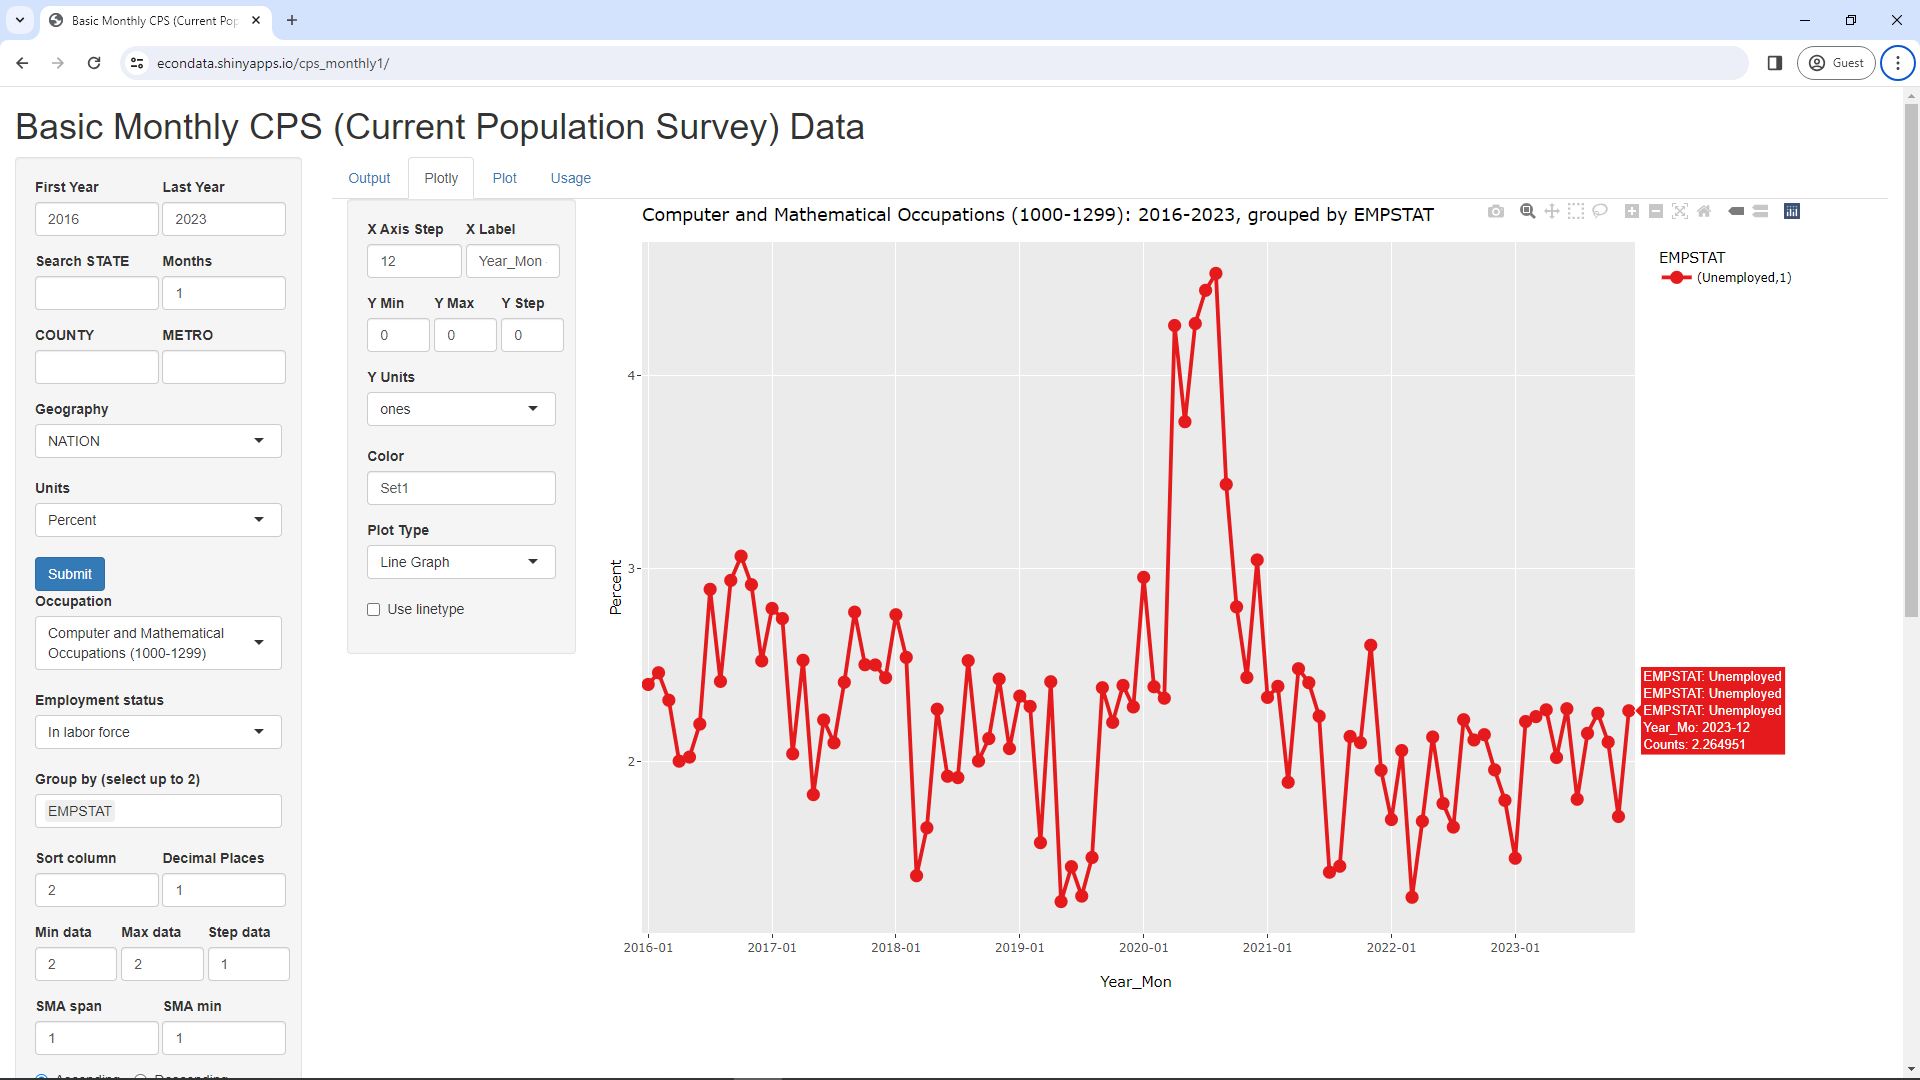
As can be seen, the graph looks very much like the graph of the same unemployment rate after 2016 in the prior section. Also, the last point is about 2.3 percent, the same as before.
This graph can be changed to display the employment level of Computer and Mathematical Occupations since 2016 via the following steps:
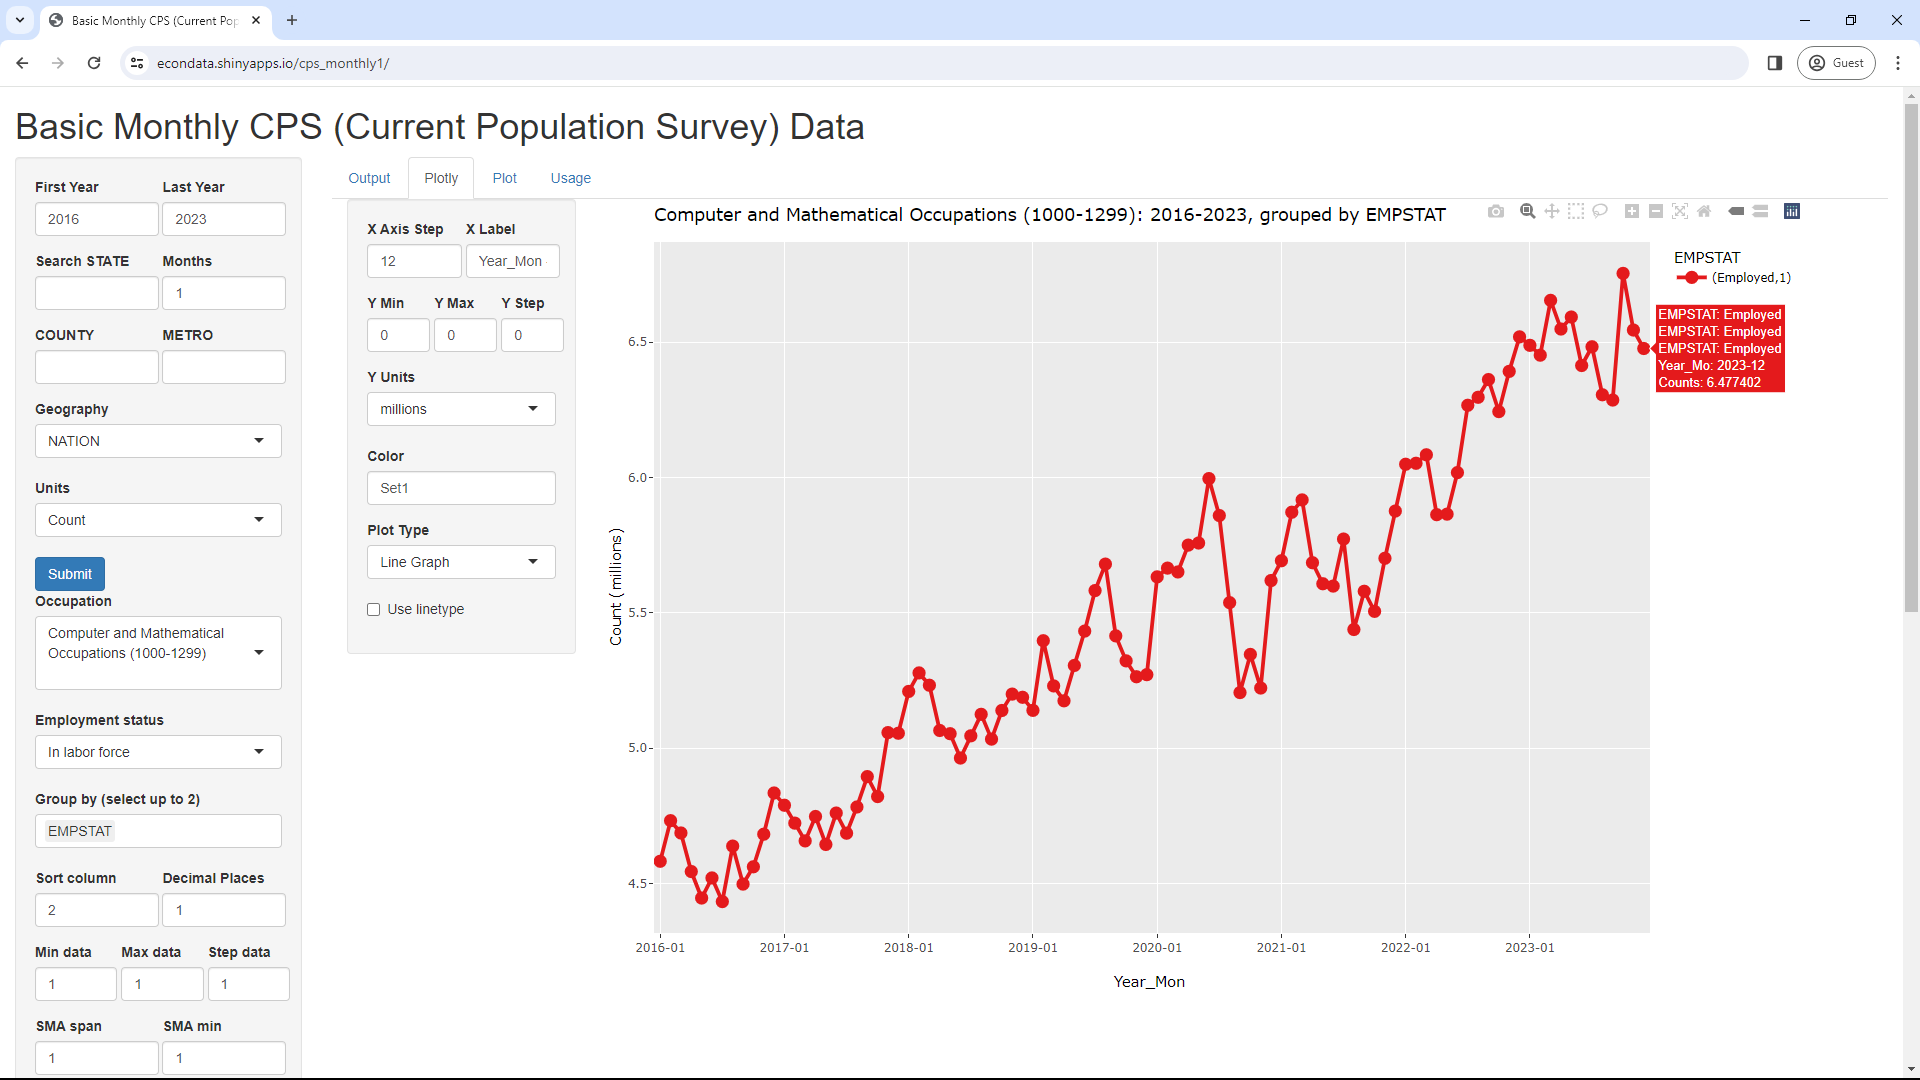
As can be seen, the graph looks very much like the graph of the same employment level after 2016 in the prior section. One minor difference is that the last employment level is about 6.477 million rather than 6.474 million as in the prior section. This is a tiny difference of less than 0.05 of one percent and its cause is not clear. It may a different version of the data or an adjustment was made in the either the BLS or the Basic Monthly CPS data that was not made in the other.
Clicking on the Output tab displays the following numbers:
   Year_Mo     Count  Employed
84 2022-12 6,656,960 6,520,399
85 2023-01 6,644,603 6,489,108
86 2023-02 6,627,229 6,452,778
87 2023-03 6,829,989 6,655,339
88 2023-04 6,736,841 6,549,372
89 2023-05 6,757,000 6,593,744
90 2023-06 6,593,056 6,414,532
91 2023-07 6,619,605 6,483,837
92 2023-08 6,498,621 6,306,422
93 2023-09 6,452,101 6,286,947
94 2023-10 6,904,636 6,754,889
95 2023-11 6,687,912 6,545,653
96 2023-12 6,653,484 6,477,402
As can be seen, the employed level for December 2022 is 6.520 million whereas it was 6.522 million in the graph in the prior section. This is just about 0.03 of one percent. Following are the numbers if Occupation is changed to "All Persons":
   Year_Mo       Count    Employed
12 2022-12 165,575,154 158,871,810
13 2023-01 166,321,735 158,691,547
14 2023-02 167,386,407 159,712,565
15 2023-03 168,034,184 160,740,630
16 2023-04 167,408,091 161,074,745
17 2023-05 167,745,649 161,002,386
18 2023-06 168,570,365 161,559,139
19 2023-07 169,208,439 161,981,640
20 2023-08 169,169,059 161,426,705
21 2023-09 169,232,062 161,669,304
22 2023-10 169,028,830 161,676,321
23 2023-11 169,045,818 162,149,298
24 2023-12 167,781,614 160,753,981
Interestingly, the numbers for December 2022 and December 2023 are identical to those shown at the top of this BLS webpage when rounded to the same number of decimal places. In any case, any differences seen are extremely small but may merit some investigation at some point.
Following are all of the steps to create the prior graph of the employment level of Computer and Mathematical Occupations since 2016:
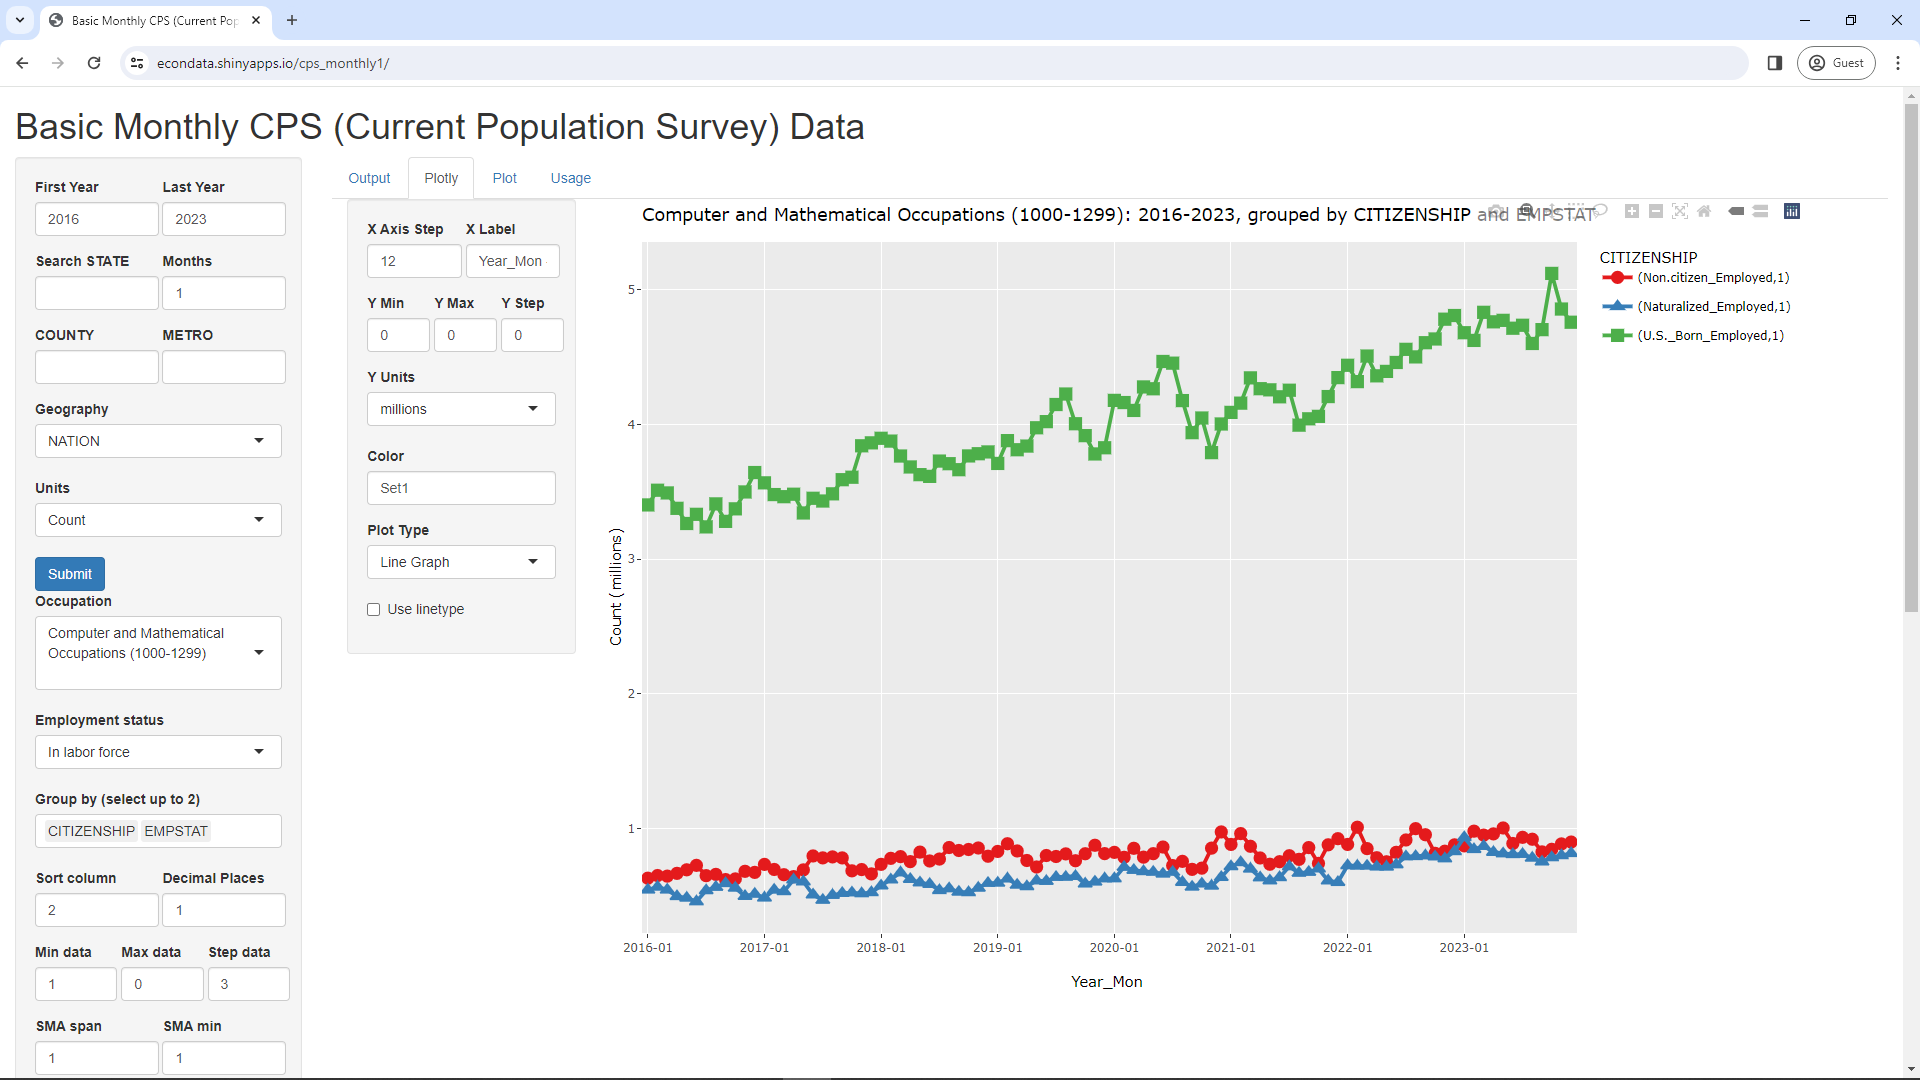
Clicking on the Output tab displays the following numbers:
   Year_Mo     Count Non.citizen_Employed Naturalized_Employed U.S._Born_Employed
72 2021-12 6,014,201            926,274.7            602,567.4          4,347,922
73 2022-01 6,171,013            883,471.3            726,904.1          4,439,315
74 2022-02 6,231,541          1,011,158.0            723,987.4          4,318,134
75 2022-03 6,190,190            852,617.4            724,153.3          4,507,854
76 2022-04 5,994,160            784,928.9            717,393.4          4,361,046
77 2022-05 6,028,435            754,705.0            716,668.9          4,393,933
78 2022-06 6,176,212            824,911.0            733,844.7          4,460,138
79 2022-07 6,400,912            916,615.5            793,392.9          4,557,609
80 2022-08 6,459,758          1,000,724.1            794,916.3          4,501,493
81 2022-09 6,538,924            955,560.6            800,155.0          4,606,894
82 2022-10 6,430,719            817,425.6            792,326.4          4,634,523
83 2022-11 6,598,960            833,239.7            778,327.1          4,781,336
84 2022-12 6,656,960            880,329.7            831,501.2          4,808,568
85 2023-01 6,644,603            872,869.9            935,270.4          4,680,968
86 2023-02 6,627,229            981,948.7            847,042.4          4,623,787
87 2023-03 6,829,989            952,630.4            870,339.0          4,832,370
88 2023-04 6,736,841            961,781.5            825,728.9          4,761,861
89 2023-05 6,757,000          1,005,657.7            815,305.4          4,772,781
90 2023-06 6,593,056            890,551.5            809,597.0          4,714,383
91 2023-07 6,619,605            936,327.8            811,161.0          4,736,348
92 2023-08 6,498,621            922,099.1            783,186.7          4,601,136
93 2023-09 6,452,101            828,136.8            754,921.8          4,703,888
94 2023-10 6,904,636            847,349.0            786,431.1          5,121,109
95 2023-11 6,687,912            887,348.7            801,516.0          4,856,788
96 2023-12 6,653,484            901,174.5            817,415.0          4,758,812
As can be seen from the graph and table, the number of naturalized and U.S. born workers with Computer and Mathematical Occupations went down slightly from December of 2022 to December of 2023. The number of non-citizen workers went up slightly but was down from two years ago, December of 2021.
The Data Dictionary for the Basic Monthly CPS data lists all of the items that are available in the data. For Computer and Mathematical Occupations, the following subsectors are listed:
Occupation
Code       SOC Code  Description
1005-1240   15-0000  Computer and mathematical occupations:

1005        15-1221  Computer and information research scientists
1006        15-1211  Computer systems analysts
1007        15-1212  Information security analysts
1010        15-1251  Computer programmers
1021        15-1252  Software developers
1022        15-1253  Software quality assurance analysts and testers
1031        15-1254  Web developers
1032        15-1255  Web and digital interface designers
1050        15-1230  Computer support specialists
1065        15-124X  Database administrators and architects
            Combines:
            15-1242  Database administrators
            15-1243  Database architects
1105        15-1244  Network and computer systems administrators
1106        15-1241  Computer network architects
1108        15-1299  Computer occupations, all other
1200        15-2011  Actuaries
1220        15-2031  Operations research analysts
1240        15-20XX  Other mathematical science occupations
            Combines:
            15-2021  1210 - Mathematicians
            15-2041  1230 - Statisticians
            15-20XX  1240 - Other mathematical science occupations
            Combines:
            15-2051  Data scientists
            15-2099  Mathematical science occupations, all other
The Occupation select list in the app contains the following selections that contain all or a portion of Computer and Mathematical Occupations:

Clicking on the Output tab displays the following numbers:
   Year_Mo     Count Non.citizen_Employed Naturalized_Employed U.S._Born_Employed
60 2020-12 2,660,555            712,102.5            329,630.8          1,515,711
61 2021-01 2,513,072            619,970.1            317,119.6          1,496,758
62 2021-02 2,602,837            675,026.7            360,157.4          1,488,981
63 2021-03 2,658,848            607,501.2            358,577.9          1,620,988
64 2021-04 2,555,271            545,518.4            335,194.3          1,616,384
65 2021-05 2,387,693            487,919.4            310,102.2          1,534,242
66 2021-06 2,479,368            543,825.7            313,044.3          1,572,308
67 2021-07 2,387,763            541,072.8            324,975.5          1,483,672
68 2021-08 2,374,704            552,392.8            302,649.5          1,498,209
69 2021-09 2,481,559            587,359.5            345,964.0          1,501,106
70 2021-10 2,515,738            493,862.9            331,040.8          1,591,946
71 2021-11 2,487,070            619,503.5            298,979.2          1,496,669
72 2021-12 2,668,146            635,009.5            311,088.6          1,673,073
73 2022-01 2,567,758            605,429.0            350,237.0          1,578,067
74 2022-02 2,604,944            687,355.5            382,354.9          1,476,125
75 2022-03 2,604,735            567,292.6            391,888.3          1,613,742
76 2022-04 2,500,781            509,923.4            346,536.8          1,606,565
77 2022-05 2,621,928            533,342.9            362,198.8          1,702,972
78 2022-06 2,737,220            561,454.6            375,234.1          1,763,049
79 2022-07 2,892,627            615,604.1            425,485.1          1,784,546
80 2022-08 2,791,703            675,509.8            403,184.4          1,650,090
81 2022-09 2,768,469            635,767.7            428,632.1          1,627,874
82 2022-10 2,660,024            523,952.4            426,921.5          1,644,353
83 2022-11 2,664,427            498,915.7            338,760.4          1,727,763
84 2022-12 2,707,109            512,593.7            446,845.3          1,686,365
85 2023-01 2,767,181            511,247.0            483,946.2          1,695,457
86 2023-02 2,690,038            603,179.5            411,419.4          1,572,597
87 2023-03 2,701,765            596,183.2            413,125.4          1,624,021
88 2023-04 2,653,668            593,474.0            370,276.1          1,599,705
89 2023-05 2,685,684            614,223.2            382,705.2          1,606,554
90 2023-06 2,765,277            569,060.9            363,298.0          1,738,431
91 2023-07 2,794,950            645,203.7            354,214.5          1,714,231
92 2023-08 2,713,468            622,913.4            342,072.1          1,640,773
93 2023-09 2,672,984            519,650.0            335,298.7          1,741,565
94 2023-10 2,682,651            528,545.1            306,147.1          1,776,722
95 2023-11 2,651,397            529,624.0            357,834.2          1,712,523
96 2023-12 2,551,922            522,674.8            367,152.0          1,584,402
As can be seen from the graph and table, the number of U.S. born workers with in this job category is below the level that it was two years ago in December of 2021. The number of non-citizen workers is down from from its level 3 years ago (in December of 2020) and the number of naturalized citizens is down from from its level one years ago (in December of 2022).
The data in the graph above has many short-term peaks and valleys which sometimes makes it difficult to see the long-term trend. These are likely partially due to the relatively small size of the sample size and partially due to the fact that the data is not seasonably adjusted. The small sample size can be addressed by looking at a simple moving average (SMA) over some span of time. Making that span 12 months also helps address the fact that the data is not seasonably adjusted. This can be done by setting "SMA span" to 12 and clicking Submit. That will display the following graph:
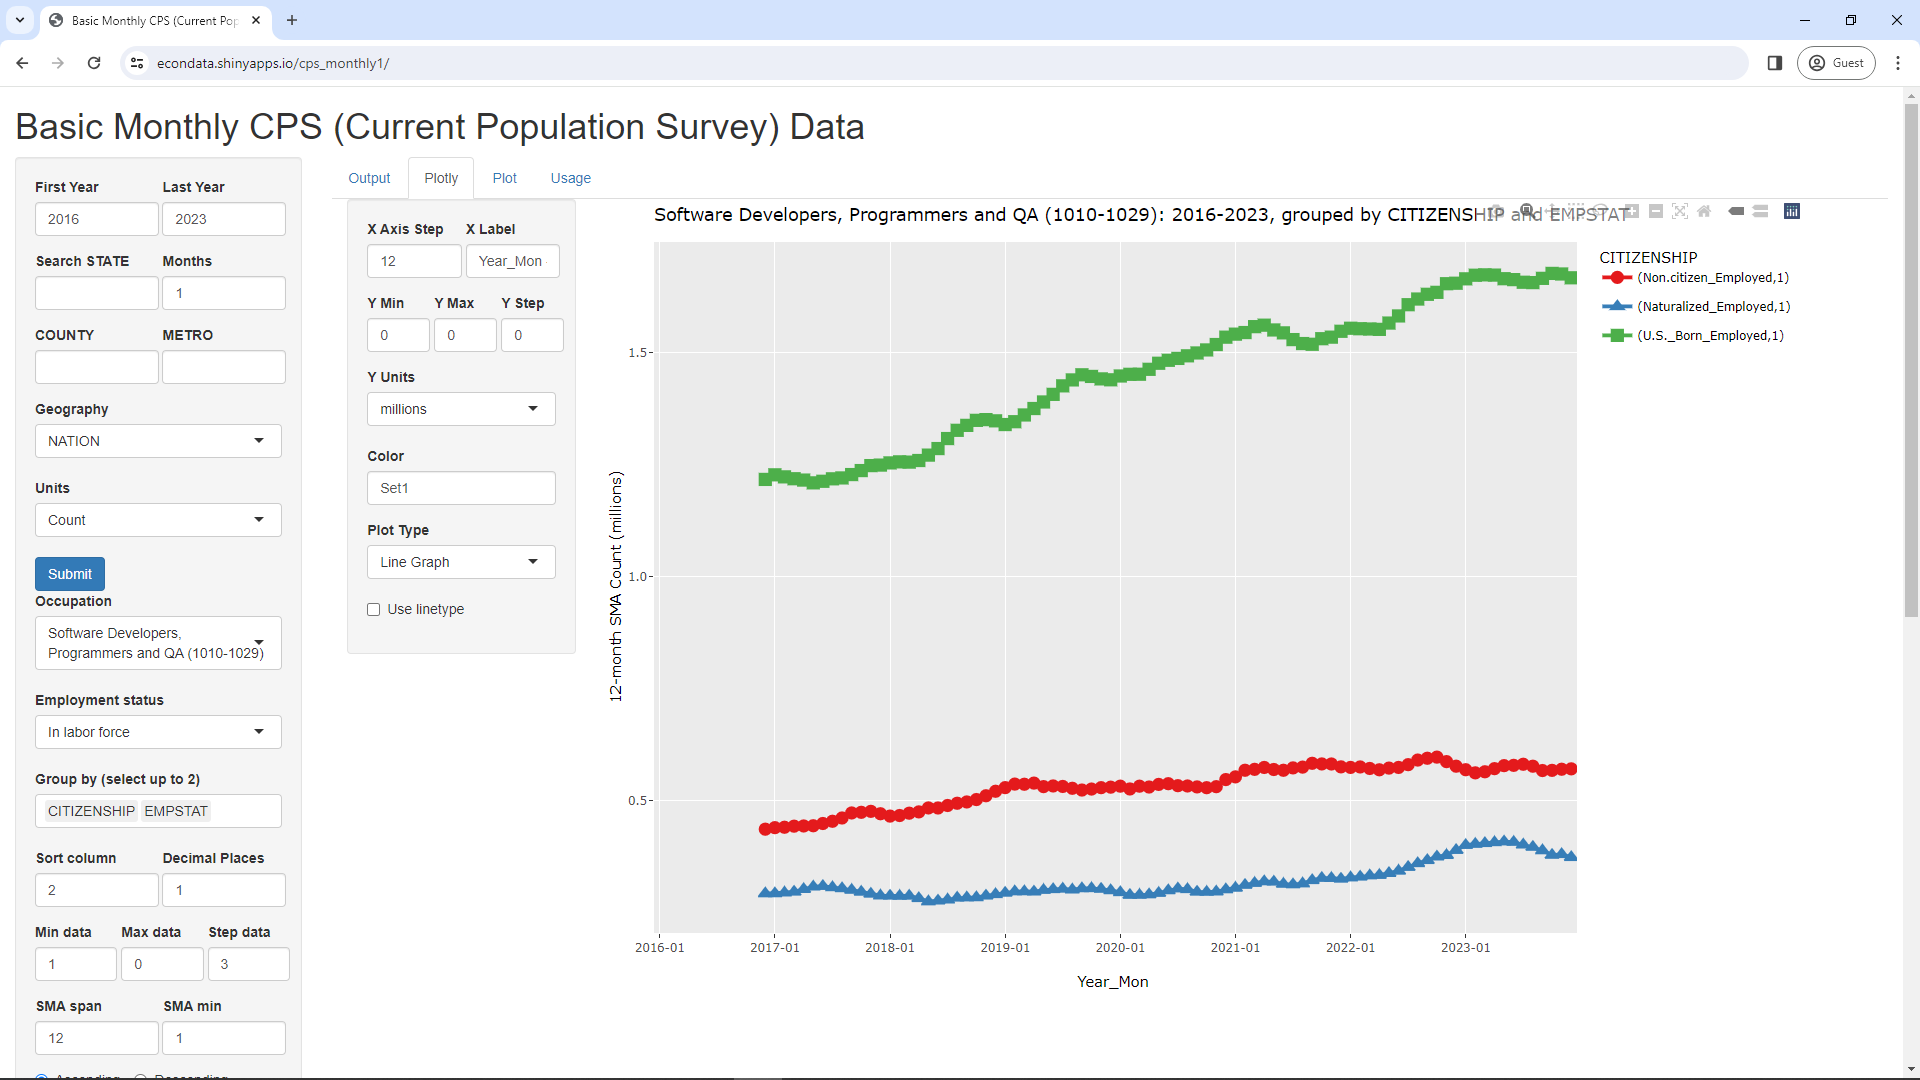
As can be seen, the 12-month trailing average of U.S. born developers has generally grown since December of 2016 but flattened somewhat in 2021 and 2023. The 12-month trailing average of nationalized developers flattened over 2023 and that of non-citizen developers appears to have been fairly flat for the last 3 years.
Repeating the steps at the beginning of this section which displayed the unemployment rate for "Computer and Mathematical Occupations" and then switching the Occupation to "Software Developers, Programmers and QA (1010-1029)" will display the following graph:
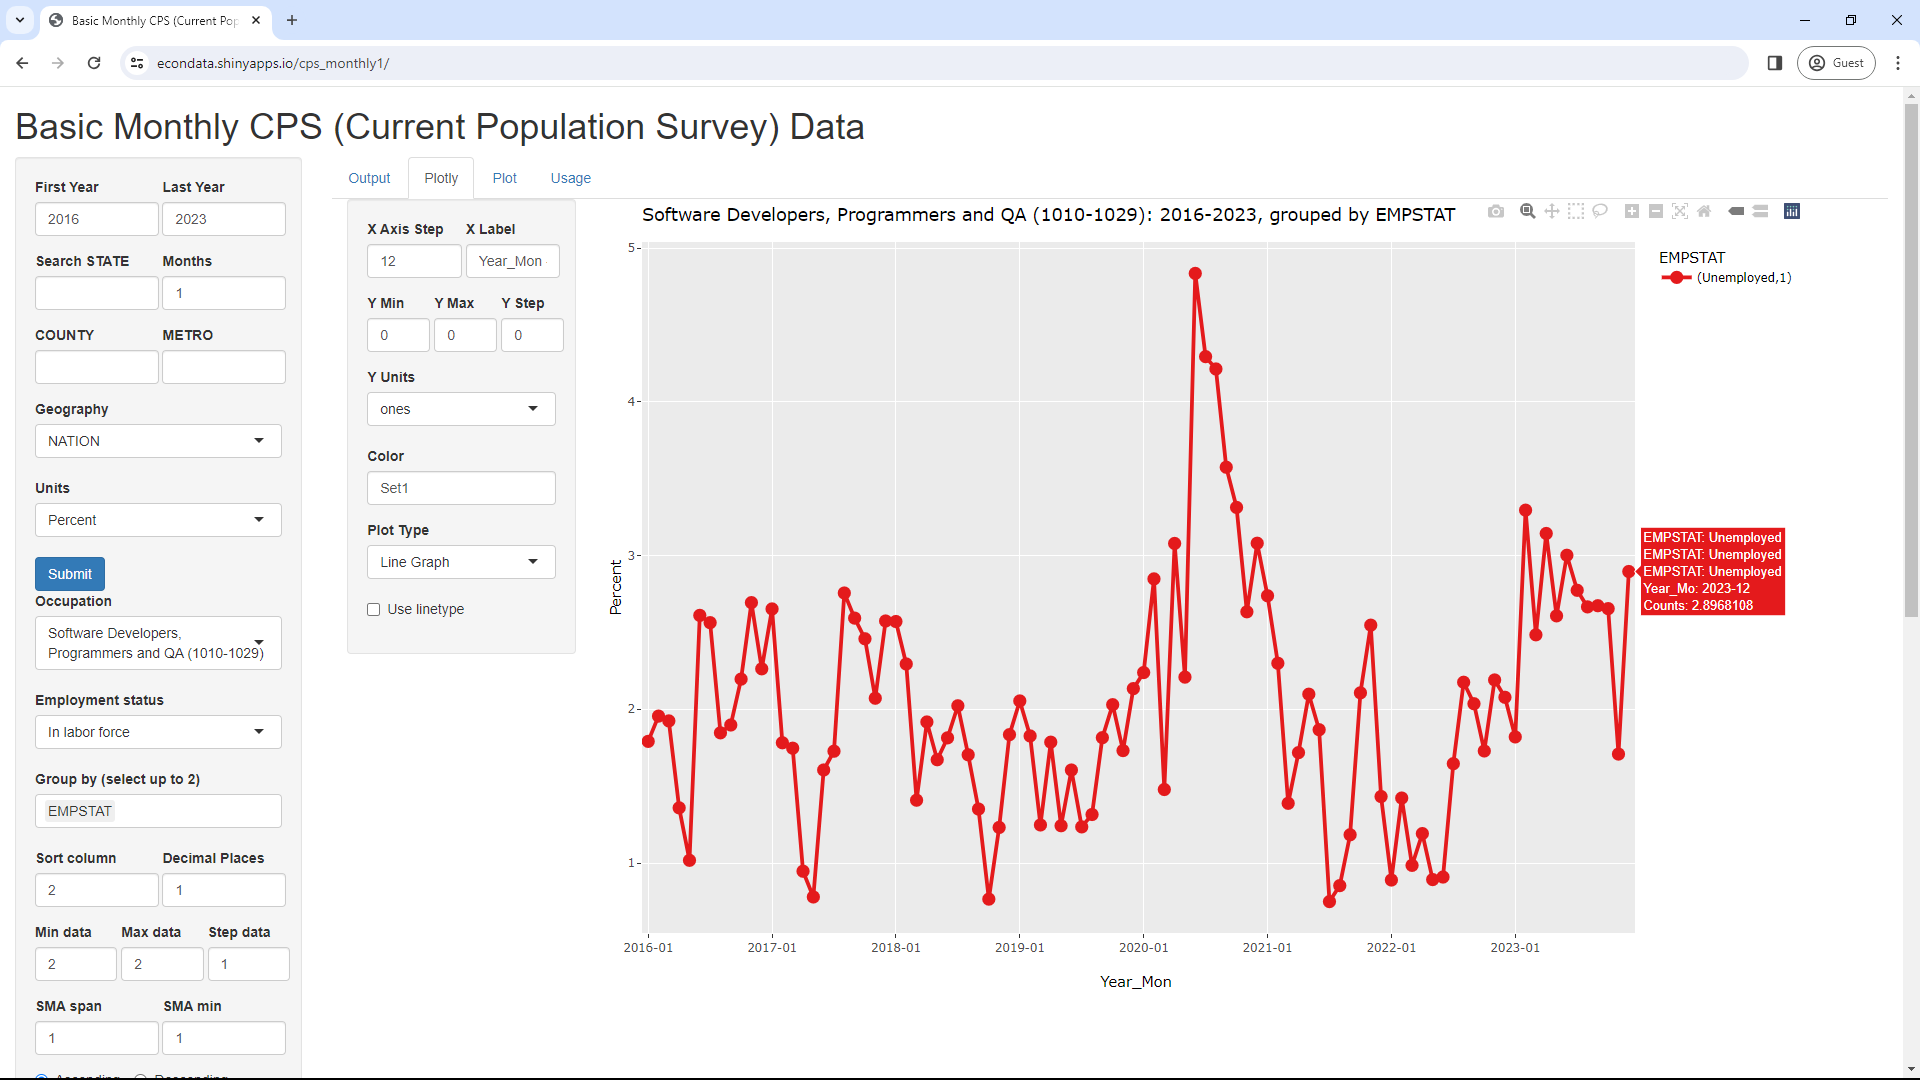
As can be seen, the unemployment rate for this job group appears to have risen over the past year from about 2 percent to about 3 percent, it's highest level since shortly after the COVID epidemic began. This provides some additional evidence that there has been pressure on this portion of the job market over the past year.
This graph can similarly be smoothed by setting "SMA span" to 12. That will display the following graph:
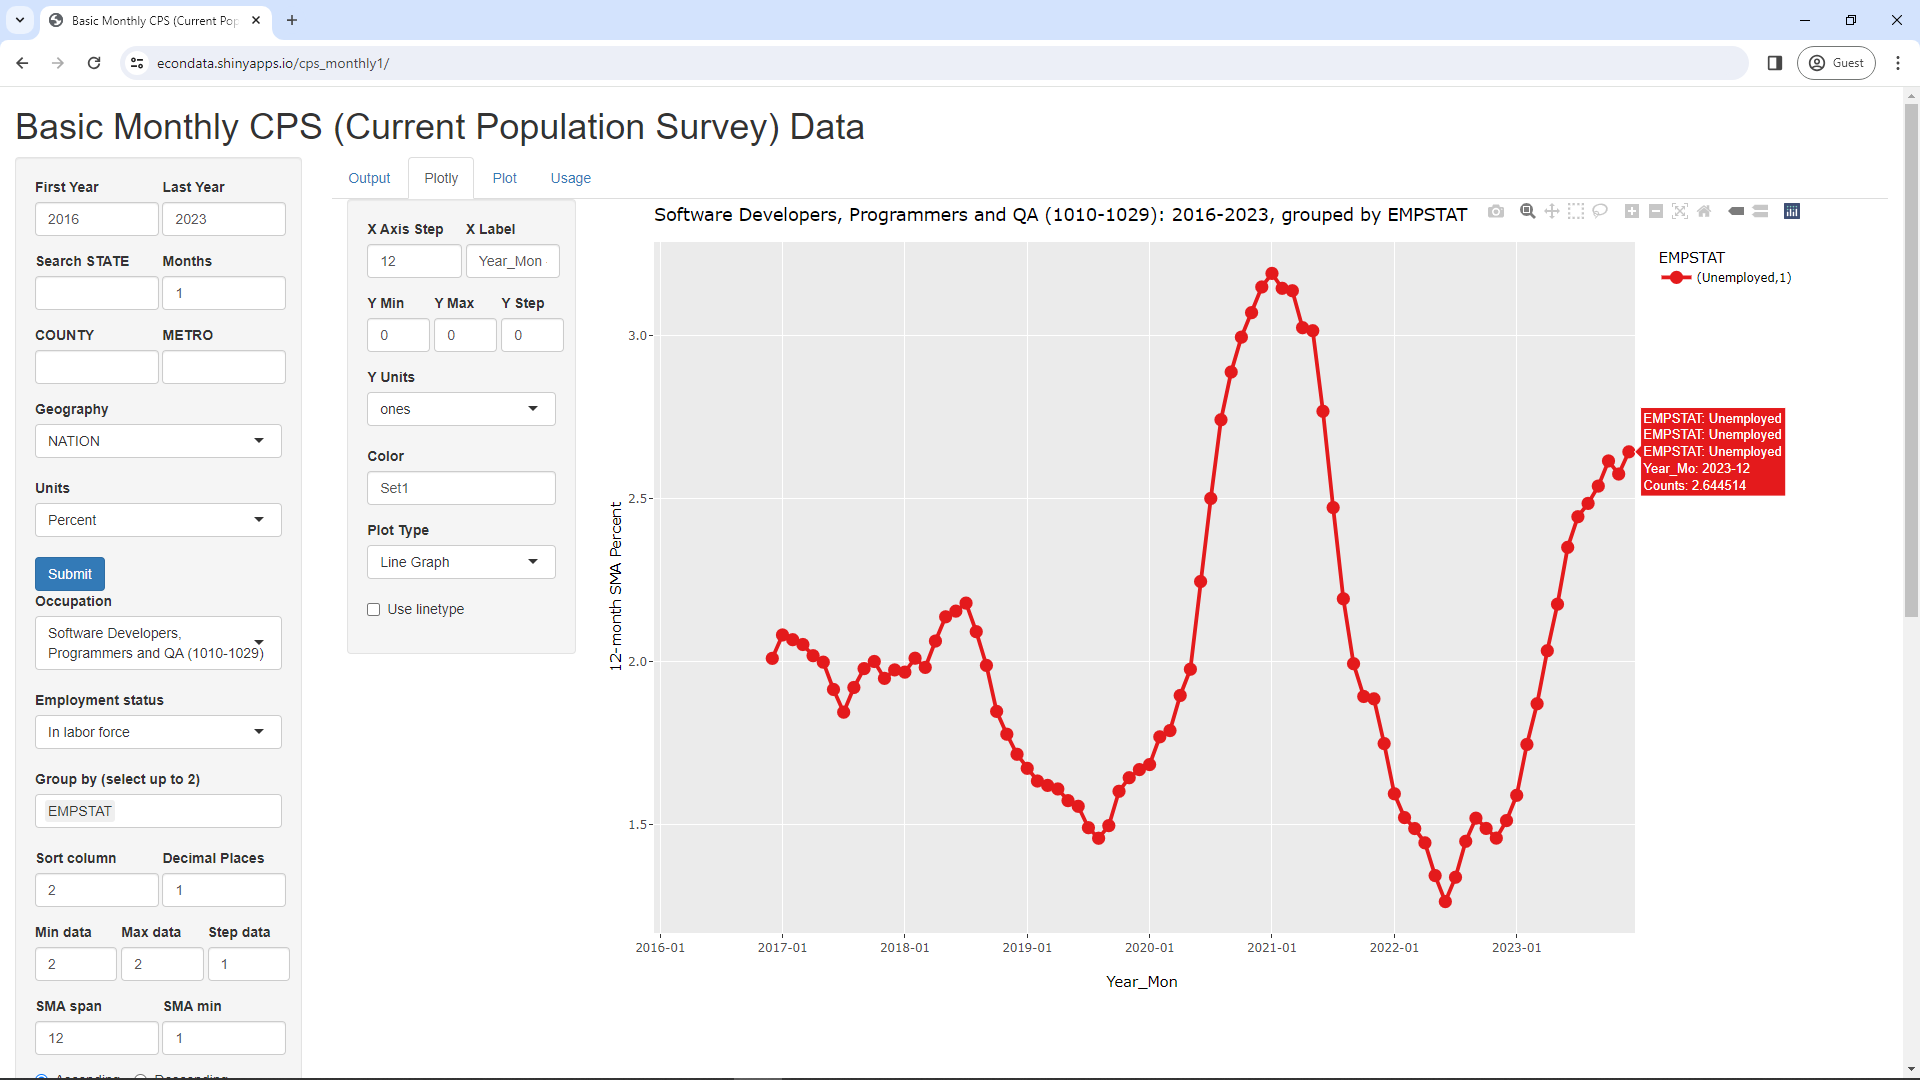
As can be seen, the 12-month trailing average of the unemployment rate for developers peaked st over 3 percent at the end of 2020, reached a low of under 1.3 percent in 2022 but is now over 2.6 percent.