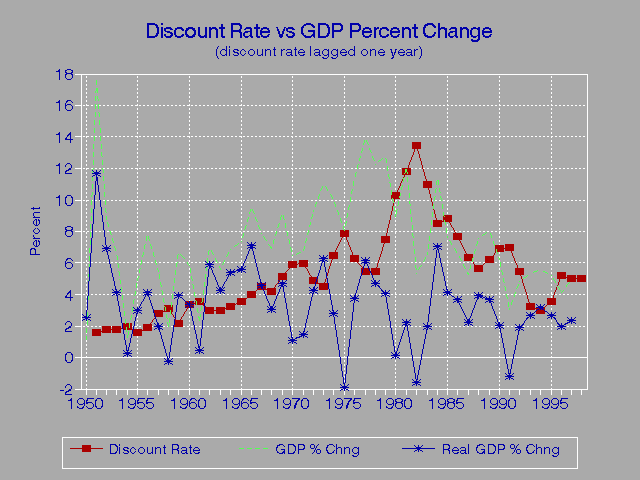
      DISCOUNT RATE VS. GDP PERCENT CHANGE: 1950-1997

       Discount                %     Real        %      GDP
 Date     Rate      GDP     Chng      GDP     Chng  Deflator
-----  --------  ------  -------  -------  -------  --------
 1949             269.5            1492.2            0.1806
 1950     1.59    272.6     1.15   1530.6     2.57   0.1781
 1951     1.75    321.0    17.75   1709.3    11.67   0.1878
 1952     1.75    349.2     8.79   1827.3     6.91   0.1911
 1953     1.99    372.4     6.64   1902.9     4.14   0.1957
 1954     1.60    377.1     1.26   1907.4     0.24   0.1977
 1955     1.89    395.5     4.88   1963.8     2.95   0.2014
 1956     2.77    426.6     7.86   2044.1     4.09   0.2087
 1957     3.12    449.9     5.46   2084.8     1.99   0.2158
 1958     2.16    458.8     1.98   2078.8    -0.29   0.2207
 1959     3.36    489.7     6.73   2160.1     3.91   0.2267
 1960     3.53    518.3     5.84   2233.1     3.38   0.2321
 1961     3.00    530.4     2.33   2243.7     0.47   0.2364
 1962     3.00    567.3     6.96   2375.6     5.88   0.2388
 1963     3.23    599.0     5.59   2477.3     4.28   0.2418
 1964     3.55    639.8     6.81   2611.4     5.42   0.2450
 1965     4.04    686.8     7.35   2757.1     5.58   0.2491
 1966     4.50    752.7     9.60   2952.9     7.10   0.2549
 1967     4.19    811.9     7.87   3087.1     4.54   0.2630
 1968     5.16    868.0     6.91   3181.8     3.07   0.2728
 1969     5.87    948.1     9.23   3330.2     4.66   0.2847
 1970     5.95   1009.4     6.47   3365.8     1.07   0.2999
 1971     4.88   1077.4     6.74   3413.8     1.43   0.3156
 1972     4.50   1177.0     9.24   3559.1     4.26   0.3307
 1973     6.44   1306.8    11.03   3783.4     6.30   0.3454
 1974     7.83   1438.1    10.05   3887.8     2.76   0.3699
 1975     6.25   1554.5     8.09   3813.8    -1.90   0.4076
 1976     5.50   1730.4    11.32   3956.1     3.73   0.4374
 1977     5.46   1971.4    13.93   4200.7     6.18   0.4693
 1978     7.46   2212.6    12.23   4397.9     4.69   0.5031
 1979    10.28   2495.9    12.80   4576.3     4.06   0.5454
 1980    11.77   2718.9     8.93   4582.7     0.14   0.5933
 1981    13.42   3049.1    12.14   4685.2     2.24   0.6508
 1982    11.02   3211.3     5.32   4608.6    -1.63   0.6968
 1983     8.50   3421.9     6.56   4699.8     1.98   0.7281
 1984     8.80   3812.0    11.40   5030.4     7.03   0.7578
 1985     7.69   4102.1     7.61   5239.0     4.15   0.7830
 1986     6.33   4374.3     6.64   5430.5     3.66   0.8055
 1987     5.66   4605.1     5.28   5553.0     2.25   0.8293
 1988     6.20   4953.5     7.57   5771.3     3.93   0.8583
 1989     6.92   5351.8     8.04   5982.3     3.66   0.8946
 1990     6.98   5684.5     6.22   6104.5     2.04   0.9312
 1991     5.45   5858.8     3.07   6031.3    -1.20   0.9714
 1992     3.25   6143.2     4.85   6143.2     1.86   1.0000
 1993     3.00   6470.8     5.33   6305.0     2.63   1.0263
 1994     3.60   6830.4     5.56   6504.5     3.16   1.0501
 1995     5.21   7186.9     5.22   6678.0     2.67   1.0762
 1996     5.02   7484.7     4.14   6810.5     1.98   1.0990
 1997     5.00   7853.8     4.93   6972.5     2.38   1.1264
------------------------------------------------------------
Source: http://www.stls.frb.org/fred/data/irates/mdiscrt,
        Federal Reserve Board; Budget of the United States
        Government, FY 1998, Historical Table 7.1
Note: discount rates are the averages of monthly figures
      which, in turn, are the averages of daily figures;
      discount rates are per calendar year, other figures
      are per fiscal year
Go to Budget Home Page
