What is "Drop-off"
On December 12, 2024, an organization named Smart Elections released a post on their substack titled Strange Numbers. In a section titled "What is "Drop-off", it states:
What we're presenting today is an analysis of what we call "drop-off."
We measure the difference between the votes for the President and the next down-ballot race, both in raw numbers and in percentages for each major party (Democrat and Republican).
The link at the top takes you to the spreadsheet with the summary data. That spreadsheet is drawn from individual state spreadsheets that we will be releasing shortly both here and on our website SMARTelections.us
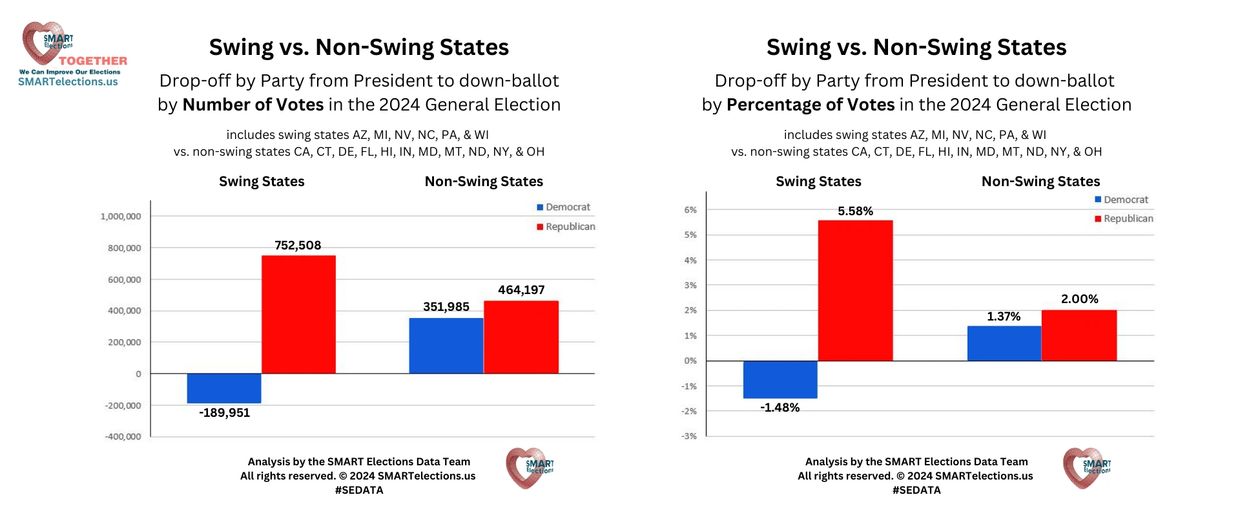
Smart Elections also has a page on their website with a section titled "Drop-Off analysis - 2024 ELECTION" which contains the following two plots:
The rightmost plot shows that, taking the swing states as a whole, Democrats had a negative drop-off and Republicans had an especially large positive drop-off. This means that Harris received fewer votes (1.48% fewer) than the Democratic candidate in the down-ballot race but that Trump received noticeably more votes (5.58% more) than the Republican candidate in the down-ballot race. Taking the non-swing states as a whole, however, both Harris and Trump received more votes than their party's down-ballot candidate, 1.37% more for Harris and 2.00% more from Trump. The down-ballot race was usually a Senate race but was occasionally Governor or Attorney General.
To verify this data, the table below compares election data obtained chiefly from the MIT Election Data and Science Lab for 2024 to the Smart Election data in their spreadsheet. The column DOV_Diff shows the differences in the drop-off votes and column DOP_Diff shows the differences in the drop-off percents.
Validating Smart Elections' Data
N   ElectionDate State Party US.President DownBallot DOVotes  DOV_SE DOV_Diff DOPercent  DOP_SE DOP_Diff          DB_Race SE.Group
--- ------------ ----- ----- ------------ ---------- ------- ------- -------- --------- ------- -------- ---------------- --------
4     2024/11/05    AZ   DEM      1582791    1676315  -93524  -93475      -49    -5.91%  -5.91%    0.00%        US SENATE        1
5     2024/11/05    CA   DEM      9269414    9029588  239826  237965     1861     2.59%   2.59%    0.00%        US SENATE        3
7     2024/11/05    CT   DEM       992053     953646   38407   -8612    47019     3.87%  -0.87%    4.74%        US SENATE        3
8     2024/11/05    DE   DEM       289758     279585   10173   10173        0     3.51%   3.51%    0.00%         GOVERNOR        3
9     2024/11/05    FL   DEM      4683038    4603077   79961   79961        0     1.71%   1.71%    0.00%        US SENATE        3
11    2024/11/05    HI   DEM       313044     324194  -11150  -11150        0    -3.56%  -3.56%    0.00%        US SENATE        3
15    2024/11/05    IN   DEM      1163603    1097061   66542   56542    10000     5.72%   4.90%    0.82%        US SENATE        3
19    2024/11/05    MA   DEM      2126518    2041668   84850      NA       NA     3.99%                         US SENATE        5
20    2024/11/05    MD   DEM      1902604    1650912  251692  251665       27    13.23%  13.23%    0.00%        US SENATE        3
21    2024/11/05    ME   DEM       430342      86464  343878      NA       NA    79.91%                         US SENATE        5
22    2024/11/05    MI   DEM      2736533    2712686   23847   23847        0     0.87%   0.87%    0.00%        US SENATE        1
23    2024/11/05    MN   DEM      1656979    1792441 -135462      NA       NA    -8.18%                         US SENATE        5
24    2024/11/05    MO   DEM      1200599    1243728  -43129      NA       NA    -3.59%                         US SENATE        5
25    2024/11/05    MS   DEM       466667     451980   14687      NA       NA     3.15%                         US SENATE        5
26    2024/11/05    MT   DEM       231856     276252  -44396  -44396        0   -19.15% -19.15%    0.00%        US SENATE        3
27    2024/11/05    NC   DEM      2714494    2874059 -159565 -158677     -888    -5.88%  -5.84%   -0.04% ATTORNEY GENERAL        1
28    2024/11/05    ND   DEM       112327     121602   -9275   -9275        0    -8.26%  -8.26%    0.00%        US SENATE        3
29    2024/11/05    NE   DEM       369995     436493  -66498      NA       NA   -17.97%                         US SENATE        5
30    2024/11/05    NH   DEM       418488     360149   58339      NA       NA    13.94%                          GOVERNOR        5
31    2024/11/05    NJ   DEM      2220713    2161491   59222      NA       NA     2.67%                         US SENATE        5
32    2024/11/05    NM   DEM       478802     497333  -18531      NA       NA    -3.87%                         US SENATE        5
33    2024/11/05    NV   DEM       705057     700976    4081    4092      -11     0.58%   0.58%    0.00%        US SENATE        1
34    2024/11/05    NY   DEM      4619543    4711669  -92126  -93638     1512    -1.99%  -2.13%    0.14%        US SENATE        3
35    2024/11/05    OH   DEM      2533699    2650949 -117250 -117250        0    -4.63%  -4.63%    0.00%        US SENATE        3
37    2024/11/05    OR   DEM      1236213    1153287   82926      NA       NA     6.71%                  ATTORNEY GENERAL        5
38    2024/11/05    PA   DEM      3420865    3382144   38721   38810      -89     1.13%   1.13%    0.00%        US SENATE        1
39    2024/11/05    RI   DEM       285156     294665   -9509      NA       NA    -3.33%                         US SENATE        5
42    2024/11/05    TN   DEM      1056265    1027461   28804      NA       NA     2.73%                         US SENATE        5
43    2024/11/05    TX   DEM      4835134    5031142 -196008      NA       NA    -4.05%                         US SENATE        5
44    2024/11/05    UT   DEM       562382     464368   98014      NA       NA    17.43%                         US SENATE        5
45    2024/11/05    VA   DEM      2335395    2417115  -81720      NA       NA    -3.50%                         US SENATE        5
46    2024/11/05    VT   DEM       235791         NA      NA      NA       NA                                   US SENATE        5
47    2024/11/05    WA   DEM      2243401    2251055   -7654      NA       NA    -0.34%                         US SENATE        5
48    2024/11/05    WI   DEM      1668229    1672777   -4548   -4548        0    -0.27%  -0.27%    0.00%        US SENATE        1
49    2024/11/05    WV   DEM       214309     207548    6761      NA       NA     3.15%                         US SENATE        5
50    2024/11/05    WY   DEM        69527      63727    5800      NA       NA     8.34%                         US SENATE        5
54    2024/11/05    AZ   REP      1770209    1595731  174478  174481       -3     9.86%   9.86%    0.00%        US SENATE        1
55    2024/11/05    CA   REP      6071718    6302653 -230935 -236519     5584    -3.80%  -3.95%    0.15%        US SENATE        3
57    2024/11/05    CT   REP       736918     678256   58662   59065     -403     7.96%   8.02%   -0.06%        US SENATE        3
58    2024/11/05    DE   REP       214351     219050   -4699   -4699        0    -2.19%  -2.19%    0.00%         GOVERNOR        3
59    2024/11/05    FL   REP      6110126    5977707  132419  132419        0     2.17%   2.17%    0.00%        US SENATE        3
61    2024/11/05    HI   REP       193661     160075   33586   33586        0    17.34%  17.34%    0.00%        US SENATE        3
65    2024/11/05    IN   REP      1720347    1659416   60931   60931        0     3.54%   3.54%    0.00%        US SENATE        3
69    2024/11/05    MA   REP      1251303    1365440 -114137      NA       NA    -9.12%                         US SENATE        5
70    2024/11/05    MD   REP      1035655    1294344 -258689 -258794      105   -24.98% -24.99%    0.01%        US SENATE        3
71    2024/11/05    ME   REP       376991     283638   93353      NA       NA    24.76%                         US SENATE        5
72    2024/11/05    MI   REP      2816636    2693680  122956  122956        0     4.37%   4.37%    0.00%        US SENATE        1
73    2024/11/05    MN   REP      1519032    1291712  227320      NA       NA    14.96%                         US SENATE        5
74    2024/11/05    MO   REP      1751986    1651907  100079      NA       NA     5.71%                         US SENATE        5
75    2024/11/05    MS   REP       747744     763420  -15676      NA       NA    -2.10%                         US SENATE        5
76    2024/11/05    MT   REP       352001     319618   32383   32383        0     9.20%   9.20%    0.00%        US SENATE        3
77    2024/11/05    NC   REP      2898099    2715157  182942  183272     -330     6.31%   6.32%   -0.01% ATTORNEY GENERAL        1
78    2024/11/05    ND   REP       246505     241569    4936    4936        0     2.00%   2.00%    0.00%        US SENATE        3
79    2024/11/05    NE   REP       564816     499124   65692      NA       NA    11.63%                         US SENATE        5
80    2024/11/05    NH   REP       395523     436122  -40599      NA       NA   -10.26%                          GOVERNOR        5
81    2024/11/05    NJ   REP      1968215    1773589  194626      NA       NA     9.89%                         US SENATE        5
82    2024/11/05    NM   REP       423391     405978   17413      NA       NA     4.11%                         US SENATE        5
83    2024/11/05    NV   REP       750963     676852   74111   74159      -48     9.87%   9.87%    0.00%        US SENATE        1
84    2024/11/05    NY   REP      3579519    3246690  332829  318156    14673     9.30%   9.18%    0.12%        US SENATE        3
85    2024/11/05    OH   REP      3180116    2857383  322733  322733        0    10.15%  10.15%    0.00%        US SENATE        3
87    2024/11/05    OR   REP       912891     961343  -48452      NA       NA    -5.31%                  ATTORNEY GENERAL        5
88    2024/11/05    PA   REP      3543041    3399054  143987  144010      -23     4.06%   4.07%   -0.01%        US SENATE        1
89    2024/11/05    RI   REP       214406     196039   18367      NA       NA                                   US SENATE        5
92    2024/11/05    TN   REP      1966865    1918743   48122      NA       NA                                   US SENATE        5
93    2024/11/05    TX   REP      6393403    5990637  402766      NA       NA                                   US SENATE        5
94    2024/11/05    UT   REP       883417     914298  -30881      NA       NA                                   US SENATE        5
95    2024/11/05    VA   REP      2075085    2019911   55174      NA       NA                                   US SENATE        5
96    2024/11/05    VT   REP       119395     116512    2883      NA       NA                                   US SENATE        5
97    2024/11/05    WA   REP      1528208    1547135  -18927      NA       NA                                   US SENATE        5
98    2024/11/05    WI   REP      1697626    1643996   53630   53630        0     3.16%   3.16%    0.00%        US SENATE        1
99    2024/11/05    WV   REP       533556     514079   19477      NA       NA                                   US SENATE        5
100   2024/11/05    WY   REP       192633     198418   -5785      NA       NA                                   US SENATE        5
As can be seen, the only percent differences greater than 0.15 percent are 4.74 percent for the Democratic drop-off for Connecticut (CT) and 0.82 for the Democratic drop-off for Indiana (IN). Both of those are shown in red in the table above. The latter error seems to be an error of 10,000 votes in the Smart Elections numbers. The problem appears to be that their spreadsheet lists 1,153,603 for Harris in Indiana but the OFFICIAL 2024 PRESIDENTIAL GENERAL ELECTION RESULTS lists 1,163,603, exactly 10,000 more.
The larger error in Connecticut is interesting. The numbers above of 992,053 and 736,918 for the Democratic and Republican votes in the Presidential election exactly match the OFFICIAL 2024 PRESIDENTIAL GENERAL ELECTION RESULTS. The Smart Elections numbers of 990,946 and 736,559 are just 0.1116% and 0.0487% smaller.
In the Senate race, Wikipedia, NBC News and Fox News all agree that the votes were 1,000,695 for the Democrat and 678,256 for the Republican. The Smart Elections numbers of 999,558 and 677,494 are just 0.1136% and 0.1123% smaller. However, the numbers above from MIT of 953,646 and 678,256 are about 4.7 percent smaller for the Democrat and exactly the same for the Republican. The main page for 2024 MIT data gives the source of the Connecticut numbers to be https://ctemspublic.tgstg.net/#/selectTown. Going to this page and setting 'Select Election' to '11/05/2024 - Presidential Election 2024' (and selecting the Summary tab if necessary) shows the Democrat and Republican numbers to be 953,646 and 678,256 for United States Senator. Hence, even though this page is labelled "Connecticut Secretary of State" and "Official Results", the Democratic number of Senator appears to be about 4.7% off. That is, it appears that the "official results" listed here are in error. Similarly, it is possible that the Indiana error was not an error with Smart Election's quoting of its source but with their source itself.
Smart Elections' spreadsheet lists the percentage of drop-off by state & party in the rightmost set of three columns. Those percentages are shown in column DOP_SE below. Also in the tables below are the percentage of drop-off calculated from the MIT data (column DOPercent) and the difference between that and the Smart Election calculations (column DOP_Diff). As can be seen, there is very little difference between the Smart Election calculations and MIT calculations. As previously explained, the largest difference of 0.21% appears to be largely due to an error in the source for the MIT data for Connecticut.
A "swing state" is defined at this link as follows:
A "swing state" - also referred to as a "battleground state," "toss-up state," or "purple state" - is a state that can be potentially won by (or "swing" to) either the Democratic or Republican presidential candidate, depending on the election. Swing states are usually won by a small margin of votes and could "swing" to a different party than in the previous election.
Smart Elections' analysis of the drop-off in swing states versus non-swing states implies that there is some relationship between drop-off and vote margin. To better judge any possible relationship, the following charts plot the drop-off verus the vote margin by state for the Democratic and Republican presidential candidates in 2024 (top row) and 2020 (bottom row). Any of the charts can be expanded by clicking the "Expand" button near the upper right corner of the chart and the 2 by 2 grid of charts can be returned to by clicking the "Return to grid" button near the upper right corner of the expanded chart.
As can be seen in the top-left chart, the drop-offs for Democratic candidates appear to bow down into negative values near a vote margin of zero. The maximum vote margin of a swing state is not explicitly defined but is often take to be from about 3 to 5 percent. In the chart, the states with small positive margins (up to 6 percent) are Arizona (AZ), Michigan (MI), North Carolina (NC), Nevada (NV), Pennsylvania (PA), and Wisconsin (WI). These are 6 of what were commonly considered the 7 swing states in 2024. The other state, Georgia (GA), does not appear because it had no appropriate down-ballot race. Hence, all 7 swing states went to Trump. There are 5 states that were won by Harris by less than 6 percent but those were not commonly thought of as swing states. Those states were Minnesota (MN), New Hampshire (NH), New Jersey (NJ), New Mexico (NM), and Virginia (VA). Of the 6 swing states, 3 had drop-offs below zero and the other 3 had drop-off below 1.14 percent. And, as mentioned, the drop-off of the states appear to bow with the bottom of the bow around a vote margin of zero.
In contrast, the drop-offs for Republican candidates in the top-right chart appear to bow up into higher postive values near a vote margin of zero. The six swing states have drop-offs ranging from just over 3 for Wisconsin to nearly 10 for Arizona and Nevada. These drop-offs are higher than the historical drop-off from a Presidential race to a corresponding Senate race since 2000, shown in a table in this analysis to have been 2.4 percent. It should be noted that the down-ballot race for North Carolina was the Attorney General race as there was no Senate race in North Carolina in 2024.
In contrast to the charts for 2024, the charts for the drop-offs for Democratic candidates (bottom-left chart) and Republican candidates (bottom-right chart) do not show any noticeable bowing near vote margins of zero. Their distribution appears to be relatively stable around an average of about 2 percent for all possible vote margins. The most noticeable exception might be somewhat higher drop-offs for Democratic candidates in heavily Republican states like Louisiana (LA), North Dakota (ND), Tennessee (TN), Utah (UT), and West Virginia (WV). The table in this analysis lists the average drop-off from a Presidential race to a corresponding Senate race in 2020 to have been 1.4 percent. This would seem to suggest that there may have been something going on in the swing states in 2024 to advantage Trump and/or disadvantage the Democratic Presidential candidate that did not occur, at least to the same degree, in 2020.
The following maps show the drop-off by county in the 2024 and 2020 General Elections. One of the most obvious things in the top maps is that the left (Democratic) map is generally redder than the right (Republican) map. This indicates that the drop-off in Democratic counties in 2024 was generally negative in Democratic counties and positive in Republican counties, especially in swing states. This trend can also be seen in the bottom maps for the 2020 General Election but less so.
The the plots above and the maps below are drawn with Plotly which allows the user to hover the mouse over a county and get a pop-up window that shows a number of values including the state, county, down-ballot race, total votes, and drop-off (as % VOTES). Also, there are Plotly controls above the upper-right corner of the plot that allow the user to download a PNG image, pan across, and zoom in on an image, amoung other functions.
One problem with looking at drop-off by party is that it can be affected by the relative popularity of the candidates. This seems to often occur with moderate Democratic candidates in red states and moderate Republican candidates in blue states. For example, the top left map above shows Montana and Nebraska to be dark red. The negative drop-off in the red state of Montana is likely affected by the popularity of the Democratic Senate candidate Jon Tester who Wikipedia describes at a "moderate Democrat" and says that a New York Times profile described him as "truly your grandfather's Democrat—a pro-gun, anti-big-business prairie pragmatist whose life is defined by the treeless patch of hard Montana dirt that has been in the family since 1916". Similarly, the negative drop-off in Nebraska is likely affected by the relative popularity of the Independent Senate candidate Dan Osborn who, according to Wikipedia "drew attention for his unorthodox, populist platform and his unusually high-level support as a moderate independent candidate in what is usually a strongly Republican state." In contrast, the negative drop-off of the blue state of Maryland shown in the upper-right map is likely affected by the popularity of Larry Hogan, who Wikipedia said was lebeled by media outlets as a "moderate Republican and pragmatist".
Drop-off can also be affected by a strong third party candidate or a missing primary party candidate. For example, dark green color of Maine in the top two maps above are highly affected by the relative weakness of the down-ballot candidates for both parties. This was the 2024 Senate race in Maine which was won by Independent Angus King over much weaker Republican and Democratic candidates. The fact that Vermont is colored in the upper right Republican map but missing in the upper left Democratic map is due to the 2024 Senate race in Vermont being won by Independent Bernie Sanders but having no Democratic candidated.
Similar to the 2024 Vermont Senate race, the 2020 Arkansas Senate race and 2020 Vermont Governor race had no Democratic candidates. Hence, both of those states are missing in the lower left Democratic map for 2020 above. The missing Democratic candidates for Arkansss (AR) and Vermont (VT) can be seen in the lower right bar chart below. Similarly, the upper right bar chart above show a strong third party candidate for Maine (ME) and missing Democratic candidate for Vermont (VT).
Looking at the drop-off in total votes avoids the problem of the drop-off being affected by the relative popularity of the candidates. By looking at ALL of the candidates, only the popularity of the office itself could be said to affect the drop-off. The maps below show the drop-off of the total votes for President to the total votes for the down-ballot race by county. As can be seen, the drop-off is a small positive number in most counties as would be expected. Strangely, most of the counties in Montana and a few others (like Union County in Oregon) in the top map for 2024 are light red, indicating a negative drop-off. This means that, in these counties, more voters voted in the down-ballot race than in the Presidential race on net. This would seem to be a strange thing to happen unless the county had very few votes. If CVRs (cast vote records) can be obtained for any of these counties, it would be interesting to see how many of the ballots which contain a vote for the down-ballot race but not for the Presidential race were "bullet ballots". Those are ballots that contain only one vote, the vote for the down-ballot race. It might also be worth seeing if there is a problem with a badly designed ballot or something else to explain the negative drop-off.
It might similarly be worth looking at the counties that have exceptionally high drop-offs to see if much of that is due to "bullet ballots" for President or a ballot design issue. For the map below for 2024, that might include some of the counties along the southern border of Texas (especially Starr and Zapata County) and some of the darker counties in Indiana.
In the map below for 2020, most of the counties in Montana are light red, just as they were in 2024. However, most counties in South Carolina and many counties in Alabama, Kentucky, and South Dakota are light red indicating negative drop-offs. Starr and Zapata counties have higher than usual drop-offs of nearly 13 and 16 percent. High drop-offs can also be found in several other Texas counties (Duval, Kenedy, and Culberson Counties and Uintah County in Utah and some others. It might be likewise useful to look for the role of "bullet ballots" in these counties, if possible, or the roll of ballot design or other factors.
Validating Smart Elections' Calculations
                  SWING STATES (MINUS GA)

ElectionDate  Party  US President  DownBallot    DOVotes  DOPercent  DOP_SE  DOP_Diff
------------  -----  ------------  ----------  ---------  ---------  ------  --------
  2024/11/05    DEM    12,827,969  13,018,957   -190,988     -1.49%  -1.48%     0.01%
  2024/11/05    REP    13,476,574  12,724,470    752,104      5.58%  -5.58%     0.00%

                  NON-SWING STATES (SMART ELECTIONS)

ElectionDate  Party  US President  DownBallot    DOVotes  DOPercent  DOP_SE  DOP_Diff
------------  -----  ------------  ----------  ---------  ---------  ------  --------
  2024/11/05    DEM    26,110,939  25,698,535    412,404      1.58%   1.37%     0.21%
  2024/11/05    REP    23,440,917  22,956,761    484,156      2.07%   2.00%     0.07%

                  NON-SWING STATES (ALL)

ElectionDate  Party  US President  DownBallot    DOVotes  DOPercent  DOP_SE  DOP_Diff
------------  -----  ------------  ----------  ---------  ---------  ------  --------
  2024/11/05    DEM    49,728,926  47,680,650  2,048,276      4.12%      NA        NA
  2024/11/05    REP    47,259,777  45,804,806  1,454,971      3.08%      NA        NA
The last table titled "NON-SWING STATES (ALL)" shows the drop-offs if all non-swing states are included, not just the 10 included in the Smart Elections calculations.
Plotting Drop-off versus Vote Margin
Mapping Drop-off by County
Effect of Strong Third Party or Absent Primary Party Candidate
Mapping Drop-off in Total Votes
2024 U.S. Election