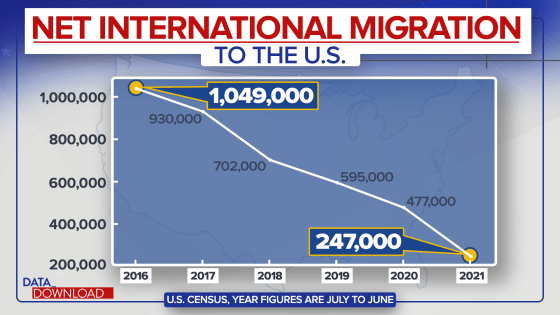
Chuck Dodd introduces the above graph with the following:
Look at this, over the last six years, net international migration into the United States, we were at a million in 2016. And as you know, immigration got heavily politicized, right, over this six-year period. And look what it's dribbled down to, 247,000 through mid-year 2021.
The following graph is from an article on the U.S. Census site.
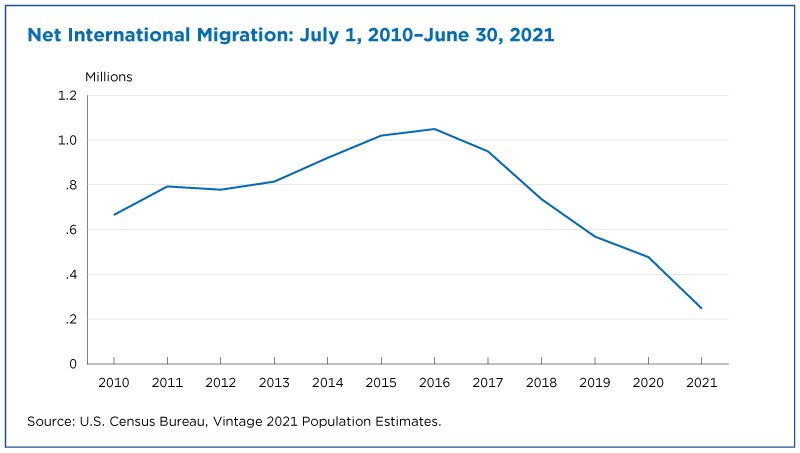
As can be seen, the span of the NBC graph was chosen to begin at the precise maximum of Net International Migration. The U.S. Census article also contains the following chart:
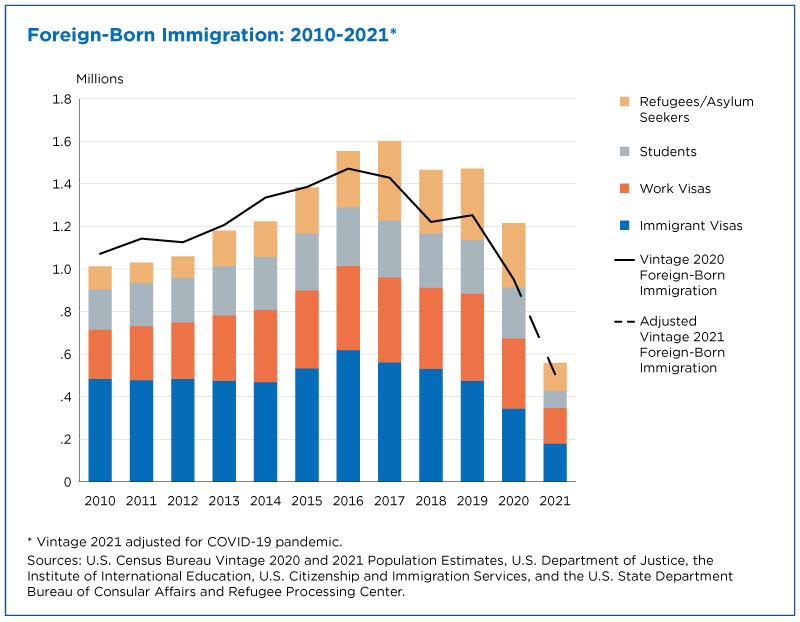
As can be seen, the majority of the pre-COVID drop in immigration was in Immigrant Visas, not Work Visas. In fact, the chart shows the the number of work visas grew sharply from 2010 to 2016 and did not sink back to its 2010 level until 2021, well into COVID.
Getting back to the NBC segment, Chuck Dodd then references the following chart:
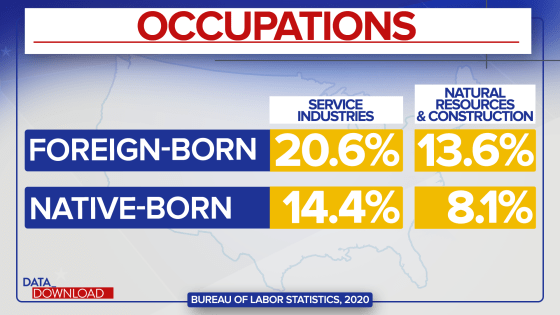
Dodd introduces this chart as follows:
Well, foreign-born workers are - work more often in the service industry than native-born workers. Also in natural resources and construction work. More foreign-born workers work there than native-born.
Dodd is making the mistake of suggesting that a higher percentage of foreign-born workers means "[m]ore foreign-born workers work there than native-born". The numbers in the chart can be seen in Table 4 of this release from the Bureau of Labor Statistics. If you multiply the percentages by the "Total employed (in thousands)" in the top line, you get 5.11 million (20.6 * 24,809 / 100,000) and 17.71 million (14.4 * 122,986 / 100,000) foreign-born and native-born workers in the Service Industries, respectively. In the Natural Resource & Construction sector, you get 3.37 million (13.6 * 24,809 / 100,000) and 9.96 million (8.1 * 122,986 / 100,000) foreign-born and native-born workers, respectively.
Next, Chuck Dodd references the following chart:

In introducing it, he says the following:
Then you can talk about the cost. Right? We've heard plenty of companies say, "Well, rising wages mean rising cost." Well, native-born Americans do make more money. Foreign-born workers here, first generation immigrants, first job, they make less.
This sounds like Dodd is arguing against rising wages or, at least, that the wages of native-born workers are rising too fast. In any case, this argument makes the mistake of assuming that foreign-born workers are making less than native-workers for the same job. These numbers do match the numbers in Table 5 on the Bureau of Labor Statistics site for all workers, 16 years or over in 2020. However, looking at the numbers broken down by "Race and Hispanic or Latino Ethnicity" reveals that this lower wage applies only to "Hispanic or Latino ethnicity". The foreign-born of White, Black, and Asian non-Hispanic or Latino all make MORE than native-born workers. Hence, Dodd's argument would suggest that we should only promote Hispanic or Latino immigration and suppress all others, at least if our concern is labor costs. The truth is, much of the difference in median wages is likely due to those groups working at different categories of jobs.
In any event, there has been no slow down in temporary worker visas since 2016. The following graph comes from a 2020 research paper from the Dallas Fed:
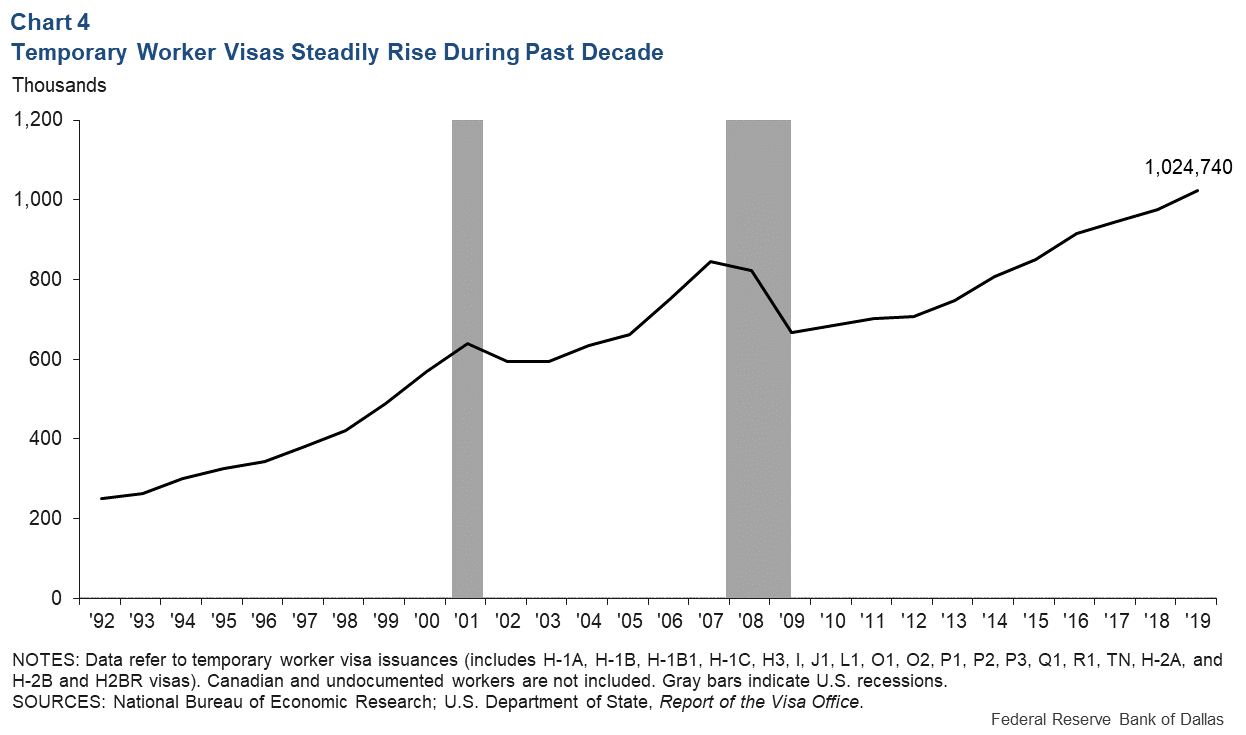
As can be seen, the number of temporary worker visas steadily increased from 2009 through at least 2019. The followind graph comes from 2021 fact sheet from the American Immigration Council:
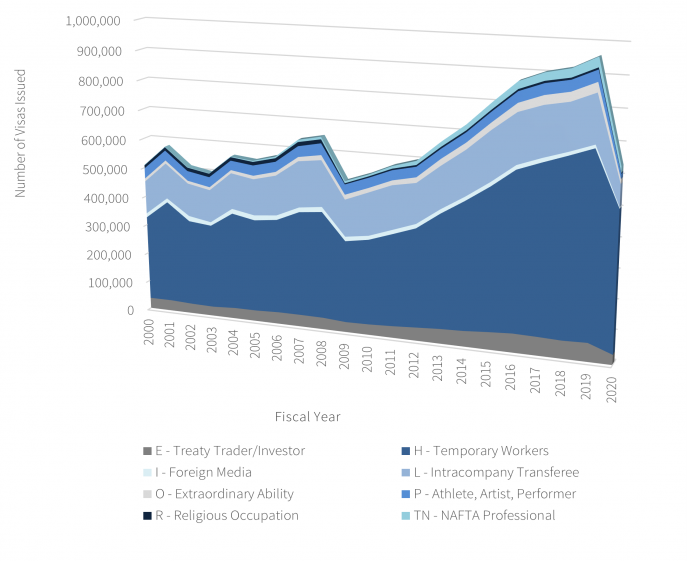
As can be seen, the number of visas issued did go down temporarily due to COVID. However, the number of H-visa Temporary Workers (dark blue) declined only to their 2014 or 2015 level, far above their level in 2008. In any case, their level will doubtlessly return to their prior level as soon as conditions permit.
At the beginning of this 2-minute segment, Dodd stated:
And a look into one factor that could be contributing to the worker shortages we've been seeing as we enter 2022. We've talked about how everything from fears of infection, to childcare needs, to worker burnout have led to what's simply known now as the Great Resignation. There's another factor we might be overlooking and that's this: fewer immigrants coming into the country looking for work and filling some of these jobs.
Then, at the end of the 2-minute segment, Dodd concluded:
The fact of the matter is this, in the United States, this is what has kept our economy growing, if you will. It's been more immigrant labor. And the politicization of immigration has made members of both parties not want to deal with the fact that we're short of workers, and the biggest reason why is a lack of immigration.
So in just two minutes, Chuck Dodd went from "could be" and "another factor" to "the fact that we're short of workers, and the biggest reason why is a lack of immigration". And, as shown above, that incredible conversion was due to a few bits of incomplete, if not cherry-picked, data.