Comparing the 2024 Senate and Presidential Races by County and Precinct
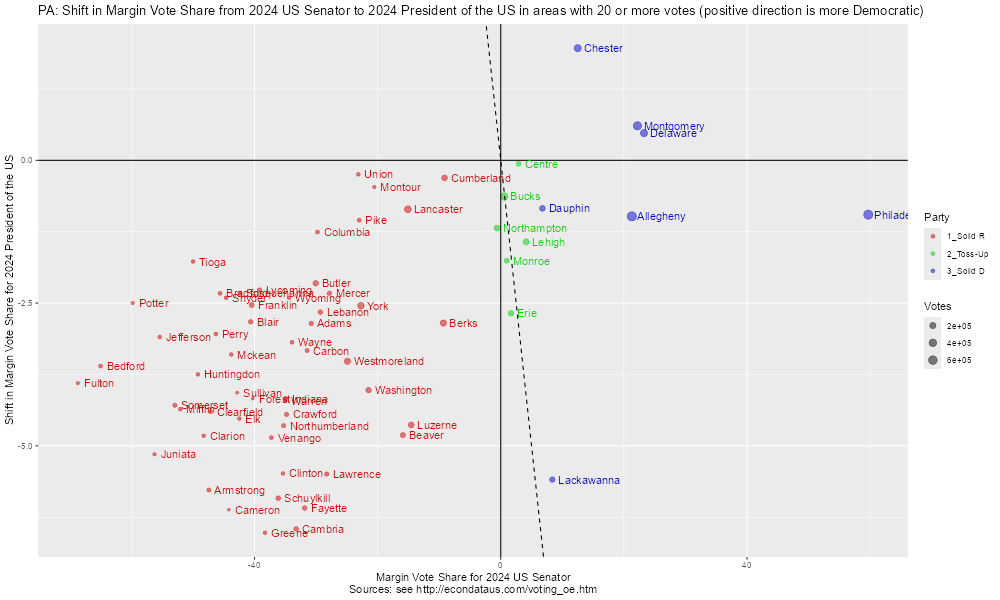
According to Wikipedia, Republican Donald Trump defeated Democrat Kamala Harris by 120,266 votes in the 2024 Presidential race in Pennsylvania. However, according to Wikipedia, Republican Dave McCormick defeated Democrat Bob Casey by a much smaller 15,115 votes in the 2024 Senate race in Pennsylvania. The following graph shows the shift in the margin vote share from the Senate race to the Presidential race by county. The positive direction is more Democratic along both axes in this graph. Hence, all but 3 counties had higher vote margins for Trump than for McCormick.
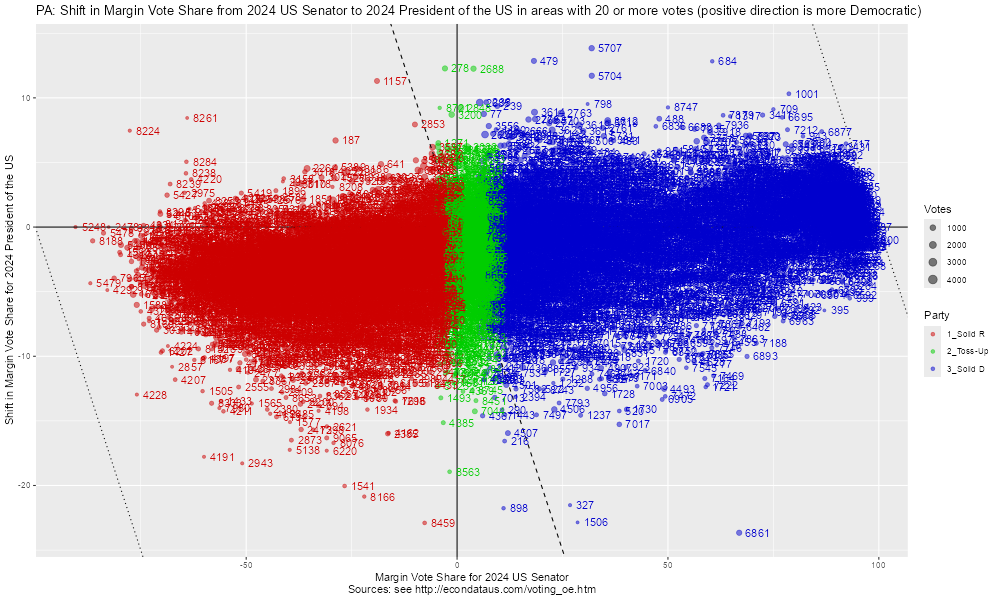
The following graph shows the same shift but by precinct instead of county. By eye, it appears that the precincts shifted Republican on average from an average of about 5 percent for the solid Republican precincts on the far left of the graph to a Democrat shift of about 2 percent for the solid Democrat precincts on the far right of the graph.
A Reddit post titled "A deeper look into PA voting irregularities" states the following:
In a previous post I went over how many times the Democratic total votes for Senator was greater than the Democratic total votes for President in PA (Nevada too). I don't mean ticket splitting. In every election, voters generally decrease in numbers, even if just a little from the biggest races, like for President downward. In PA, 47 counties have more Democratic Senate Votes than Democratic Presidential Votes.
Take Cameron County, 580 D Senate Votes, and 538 D Presidential Votes. (More Senate votes than President votes) Where R Senate Votes were 1558 and R Presidential 1654. (More President votes, which is the norm). I didn't understand why this pattern was happening ONLY for Democrat votes, but also mostly in smaller counties - under 60,000 voters.
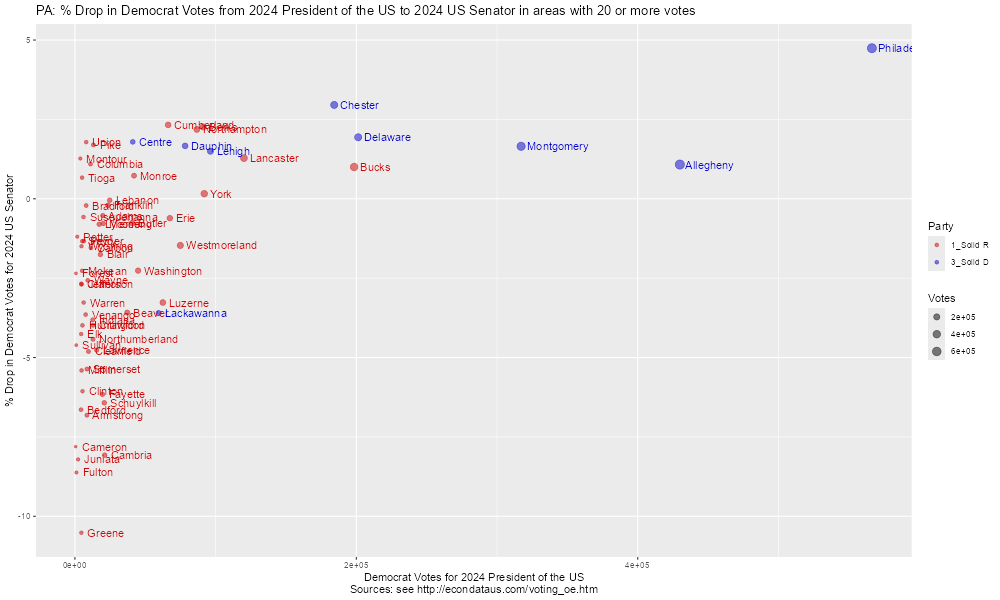
The following plot shows the percent drop from the Presidential to the Senate race for Democrat voters in Pennsylvania in 2024 by county.
As stated in the Reddit post, 47 of the 68 counties had a negative drop signifying that there were more Democratic Senate Votes than Democratic Presidential Votes. Cameron County had the fifth largest negative drop. The DEM_SH column in the following table shows the counties with the five largest negative drops:
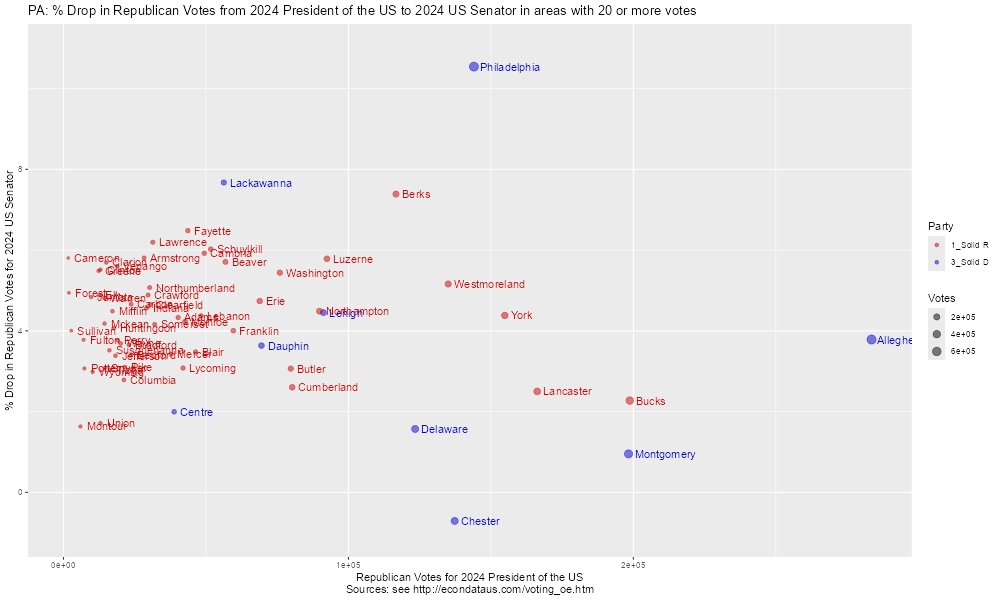
The following plot shows the percent drop from the Presidential to the Senate race for Republican voters in Pennsylvania in 2024 by county.
As can be seen, all 62 counties except for Chester County did have the expected drop from Republican Presidential Votes to Republican Senate Votes. Philadelphia had the highest drop off of over 10 percent.
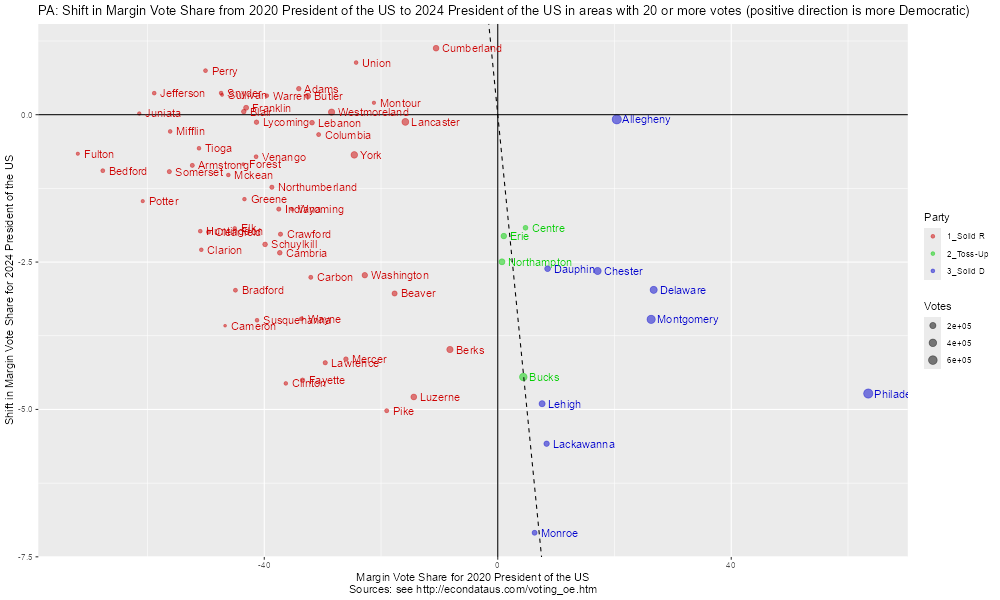
In the same way, it's possible to compare the 2020 and 2024 presidential races by county and precinct. As mentioned above, Wikipedia shows Republican Donald Trump defeating Democrat Kamala Harris by 120,266 votes in the 2024 Presidential race in Pennsylvania. However, Wikipedia shows Democrat Joe Biden defeating Republican Donald Trump by 80,555 votes in the 2020 Presidential race in Pennsylvania. The following graph shows the shift in the margin vote share from the Presidential race in 2020 to the Presidential race in 2024 by county. The positive direction is more Democratic along both axes in this graph. Hence, all but 14 counties had higher vote margins for Biden in 2020 than for Harris in 2024.
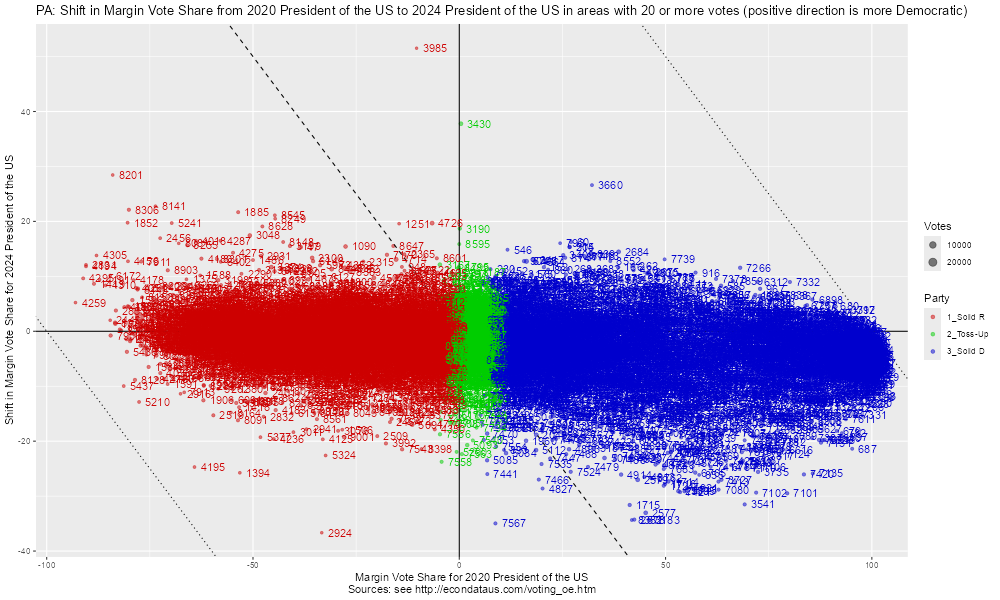
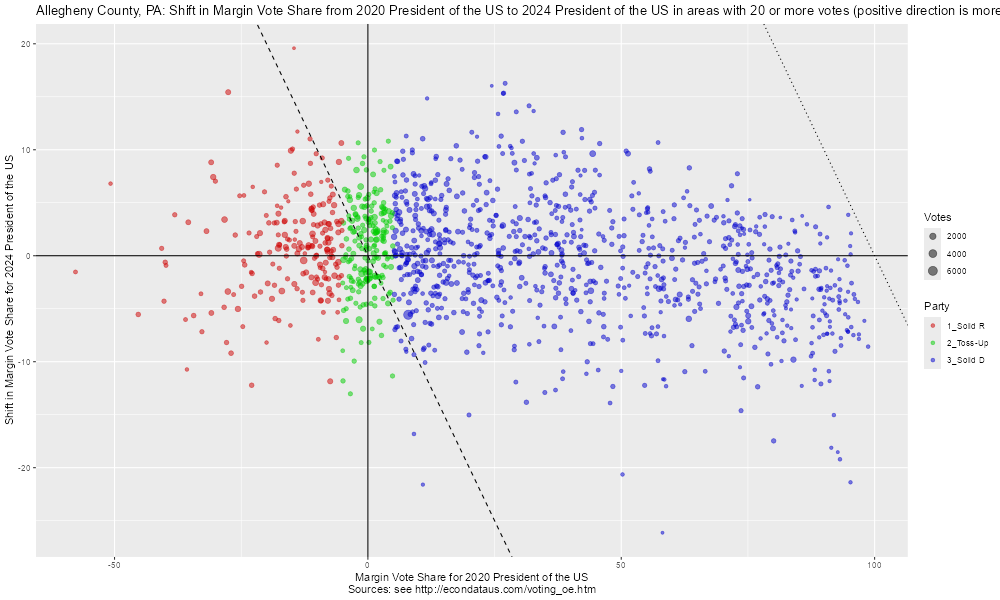
The following graph shows the same shift but by precinct instead of county. By eye, it appears that the solid Republican precincts did not shift on average but that the solid Democrat precincts did shift Republican on average. It appears that the main body of solid Democrat precincts shifted Republican by about 4 percent on average, including a relatively large number of Democrat precincts that shifted Republican by 20 percent or more.
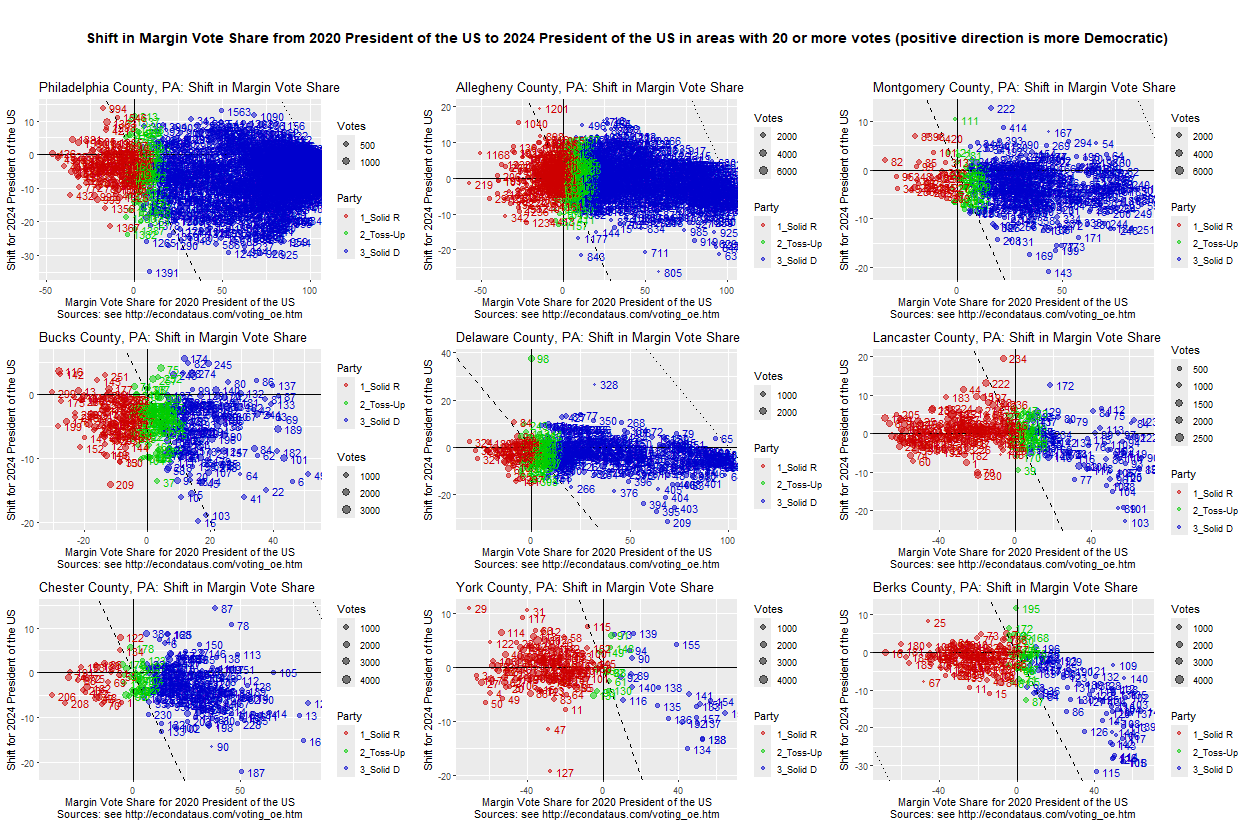
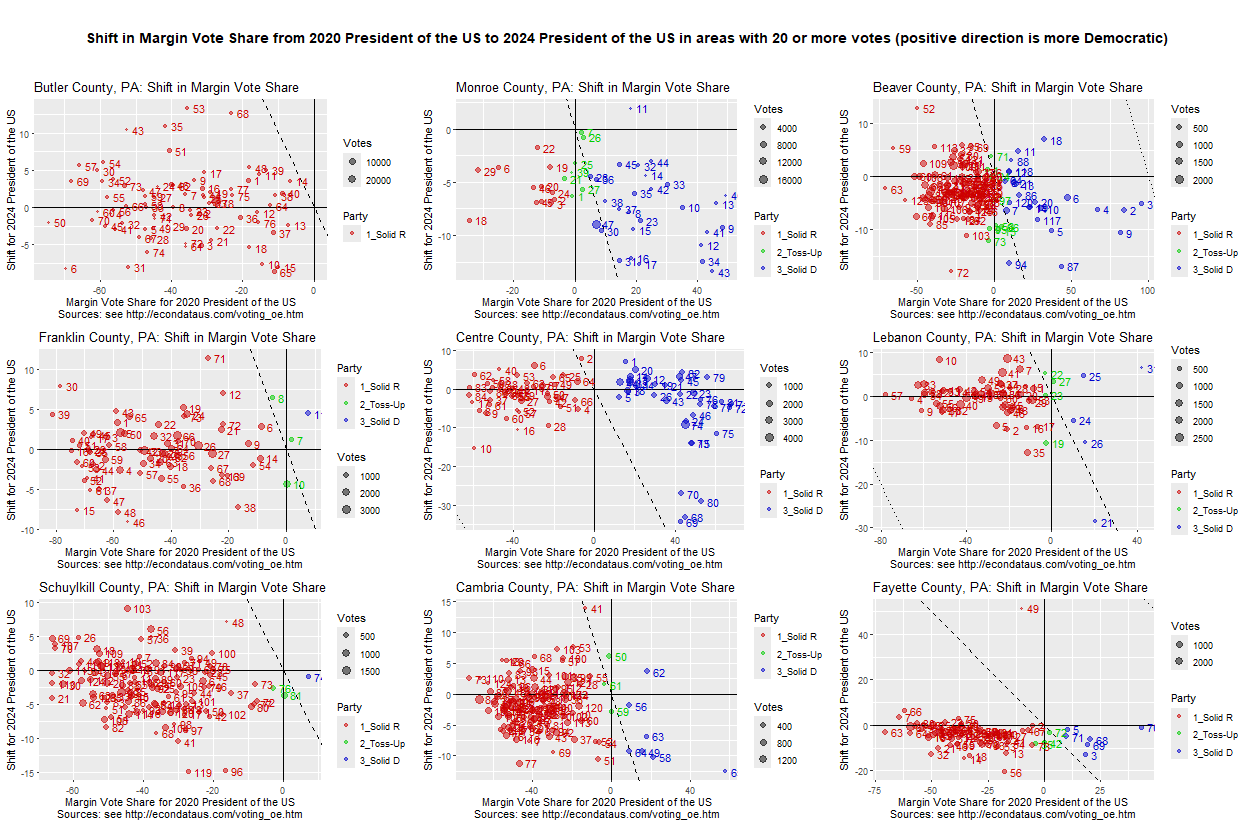
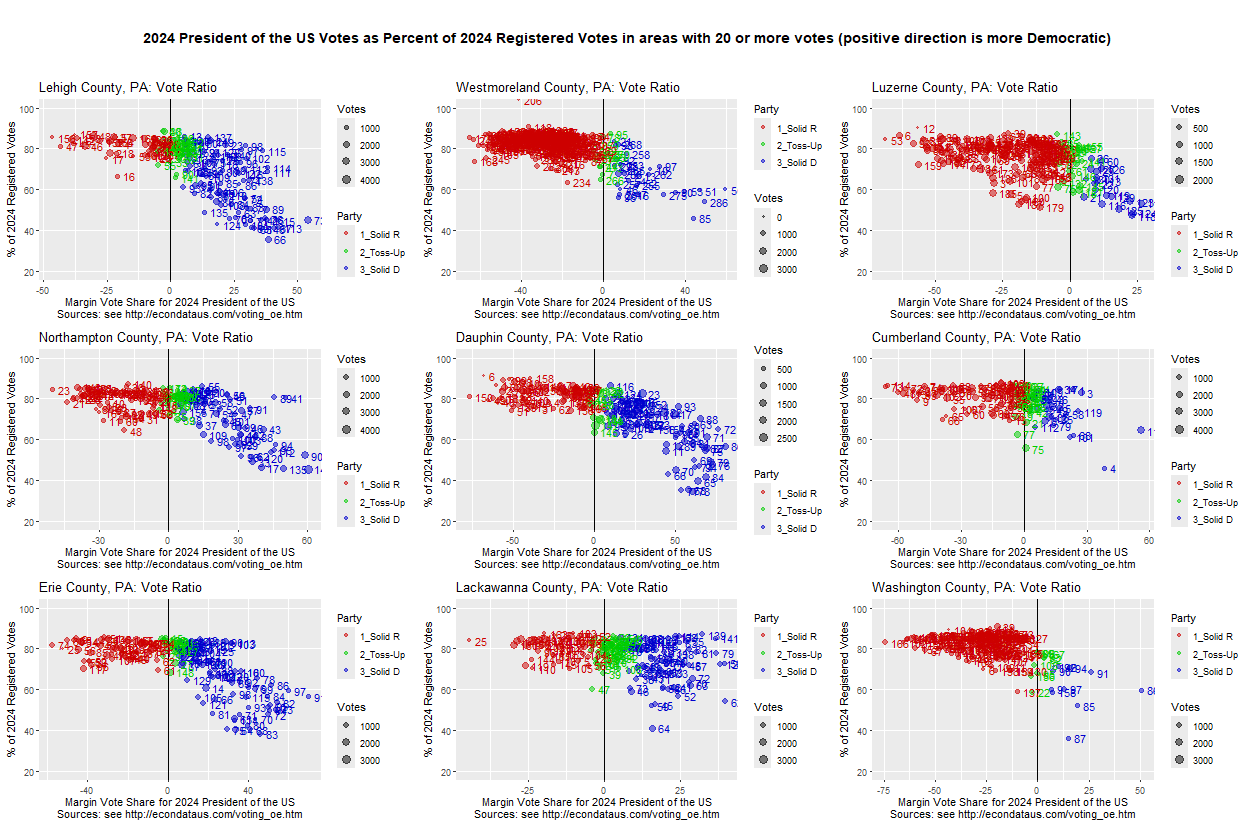
The following 9 graphs show the shift in the margin vote share from the Presidential race in 2020 to the Presidential race in 2024 in the 9 most populous Pennsylvania counties according to this page showing Pennsylvania counties by population in 2025.
All counties seem to show a pattern by which the solid Republican precincts all shifted from 0 to 5 percent Republican on average but that the Democrat precincts shifted Republican by an amount that increased on average as the precincts grew more Democrat. The odd thing is that there appears to be something of a sharp turn toward an increasing Republican shift starting right at the solid Democrat precincts (or sometimes the toss-up precincts). It would seem easier to explain an increasing Republican shift from left to right as there are more Democrat voters to shift. But it's hard to think of any reason that the shift would occur right at the point that the precinct become Democrat (or toss-ups). Most of the shifts are above the diagonal dashed line. This means that those precincts shift in the Republican direction but remain Democrat-leaning.
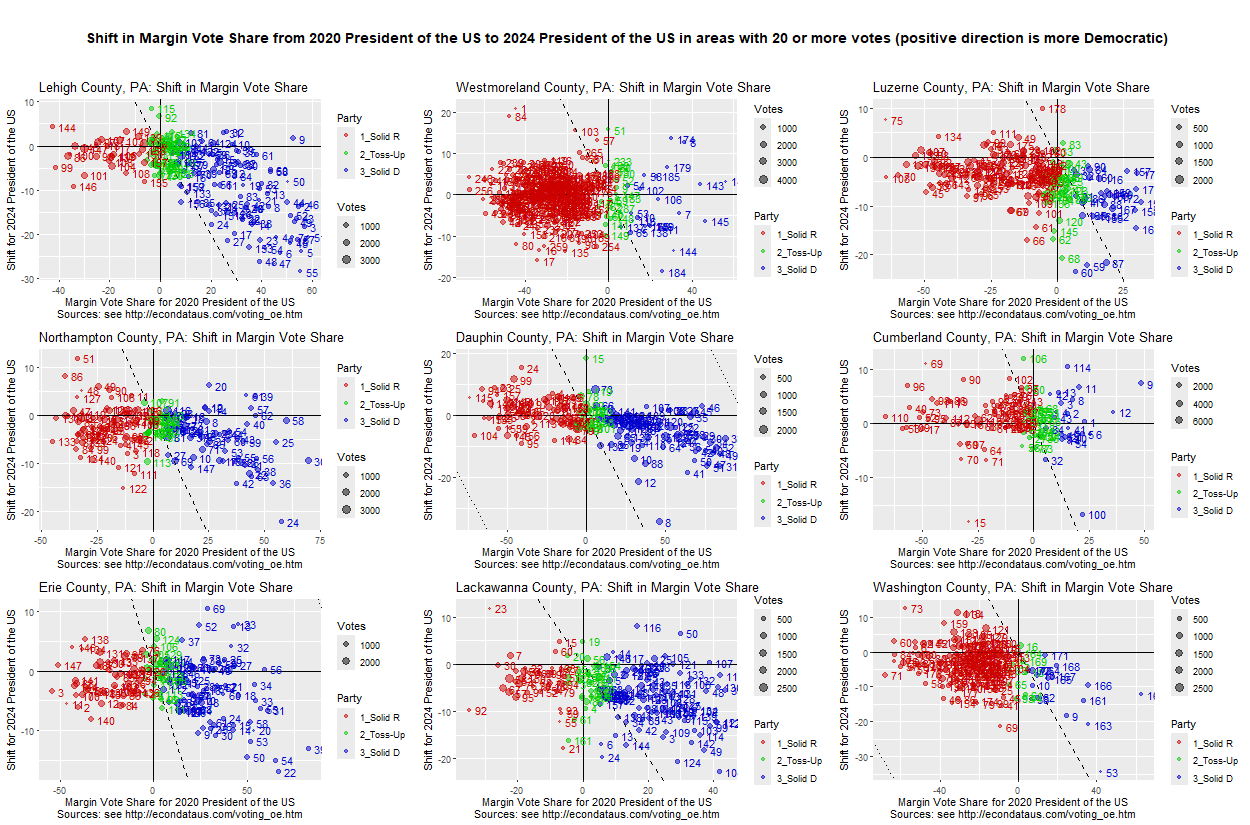
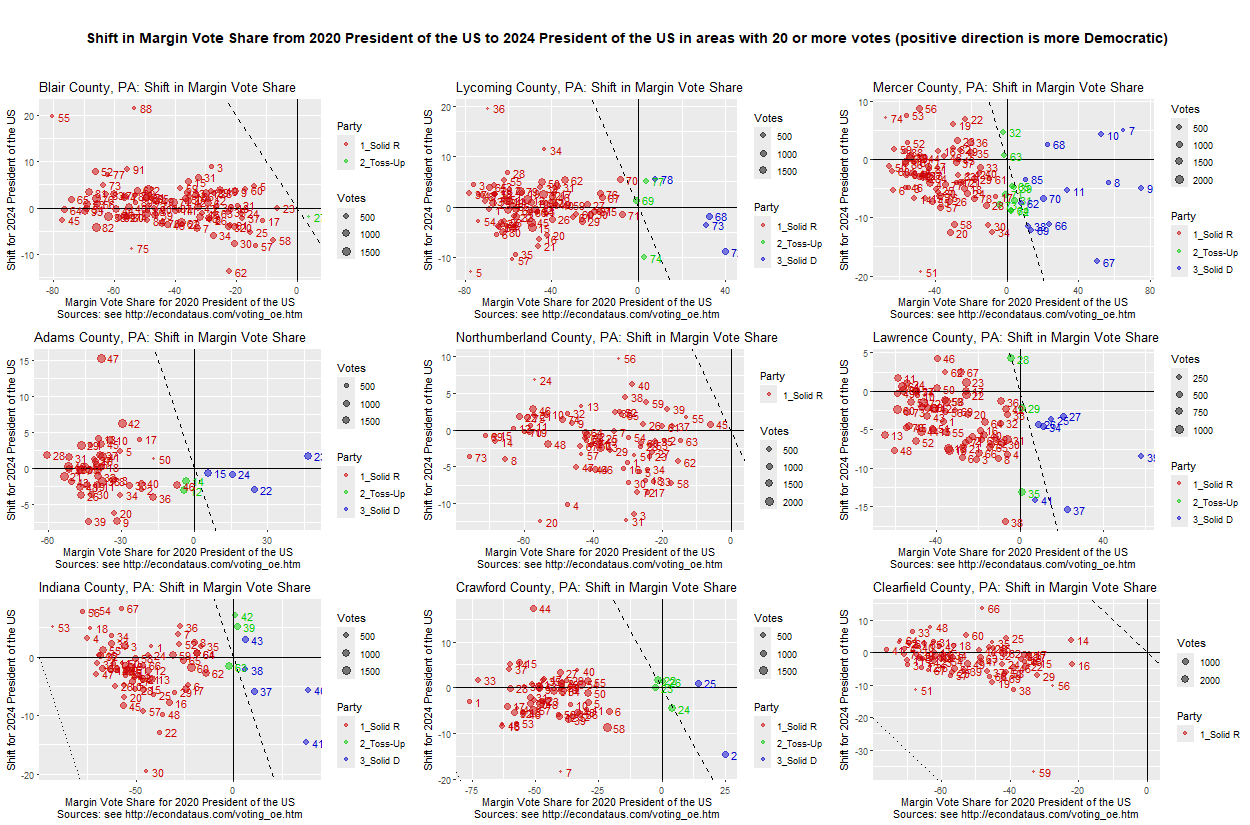
The following 9 graphs show the shift in the next 9 most populous Pennsylvania counties:
Here the pattern again seems somewhat discernible in all of the counties.
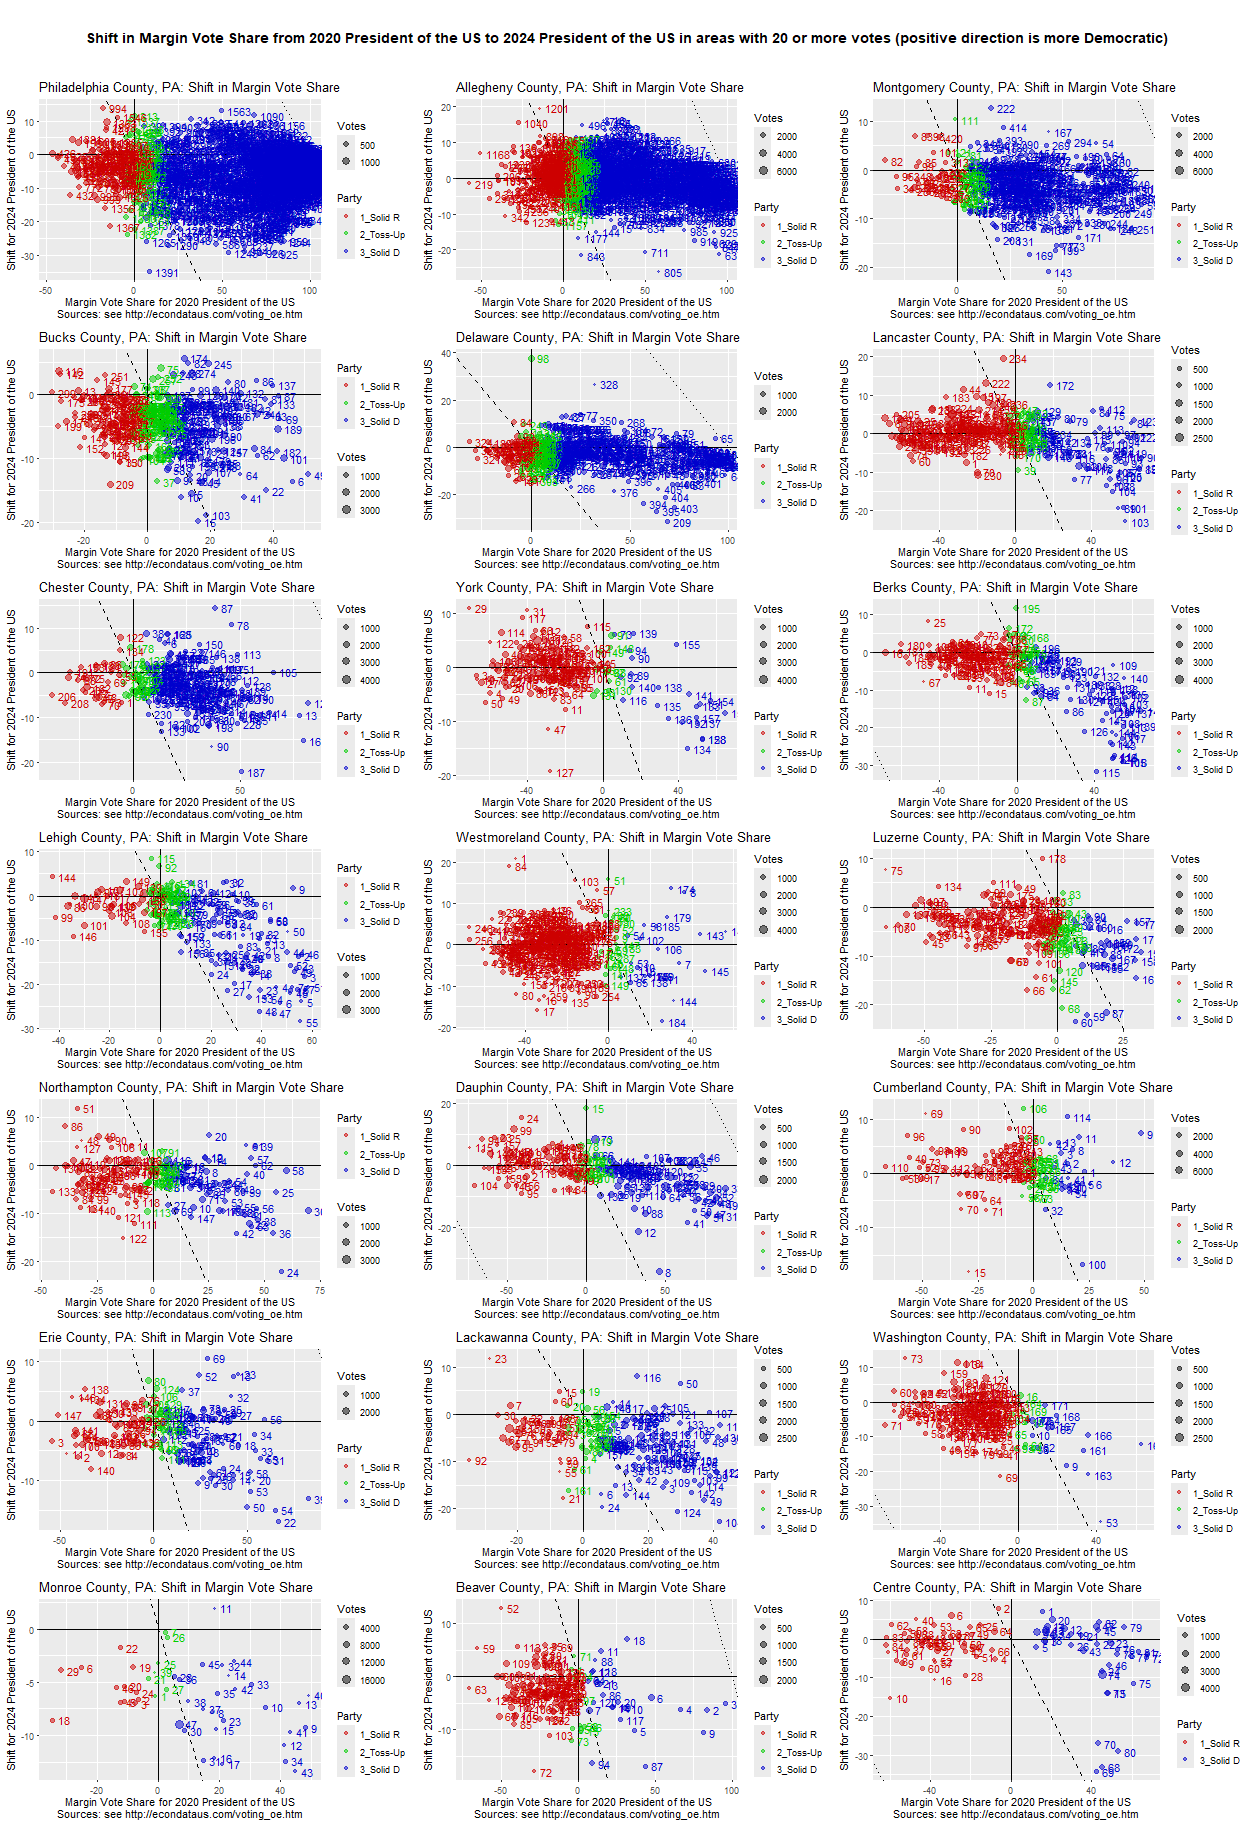
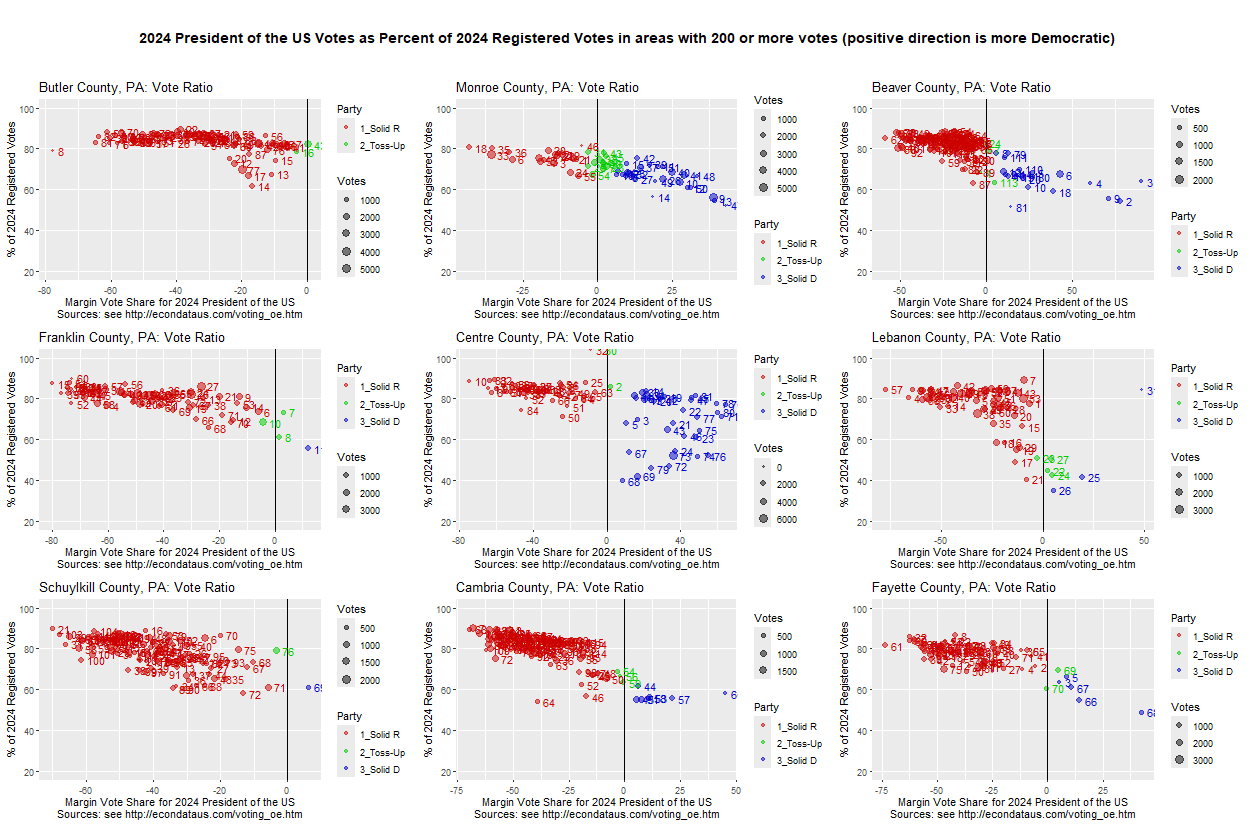
The following 9 graphs show the shift in the next 9 most populous Pennsylvania counties:
Here the pattern seems somewhat discernible in Monroe, Beaver, and Centre Counties and possibly in Lebanon and Cambria Counties. Part of the reason that it may not be discernible in the others is that they contain few solid Democrat precincts.
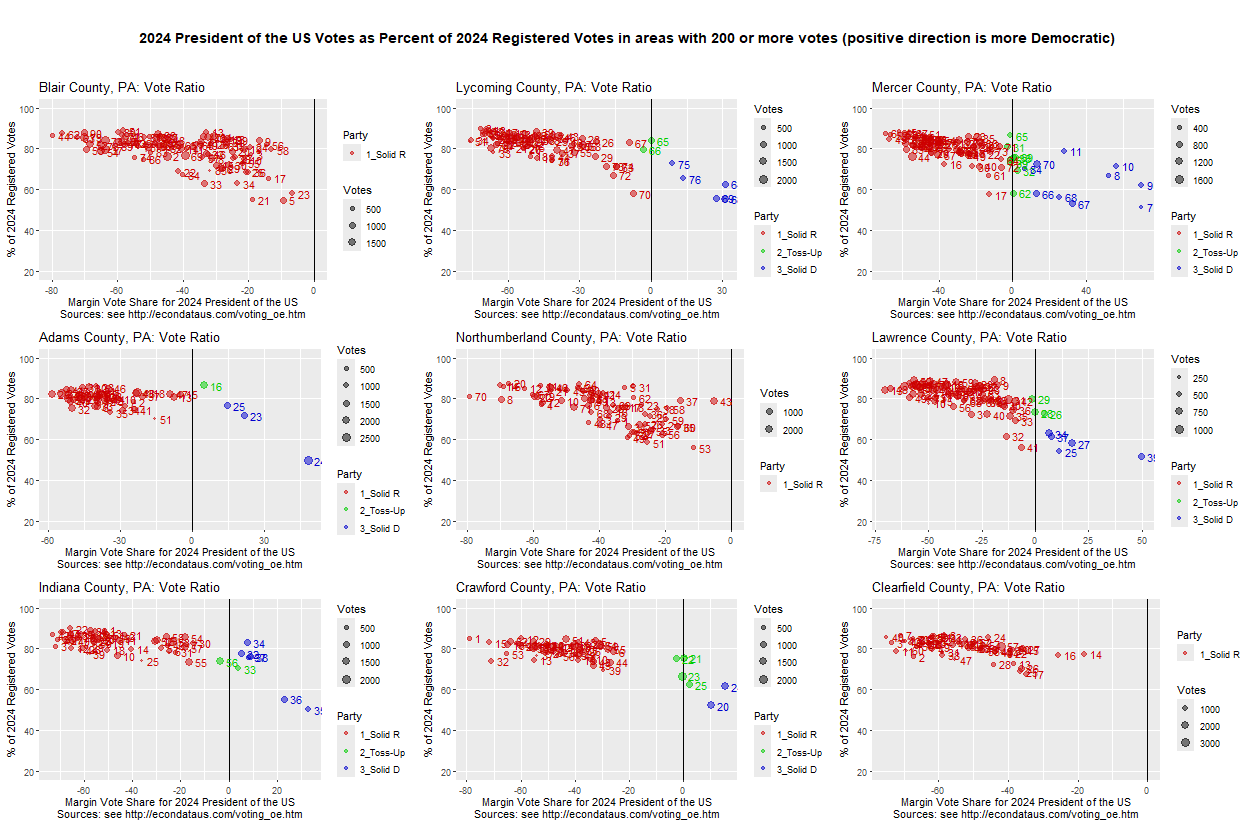
The following 9 graphs show the shift in the next 9 most populous Pennsylvania counties:
Here the pattern does not seem discernible in any of the counties. Again this may be chiefly due to the fact that most contain few solid Democrat precincts.
In summary, following are the 21 Pennsylvania counties where the pattern described in the prior section seems somewhat discernible:
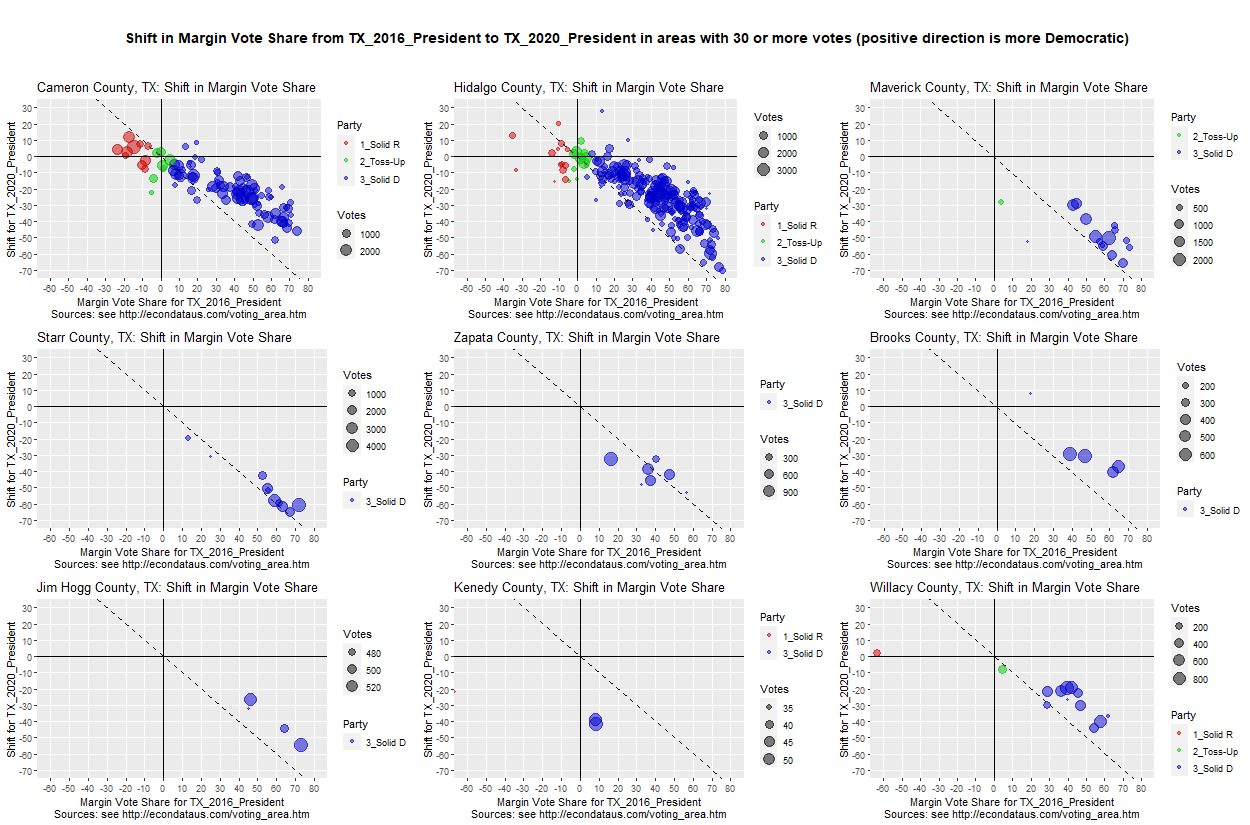
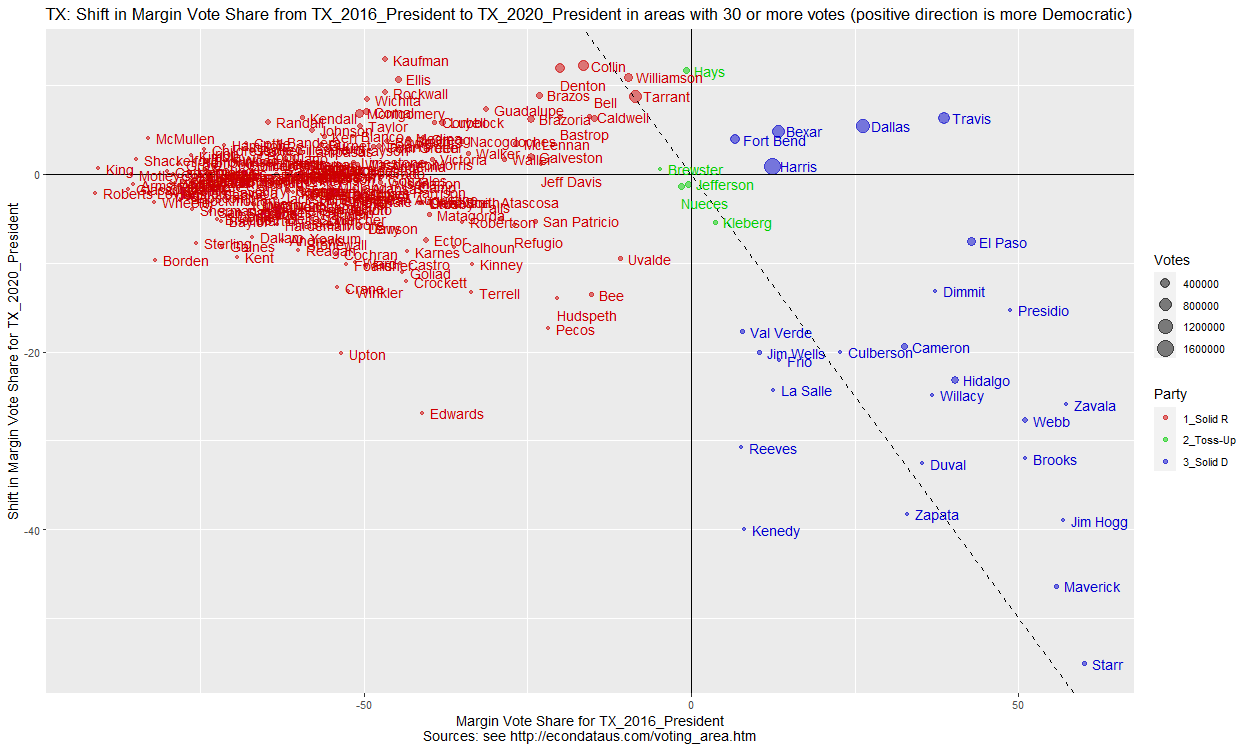
This pattern is reminiscent of a pattern seen in comparing the 2016 and 2020 presidential races in Texas as seen in the following 9 graphs from this page.
The above 9 counties consist of the 8 southernmost counties in Texas, plus Maverick County. The pattern differs a little bit from the pattern seen in Pennsylvania in that the Texas counties contain few Republican precincts. However, the pattern can also be seen in the following graph of the shift in Texas counties from that page.
All of the solid Democrat counties that shifted Republican appear to be within 100 miles of the US/Mexico border according to this map. Hence, that could also be a factor in the case of the these Texas counties.
As mentioned in the prior section, the odd thing is that there appears to be something of a sharp turn toward an increasing Republican shift starting right at the solid Democrat precincts (or the toss-up precincts). It would seem easier to explain an increasing Republican shift from left to right as there are more Democrat voters to shift. But it's hard to think of any reason that the shift would occur right at the point that the precinct become Democrat (or toss-ups). It would seem that this pattern very much merits futher investigation.
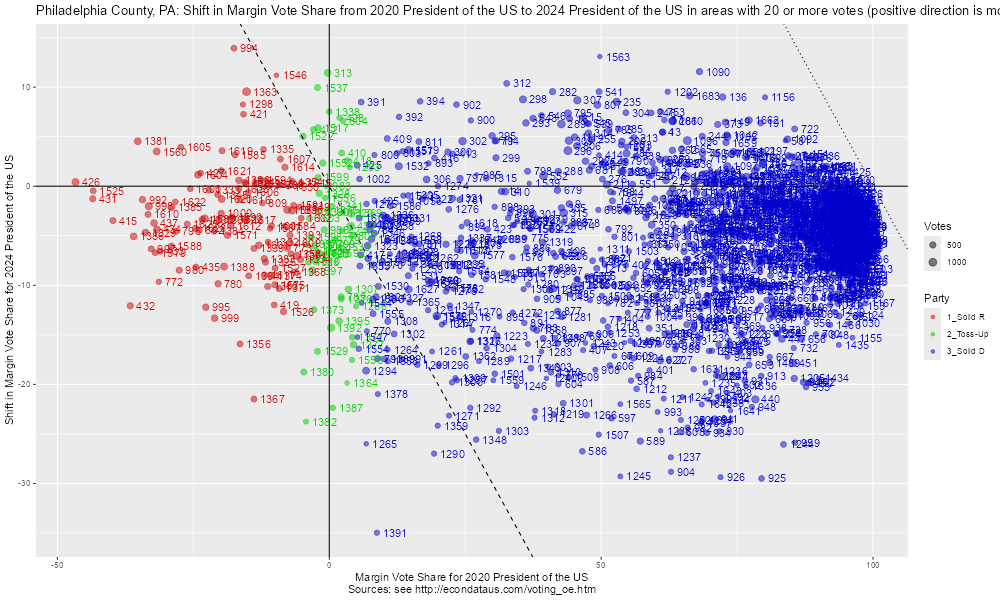
Because Philadelphia County contains so many more precincts than other Pennsylvania counties, the following graph shows more details.
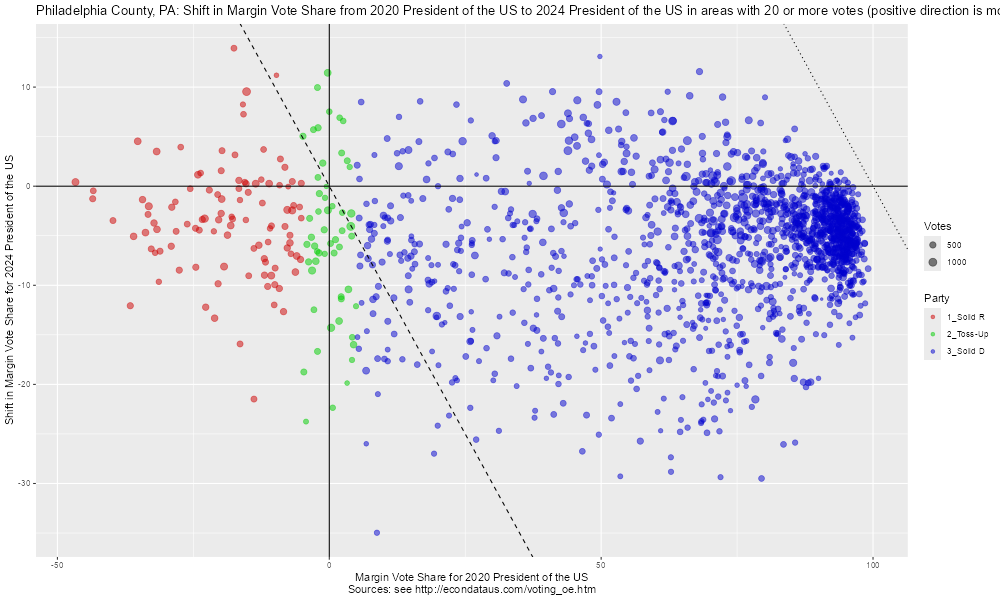
The above graph gives indexes for the precincts that can be identified in a table. Following is the same graph without any labels:
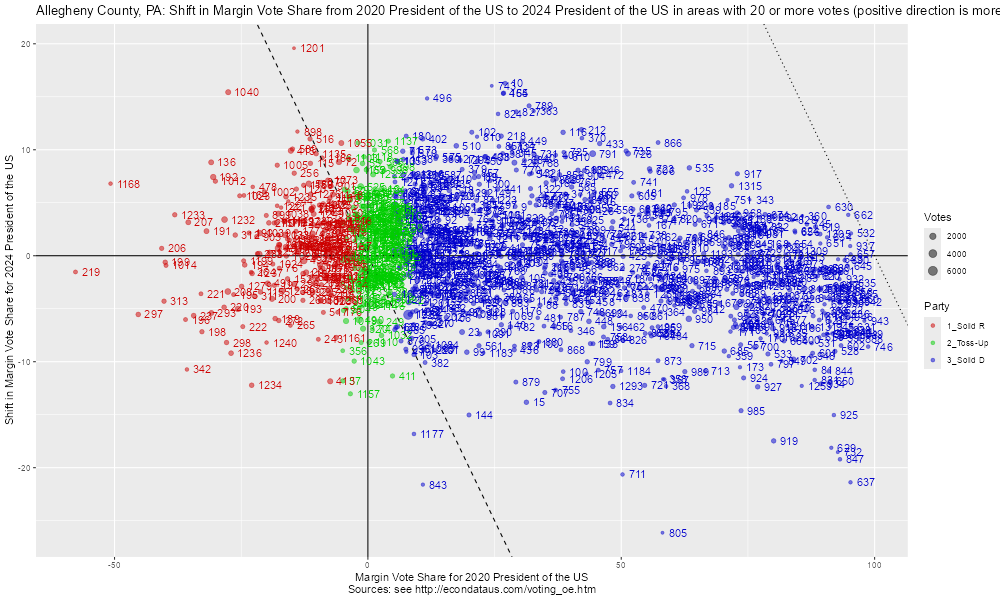
Because Allegheny County also contains many more precincts than other Pennsylvania counties, the following graph shows more details.
The above graph gives indexes for the precincts that can be identified in a table. The following graph shows the actual precinct names:
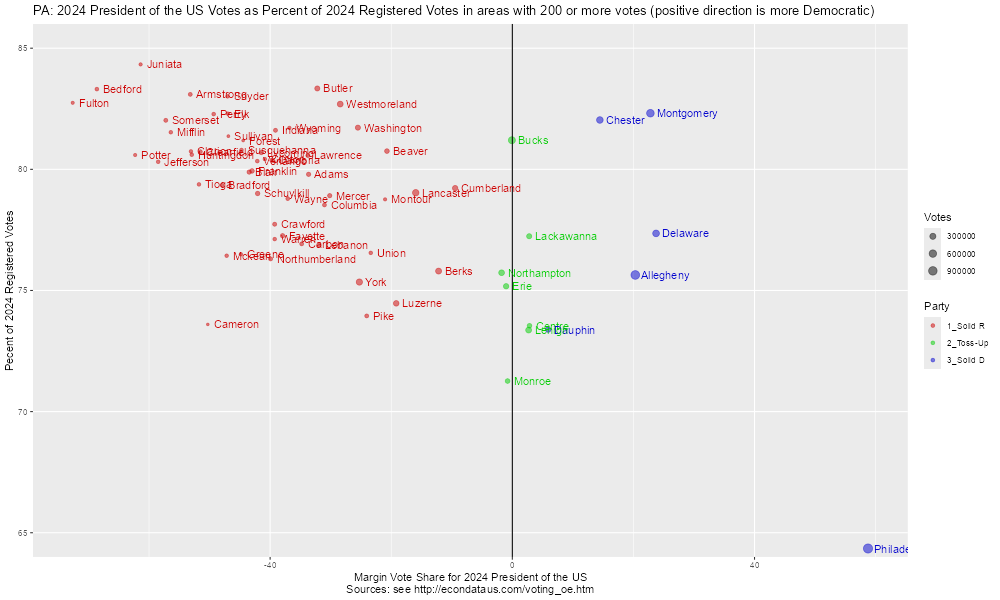
Pennsylvania has posted voter registration data by precinct. The graph below shows the turnout by county in the 2024 Presidential race in Pennsylvania:
As can be seen, the turnout in Philadelphia was just under 65 percent. The turnout in all other counties was between 71 and 85 percent.
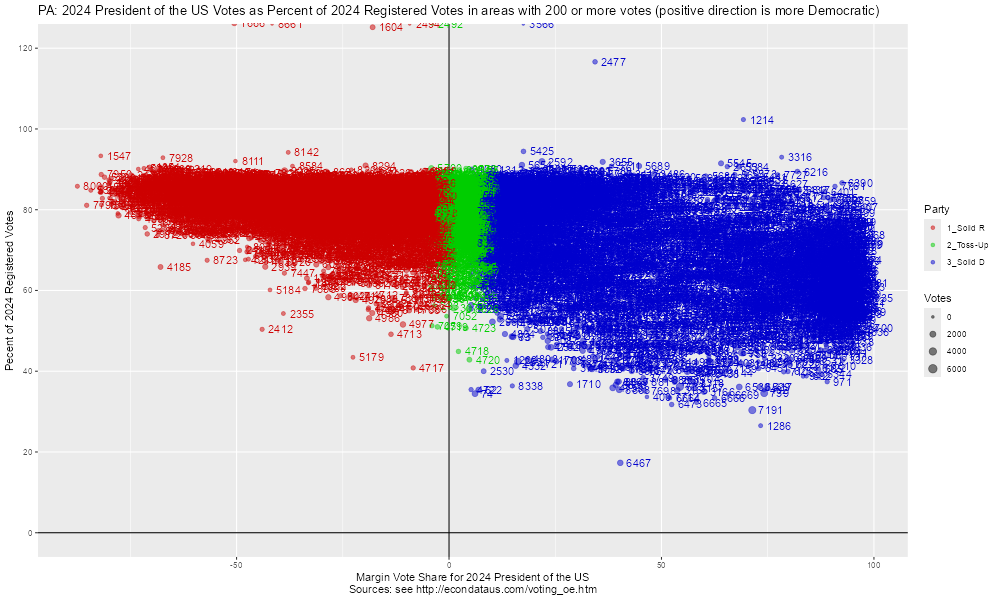
The following graph shows the same shift but by precinct instead of county. By eye, it appears that the turnout for most counties is below 90 percent. However, the turnout of the main body of solid Republican precincts look to go as low as 50 percent but the turnout of the main body of solid Democrat precincts looks to go as low as about 30 percent.
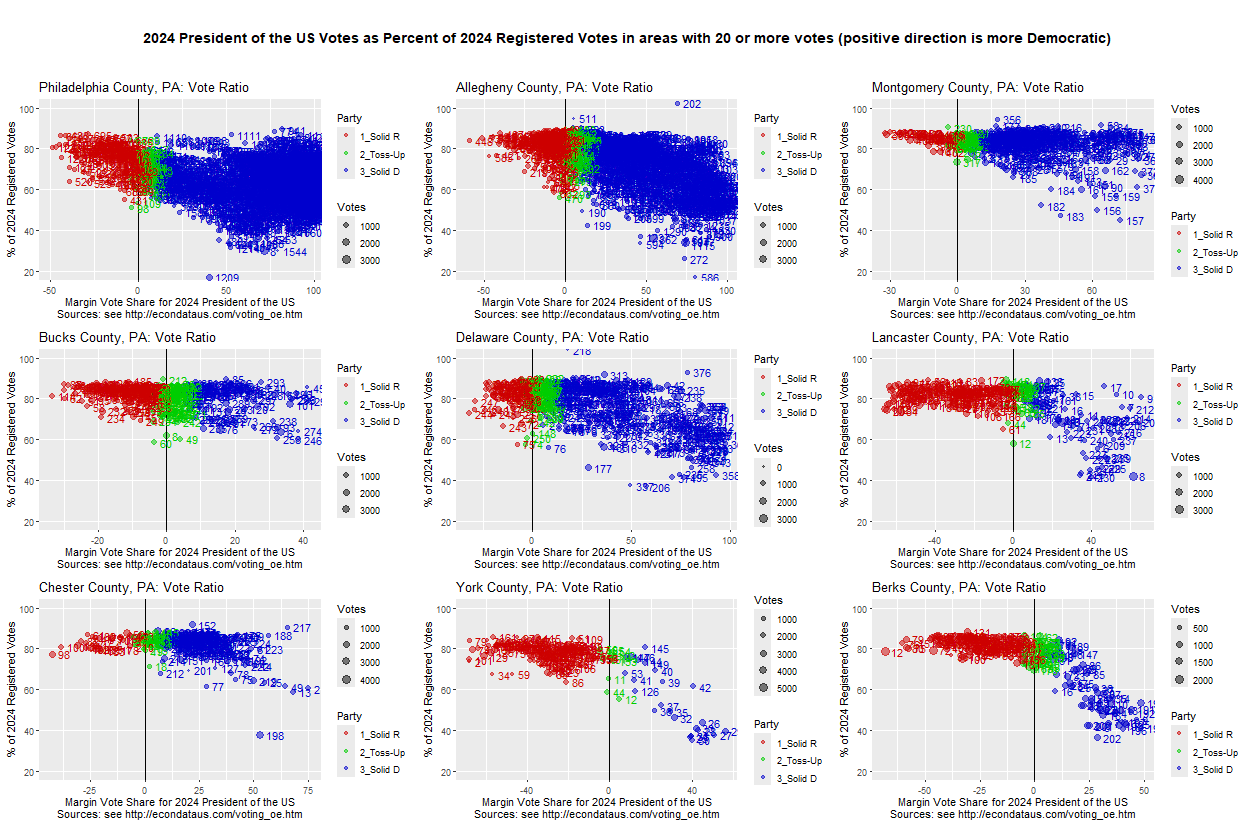
The following 9 graphs show the turnout by precinct in the 2024 Presidential race in the 9 most populous Pennsylvania counties according to this page showing Pennsylvania counties by population in 2025.
All counties seem to show a pattern by which the turnout in all of the solid Republican precincts is around 80 percent on average but that the turnout drops off in all of the solid Democrat precincts. The odd thing is that there appears to often be something of a sharp turn where the drop off starts right at the solid Democrat precincts (or sometimes the toss-up precincts). It would seem easier to explain a drop off that increases steadily since the percentage of Democrat support in the precincts increase steadily from left to right. But it's hard to think of any reason that the drop off would occur right at the point that the precinct become Democrat (or toss-ups).
The following 9 graphs show the shift in the next 9 most populous Pennsylvania counties:
Here the pattern again seems somewhat discernible in all of the counties.
The following 9 graphs show the shift in the next 9 most populous Pennsylvania counties:
Here the pattern seems somewhat discernible in Monroe, Beaver, and Centre Counties and possibly in Lebanon and Cambria Counties. Part of the reason that it may not be discernible in the others is that they contain few solid Democrat precincts.
The following 9 graphs show the shift in the next 9 most populous Pennsylvania counties:
Here the pattern does not seem discernible in any of the counties. Again this may be chiefly due to the fact that most contain few solid Democrat precincts.
In summary, following are the 21 Pennsylvania counties where the pattern described in the prior section seems somewhat discernible:
Especially in 6th county (Lancaster) through the 17th county (Lackawanna), the pattern looks a bit like a gun facing left, with the barrel on the left at about 80 percent turnout and the handle on the right reaching down to about 40 percent. Again, there may be reasons why Republican voters might have tended to have higher turnout in Pennsylvania. But it's difficult to think of anything that would cause the turnout of ALL voters to drop off sharply at just the point where the precincts start to lean Democrat.
As it happens, this pattern was also seen in Clark County, Nevada in 2024. On January 6, 2025, Ray Lutz, founder of Citizens Oversight, posted a Substack article titled "Convincing evidence of likely manipulation of 2024 Presidential votes in Nevada". Following is the first paragraph:
We've been playing around with data from the state of Nevada in an effort to find any strong evidence that the data looks fishy. To refresh your memory, in Nevada, we had fairly anomalous results, since the state went to the D-Party candidate over Trump in 2016 and 2020. And all of a sudden, in this election, it is flipped, with Trump winning the state.
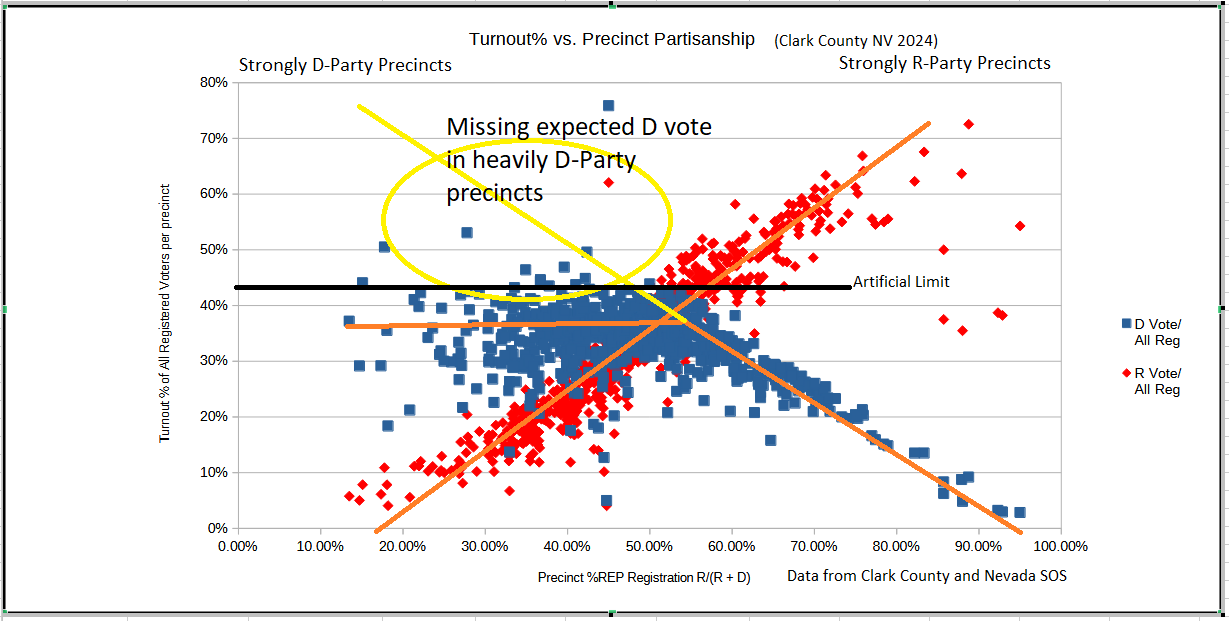
Further on, he posts the following graph, which his article explains.
Regarding his graph, Ray states the following:
What is absolutely stunning about this plot is the fact that in strong D-party precincts, turnout percentages consistently plateau below 45%, suggesting a systematic irregularity.
It seems there is an artificial limit to the turnout % allowed in those precincts, to less than 45%. The limit is so stark, it is chilling.
The data you see here is only for Clark County, which is a huge part of Nevada (around 66% of the state), and strongly D-leaning. Harris did win in this county. But her win here was not enough to offset the other third of the votes in the state, given this artificial limit.
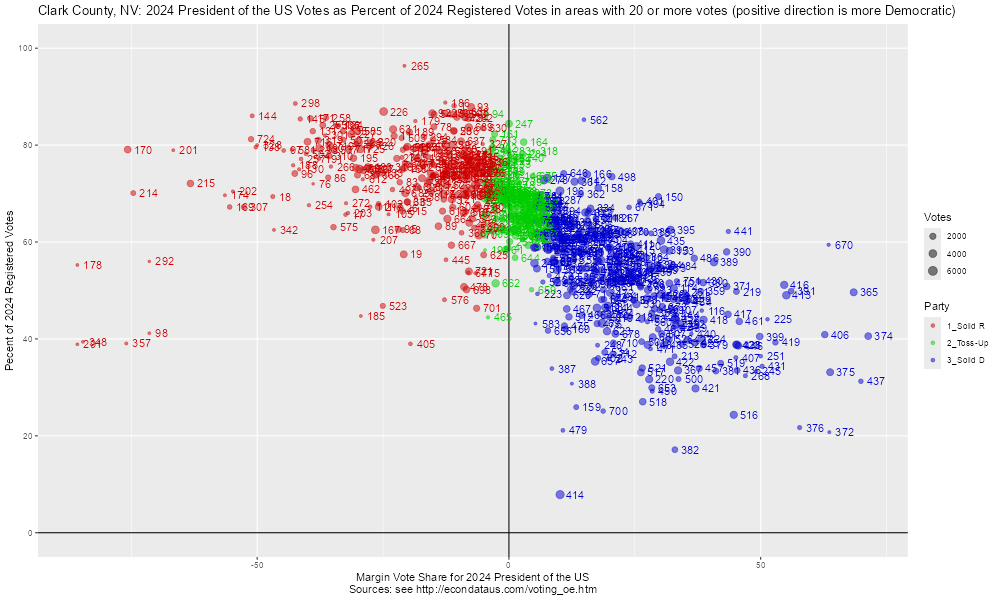
Ray's graph plots the data with the registration margin along the x-axis with solid Republican precincts to the right and the turnout by party as a percent of all registered voters along the y-axis. In contrast, the graphs above plot the data with the actual vote margin along the x-axis with solid Republican precincts to the left (not right) and the turnout of ALL voters as a percent all registered voters along the y-axis. The graph below shows the Clark County data plotted in this way:
As can be seen, the same gun pattern appears with the barrel on the left at about 80 percent and the handle on the right dropping off to about 40 percent. As with Pennsylvania, the drop off appears to occur sharply, right at the point that the precincts become Democrat (or toss-ups). It's difficult to think of an explanation for this other than some sort of manipulation and/or voter suppression. At the very least, this merits additional investigation.
Bulk Election Data for Pennsylvania:
Looking at the Dropoff from the Presidential to the Senate Race by County
PA: % Drop in Democrat Votes from 2024 President of the US to 2024 US Senator (Count % drop)

           COUNTY   AREA       Dem       Rep  MARGIN1     TOTAL1     Dem.1     Rep.1 MARGIN2     TOTAL2 DEM_SH REP_SH  MAR_SH TOT_SH
1         GREENE COUNTY     4,592    12,319   -7,727     17,236     5,075    11,643  -6,568     17,145 -10.52   5.49   15.00   0.53
2         FULTON COUNTY     1,102     7,039   -5,937      8,177     1,197     6,773  -5,576      8,116  -8.62   3.78    6.08   0.75
3        JUNIATA COUNTY     2,290     9,721   -7,431     12,104     2,478     9,251  -6,773     12,042  -8.21   4.83    8.85   0.51
4        CAMBRIA COUNTY    21,177    49,408  -28,231     71,136    22,887    46,482 -23,595     71,004  -8.07   5.92   16.42   0.19
5        CAMERON COUNTY       538     1,654   -1,116      2,219       580     1,558    -978      2,214  -7.81   5.80   12.37   0.23
As can be seen, the vote numbers in the post above match the table and Cameron County had a drop of 7.81 percent.
Comparing the 2020 and 2024 Presidential Races by County and Precinct
Comparing the 2020 and 2024 Presidential Races by Precinct in the Most Populous Counties
Comparing the Pattern seen in Pennsylvania in 2024 with the Pattern seen in Texas in 2020
Comparing the 2020 and 2024 Presidential Races by Precinct in Philadelphia County
Comparing the 2020 and 2024 Presidential Races by Precinct in Allegheny County
Looking at the Turnout for the 2024 Presidential Race by County and Precinct
Looking at the Turnout for the 2024 Presidential Race by Precinct in the Most Populous Counties
Comparing the Pattern in Turnout seen in Pennsylvania to that seen in Clark County, Nevada in 2024

Data Sources
2024 U.S. Election