Counties with Lowest Percentage of U.S. Born Computer Software Developers, 2017
Computer software developers (229): 2017, grouped by BIRTHPLACE_TECH (percent)

   Year                   COUNTY  Count U.S._Born India China Other
1  2017         Hudson County NJ  8,836      13.1  58.4  15.5  13.0
2  2017      Middlesex County NJ 15,402      18.5  65.4   7.5   8.5
3  2017        Johnson County IN  1,397      19.0  81.0   0.0   0.0
4  2017    Santa Clara County CA 90,412      26.2  37.8  17.3  18.8
5  2017       Somerset County NJ  3,903      29.0  28.7  17.5  24.8
6  2017        Alameda County CA 39,393      29.6  47.0  12.9  10.4
7  2017         Morris County NJ  4,339      32.6  50.0   7.2  10.1
8  2017      San Mateo County CA 19,108      32.9  19.6  21.3  26.2
9  2017       Richmond County NY  1,966      33.5   0.0  13.5  53.0
10 2017         Mercer County NJ  4,055      34.3  51.6   0.0  14.0
11 2017         McLean County IL  2,872      34.7  65.3   0.0   0.0
12 2017        Forsyth County GA  4,449      35.1  55.4   1.3   8.2
13 2017           Lake County IL  6,757      35.3  40.5   5.8  18.4
14 2017 San Bernardino County CA  4,067      39.6  19.9  16.6  23.9
15 2017          Essex County NJ  4,690      39.6   8.6  21.6  30.2
16 2017   Contra Costa County CA 13,197      39.6  30.8   8.6  21.0
17 2017        Broward County FL  7,696      40.4  25.9   4.8  29.0
18 2017     Williamson County TN  2,837      40.5  50.1   3.1   6.3
19 2017         Bergen County NJ  5,208      41.0  29.1   4.1  25.8
20 2017        Loudoun County VA 12,867      41.1  46.5   2.0  10.4
21 2017         Denton County TX  7,218      41.1  35.7   4.7  18.5
22 2017         Warren County OH  2,469      42.6  53.7   0.0   3.7
23 2017      Fairfield County CT  4,237      43.2  29.6  13.0  14.2
24 2017         Collin County TX 19,963      43.7  40.3   6.0  10.0
25 2017         DuPage County IL  9,767      44.0  38.4   4.2  13.4
26 2017           Will County IL  3,733      44.3  34.0  12.1   9.5
27 2017        Oakland County MI 14,694      44.5  38.9   7.8   8.8
28 2017          Union County NJ  2,267      45.1  21.2   7.8  25.9
29 2017    Mecklenburg County NC 10,694      45.9  44.0   2.7   7.4
30 2017         Benton County AR  3,468      46.0  46.8   0.6   6.6
31 2017           King County WA 72,589      46.0  22.1  13.4  18.5
32 2017        Henrico County VA  4,010      46.4  51.6   0.0   2.0
33 2017         Orange County CA 29,277      46.7  14.4  10.8  28.1
34 2017      Fort Bend County TX  5,700      47.4  24.9   6.0  21.8
35 2017        Douglas County NE  3,432      47.5  52.5   0.0   0.0
36 2017          Duval County FL  6,645      47.7  36.5   0.0  15.9
37 2017         Dallas County TX 16,730      47.9  40.0   3.8   8.4
38 2017      Cleveland County OK  2,619      48.5  32.8   0.0  18.7
39 2017        Suffolk County MA  7,205      48.9   5.8   7.6  37.7
40 2017      San Diego County CA 27,569      49.0  15.8   5.1  30.1
41 2017         Queens County NY 12,032      49.1  10.4  12.8  27.7
42 2017     Montgomery County MD 15,992      49.7  14.2   9.4  26.6
43 2017      Snohomish County WA  7,859      50.1  20.8   6.4  22.8
44 2017      El Dorado County CA  1,205      50.2  49.8   0.0   0.0
45 2017    San Joaquin County CA  2,148      50.7  29.0   2.4  18.0
46 2017   Hillsborough County FL  7,446      51.2  36.4   0.0  12.4
47 2017     Montgomery County TX  2,231      51.4  11.4  16.9  20.3
48 2017     Williamson County TX  9,423      52.4  32.9   4.8  10.0
49 2017        Suffolk County NY  6,851      54.0   5.5  14.3  26.2
50 2017       Hartford County CT  6,529      54.1  27.2   1.2  17.5

URL parameters (short)=
?STATE=&geo=COUNTY&occ=Computer%20software%20developers%20(229)&group=BIRTHPLACE_TECH&sortn=4&sortdir=Ascending&mincount=1000&totrows=50
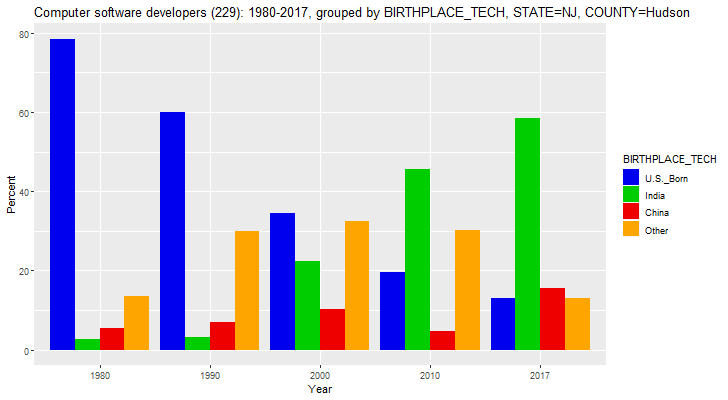
Birthplaces of Computer Software Developers in Hudson County, New Jersey, percentages, 1980-2017
Computer software developers (229): 1980-2017, grouped by BIRTHPLACE_TECH, STATE=NJ, COUNTY=Hudson (percent)

  Year           COUNTY Count U.S._Born India China Other
1 1980 Hudson County NJ   740      78.4   2.7   5.4  13.5
2 1990 Hudson County NJ 1,992      59.9   3.2   7.0  29.9
3 2000 Hudson County NJ 4,507      34.5  22.5  10.4  32.6
4 2010 Hudson County NJ 5,793      19.6  45.5   4.8  30.1
5 2017 Hudson County NJ 8,836      13.1  58.4  15.5  13.0

URL parameters (short)=
?minyear=1980&STATE=NJ&COUNTY=Hudson&geo=COUNTY&occ=Computer%20software%20developers%20(229)&group=BIRTHPLACE_TECH&sortn=4&sortdir=Ascending&mincount=100&totrows=50&color=blue2,green3,red2,orange1
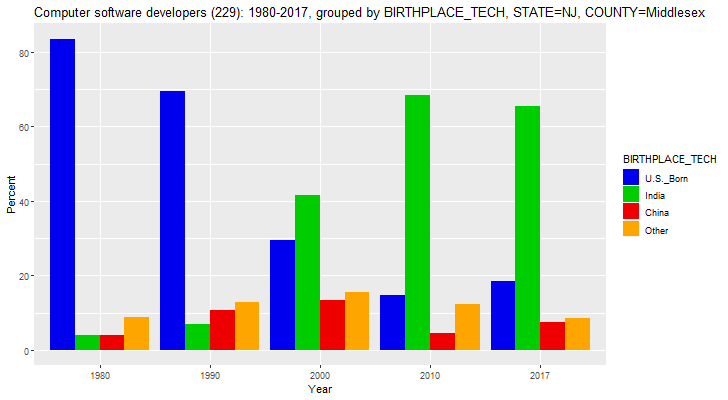
Birthplaces of Computer Software Developers in Middlesex County, New Jersey, percentages, 1980-2017
Computer software developers (229): 1980-2017, grouped by BIRTHPLACE_TECH, STATE=NJ, COUNTY=Middlesex (percent)

  Year              COUNTY  Count U.S._Born India China Other
1 1980 Middlesex County NJ  2,060      83.5   3.9   3.9   8.7
2 1990 Middlesex County NJ  5,449      69.6   7.0  10.6  12.8
3 2000 Middlesex County NJ 14,303      29.4  41.7  13.4  15.5
4 2010 Middlesex County NJ 14,448      14.8  68.5   4.5  12.2
5 2017 Middlesex County NJ 15,402      18.5  65.4   7.5   8.5

URL parameters (short)=
?minyear=1980&STATE=NJ&COUNTY=Middlesex&geo=COUNTY&occ=Computer%20software%20developers%20(229)&group=BIRTHPLACE_TECH&sortn=4&sortdir=Ascending&mincount=100&totrows=50&color=blue2,green3,red2,orange1
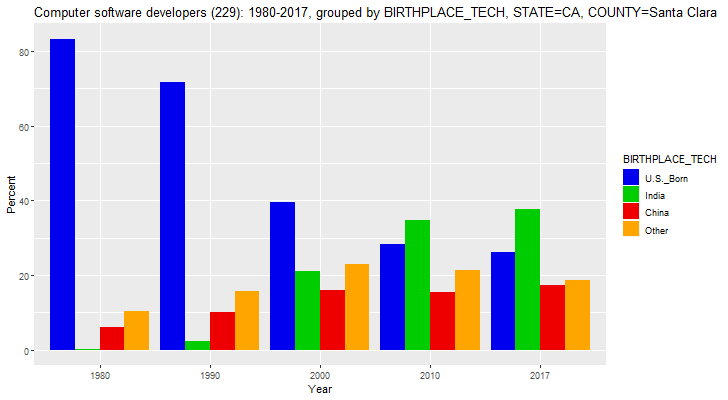
Birthplaces of Computer Software Developers in Santa Clara County, California, percentages, 1980-2017
Computer software developers (229): 1980-2017, grouped by BIRTHPLACE_TECH, STATE=CA, COUNTY=Santa Clara (percent)

  Year                COUNTY  Count U.S._Born India China Other
1 1980 Santa Clara County CA  6,900      83.2   0.3   6.1  10.4
2 1990 Santa Clara County CA 12,993      71.8   2.4  10.1  15.7
3 2000 Santa Clara County CA 47,667      39.6  21.2  16.1  23.1
4 2010 Santa Clara County CA 52,260      28.3  34.8  15.6  21.3
5 2017 Santa Clara County CA 90,412      26.2  37.8  17.3  18.8

URL parameters (short)=
?minyear=1980&COUNTY=Santa%20Clara&geo=COUNTY&occ=Computer%20software%20developers%20(229)&group=BIRTHPLACE_TECH&sortn=4&sortdir=Ascending&mincount=100&totrows=50&color=blue2,green3,red2,orange1
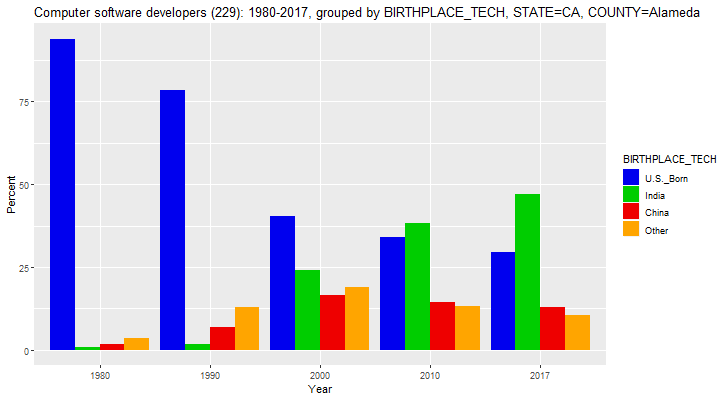
Birthplaces of Computer Software Developers in Alameda County, California, percentages, 1980-2017
Computer software developers (229): 1980-2017, grouped by BIRTHPLACE_TECH, STATE=CA, COUNTY=Alameda (percent)

  Year            COUNTY  Count U.S._Born India China Other
1 1980 Alameda County CA  2,260      93.8   0.9   1.8   3.5
2 1990 Alameda County CA  6,794      78.5   1.7   6.9  12.8
3 2000 Alameda County CA 20,473      40.5  24.1  16.6  18.9
4 2010 Alameda County CA 20,199      34.0  38.3  14.6  13.1
5 2017 Alameda County CA 39,393      29.6  47.0  12.9  10.4

URL parameters (short)=
?minyear=1980&COUNTY=Alameda&geo=COUNTY&occ=Computer%20software%20developers%20(229)&group=BIRTHPLACE_TECH&sortn=4&sortdir=Ascending&mincount=100&totrows=50&color=blue2,green3,red2,orange1
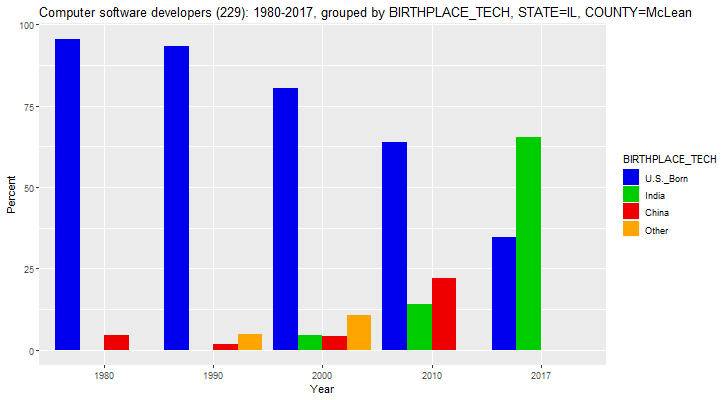
Birthplaces of Computer Software Developers in McLean County, Illinois, percentages, 1980-2017
Computer software developers (229): 1980-2017, grouped by BIRTHPLACE_TECH, STATE=IL, COUNTY=McLean (percent)

  Year           COUNTY Count U.S._Born India China Other
1 1980 McLean County IL   440      95.5    NA   4.5    NA
2 1990 McLean County IL   930      93.2    NA   1.9   4.8
3 2000 McLean County IL 1,218      80.5   4.6   4.3  10.6
4 2010 McLean County IL 1,890      63.9  14.1  22.0    NA
5 2017 McLean County IL 2,872      34.7  65.3    NA    NA

URL parameters (short)=
?minyear=1980&STATE=IL&COUNTY=McLean&geo=COUNTY&occ=Computer%20software%20developers%20(229)&group=BIRTHPLACE_TECH&sortn=4&mincount=100&color=blue2,green3,red2,orange1
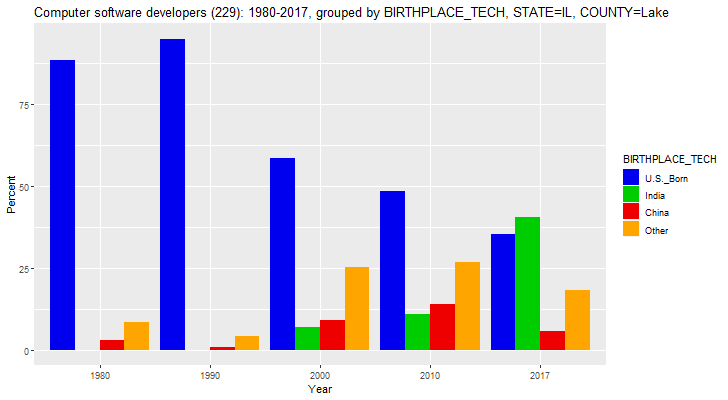
Birthplaces of Computer Software Developers in Lake County, Illinois, percentages, 1980-2017
Computer software developers (229): 1980-2017, grouped by BIRTHPLACE_TECH, STATE=IL, COUNTY=Lake (percent)

  Year         COUNTY Count U.S._Born India China Other
1 1980 Lake County IL   700      88.6    NA   2.9   8.6
2 1990 Lake County IL 1,398      94.8    NA   0.9   4.3
3 2000 Lake County IL 4,259      58.7   7.0   9.0  25.2
4 2010 Lake County IL 3,923      48.3  10.8  14.1  26.7
5 2017 Lake County IL 6,757      35.3  40.5   5.8  18.4

URL parameters (short)=
?minyear=1980&STATE=IL&COUNTY=Lake&geo=COUNTY&occ=Computer%20software%20developers%20(229)&group=BIRTHPLACE_TECH&sortn=4&mincount=100&color=blue2,green3,red2,orange1
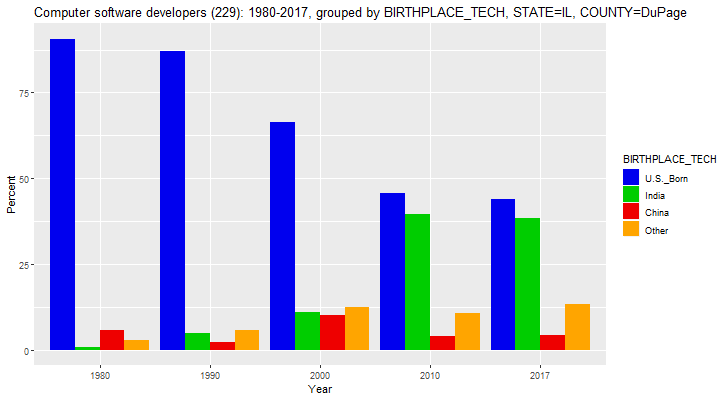
Birthplaces of Computer Software Developers in DuPage County, Illinois, percentages, 1980-2017
Computer software developers (229): 1980-2017, grouped by BIRTHPLACE_TECH, STATE=IL, COUNTY=DuPage (percent)

  Year           COUNTY  Count U.S._Born India China Other
1 1980 DuPage County IL  2,120      90.6   0.9   5.7   2.8
2 1990 DuPage County IL  5,121      86.9   5.0   2.3   5.8
3 2000 DuPage County IL 12,832      66.3  11.1  10.2  12.5
4 2010 DuPage County IL  6,459      45.6  39.7   4.1  10.6
5 2017 DuPage County IL  9,767      44.0  38.4   4.2  13.4

URL parameters (short)=
?minyear=1980&STATE=IL&COUNTY=DuPage&geo=COUNTY&occ=Computer%20software%20developers%20(229)&group=BIRTHPLACE_TECH&sortn=4&mincount=100&color=blue2,green3,red2,orange1
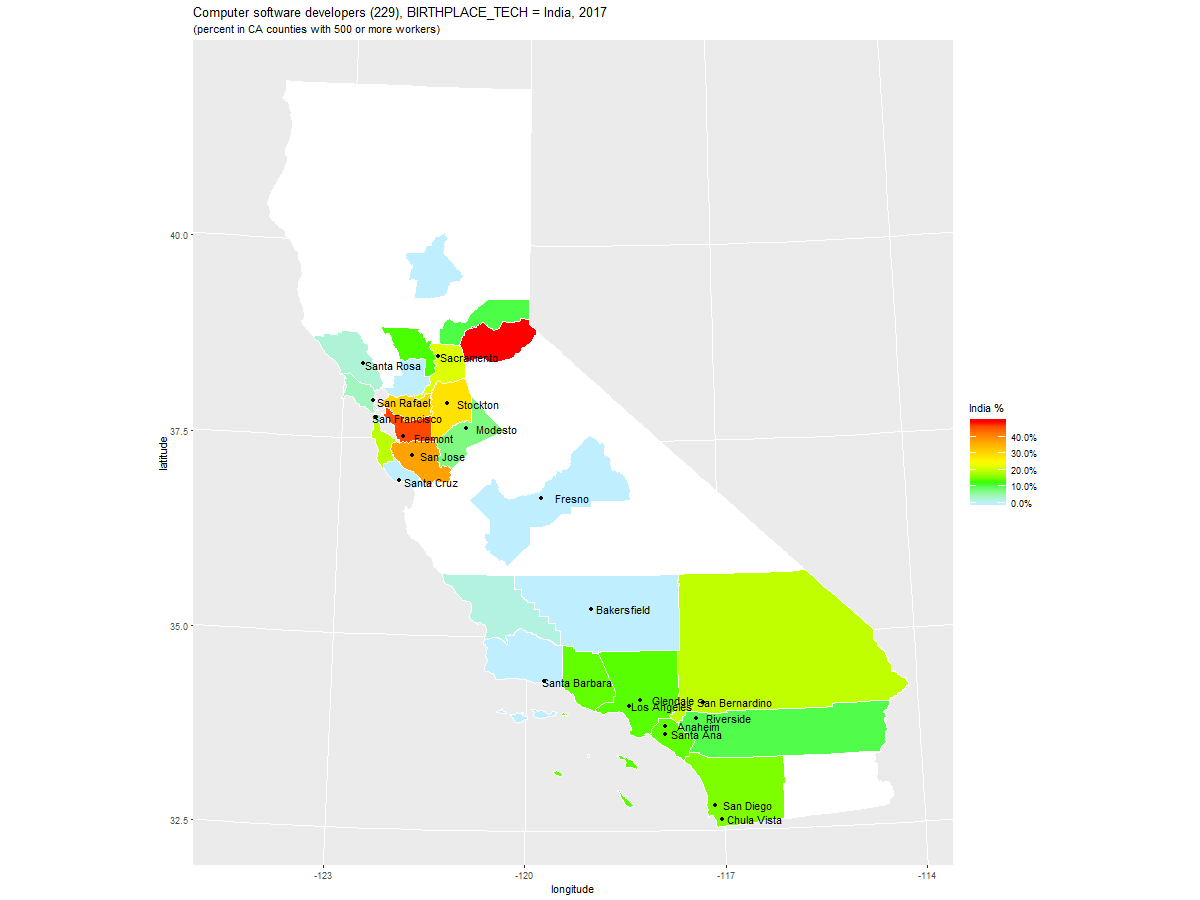
Percentage of Computer Software Developers in California by County, grouped by Birthplace, ordered by India, 2017
Computer software developers (229): 2017, grouped by BIRTHPLACE_TECH (percent)

   Year                    COUNTY  Count U.S._Born India China Other
1  2017       El Dorado County CA  1,205      50.2  49.8   0.0   0.0
2  2017         Alameda County CA 39,393      29.6  47.0  12.9  10.4
3  2017     Santa Clara County CA 90,412      26.2  37.8  17.3  18.8
4  2017    Contra Costa County CA 13,197      39.6  30.8   8.6  21.0
5  2017     San Joaquin County CA  2,148      50.7  29.0   2.4  18.0
6  2017      Sacramento County CA  9,603      61.6  22.2   2.4  13.8
7  2017  San Bernardino County CA  4,067      39.6  19.9  16.6  23.9
8  2017       San Mateo County CA 19,108      32.9  19.6  21.3  26.2
9  2017       San Diego County CA 27,569      49.0  15.8   5.1  30.1
10 2017         Ventura County CA  3,917      60.5  14.5   3.1  22.0
11 2017          Orange County CA 29,277      46.7  14.4  10.8  28.1
12 2017     Los Angeles County CA 46,009      57.5  14.1   9.0  19.4
13 2017            Yolo County CA  1,016      61.5  13.6  10.9  14.0
14 2017          Placer County CA  2,372      70.5  10.8   5.2  13.4
15 2017       Riverside County CA  5,659      64.3  10.6  10.4  14.6
16 2017      Stanislaus County CA  1,075      83.3   7.8   0.0   8.9
17 2017                      (NA)  2,529      70.6   6.6   2.5  20.3
18 2017   San Francisco County CA 25,559      61.4   5.0   7.2  26.3
19 2017           Marin County CA  1,579      65.0   4.1   0.0  30.9
20 2017          Sonoma County CA  2,689      70.8   2.6   0.0  26.7
21 2017 San Luis Obispo County CA  2,394      93.4   1.9   0.0   4.8
22 2017          Fresno County CA  1,481      59.6   0.0   0.0  40.4
23 2017            Kern County CA  1,011     100.0   0.0   0.0   0.0
24 2017   Santa Barbara County CA  2,208      89.1   0.0   0.0  10.9
25 2017      Santa Cruz County CA  2,342      72.5   0.0   5.6  21.9

URL parameters (short)=
?geo=COUNTY&occ=Computer%20software%20developers%20(229)&group=BIRTHPLACE_TECH&sortn=5&mincount=1000
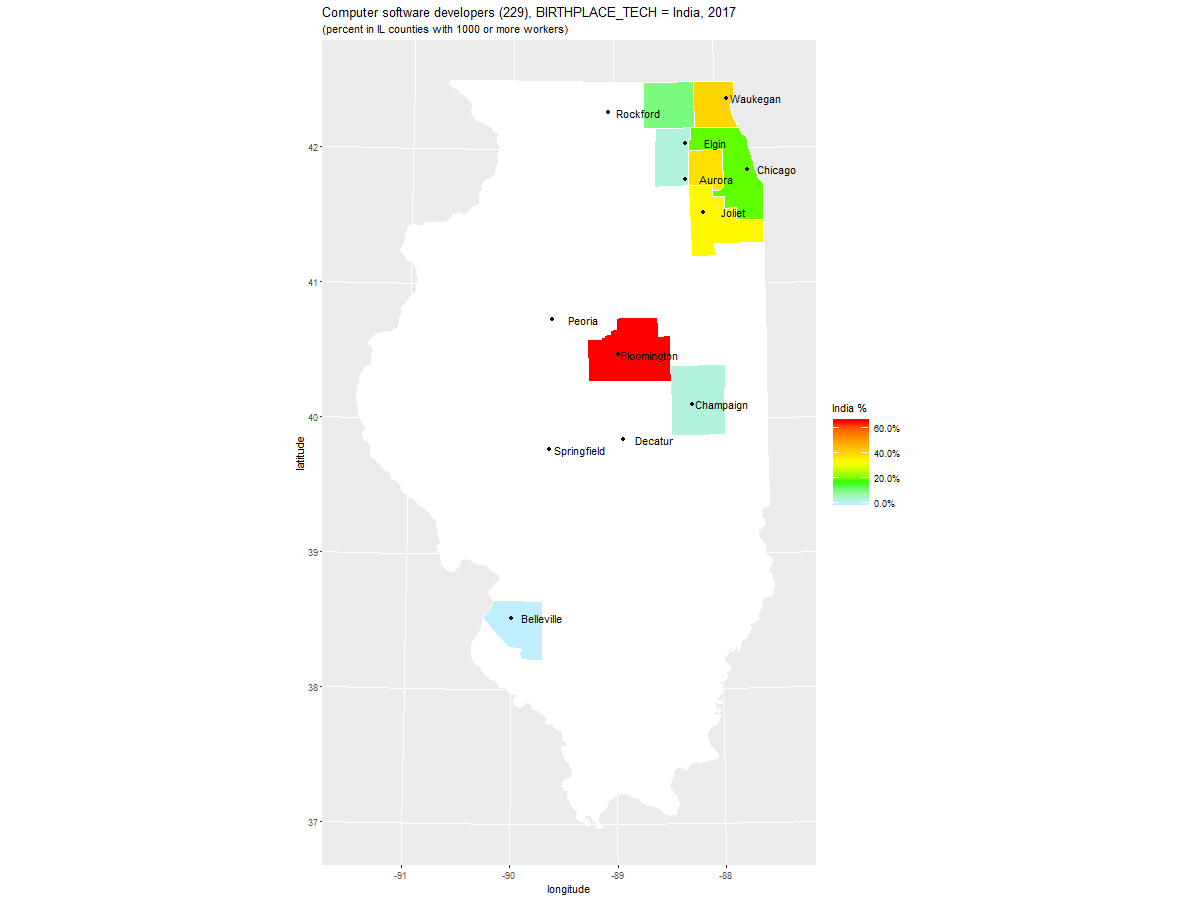
Percentage of Computer Software Developers in Illinois by County, grouped by Birthplace, ordered by India, 2017
Computer software developers (229): 2017, grouped by BIRTHPLACE_TECH (percent)

   Year              COUNTY  Count U.S._Born India China Other
1  2017    McLean County IL  2,872      34.7  65.3   0.0   0.0
2  2017      Lake County IL  6,757      35.3  40.5   5.8  18.4
3  2017    DuPage County IL  9,767      44.0  38.4   4.2  13.4
4  2017      Will County IL  3,733      44.3  34.0  12.1   9.5
5  2017      Cook County IL 28,419      62.8  18.8   4.7  13.6
6  2017   McHenry County IL  1,590      77.2  10.6   0.0  12.3
7  2017                (NA)  3,781      90.8   9.2   0.0   0.0
8  2017      Kane County IL  2,657      94.5   2.8   0.0   2.7
9  2017 Champaign County IL  2,428      72.0   2.7  20.6   4.7
10 2017 St. Clair County IL  1,372     100.0   0.0   0.0   0.0

URL parameters (short)=
?STATE=IL&geo=COUNTY&occ=Computer%20software%20developers%20(229)&group=BIRTHPLACE_TECH&sortn=5&mincount=1000
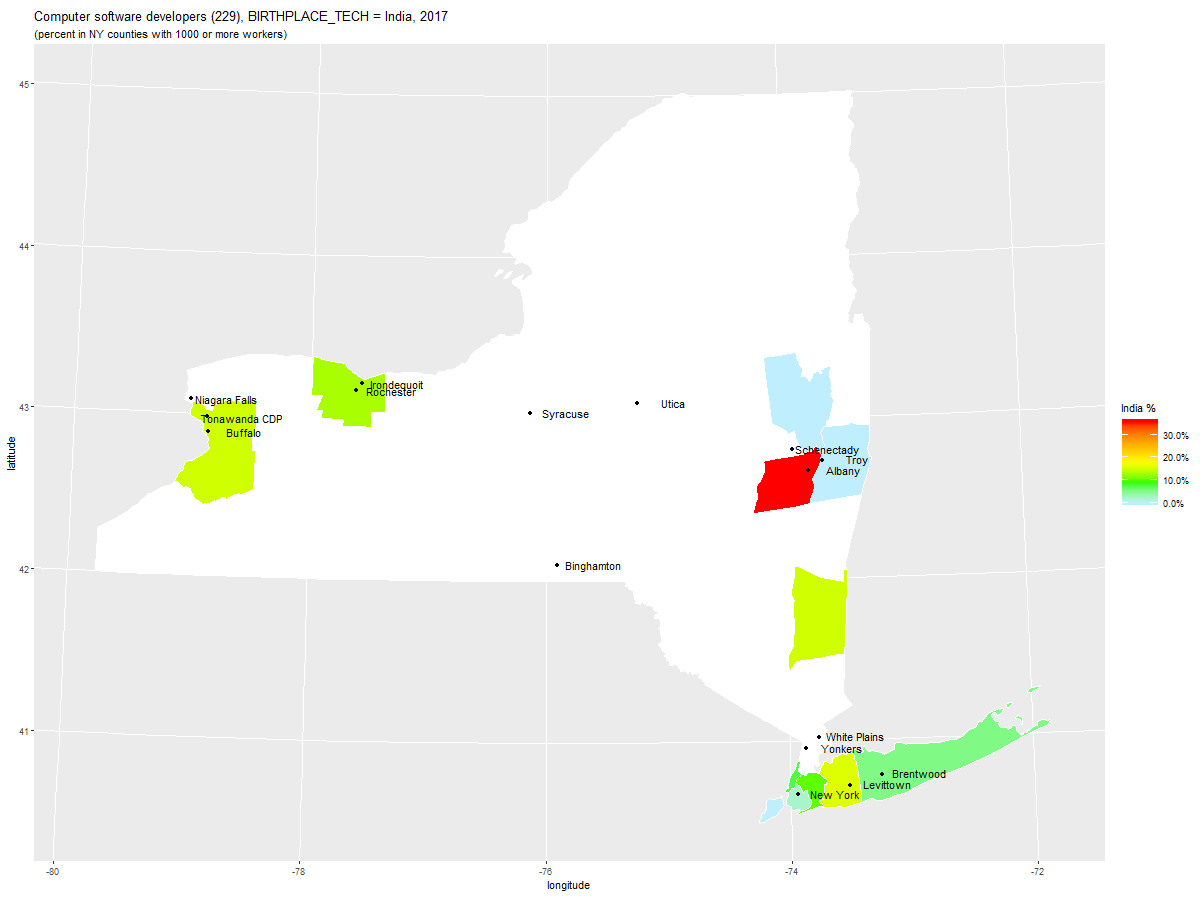
Percentage of Computer Software Developers in New York by County, grouped by Birthplace, ordered by India, 2017
Computer software developers (229): 2017, grouped by BIRTHPLACE_TECH (percent)

   Year               COUNTY  Count U.S._Born India China Other
1  2017     Albany County NY  2,301      55.8  36.1   0.0   8.1
2  2017     Nassau County NY  6,180      59.1  16.1   2.9  21.9
3  2017       Erie County NY  3,574      78.4  15.3   0.0   6.3
4  2017   Dutchess County NY  1,552      76.0  15.3   3.3   5.4
5  2017     Monroe County NY  6,009      72.2  13.3   1.2  13.3
6  2017     Queens County NY 12,032      49.1  10.4  12.8  27.7
7  2017   New York County NY 13,179      55.2   7.8   3.2  33.8
8  2017                 (NA) 17,874      79.5   5.9   3.9  10.7
9  2017    Suffolk County NY  6,851      54.0   5.5  14.3  26.2
10 2017      Kings County NY 14,519      66.1   2.3   7.7  23.8
11 2017 Rensselaer County NY  1,438      78.5   0.0   0.0  21.5
12 2017   Richmond County NY  1,966      33.5   0.0  13.5  53.0
13 2017   Saratoga County NY  1,000      72.4   0.0   0.0  27.6

URL parameters (short)=
?STATE=NY&geo=COUNTY&occ=Computer%20software%20developers%20(229)&group=BIRTHPLACE_TECH&sortn=5&mincount=1000
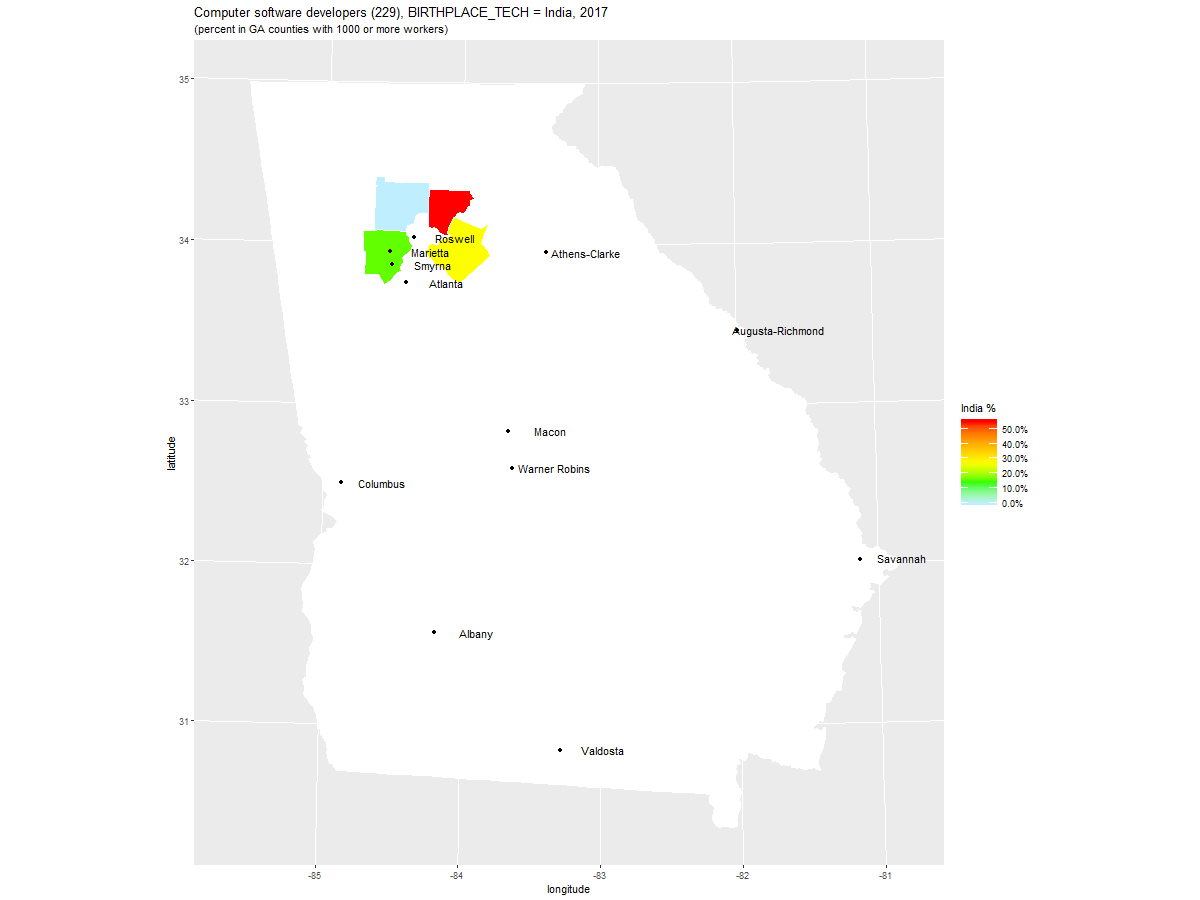
Percentage of Computer Software Developers in Georgia by County, grouped by Birthplace, ordered by India, 2017
Computer software developers (229): 2017, grouped by BIRTHPLACE_TECH (percent)

  Year             COUNTY  Count U.S._Born India China Other
1 2017  Forsyth County GA  4,449      35.1  55.4   1.3   8.2
2 2017 Gwinnett County GA  7,028      56.3  27.8   4.8  11.1
3 2017               (NA) 25,348      60.8  20.2   2.9  16.0
4 2017     Cobb County GA  6,891      60.5  16.1   4.9  18.5
5 2017 Cherokee County GA  1,790      92.3   0.0   0.0   7.7

URL parameters (short)=
?STATE=GA&geo=COUNTY&occ=Computer%20software%20developers%20(229)&group=BIRTHPLACE_TECH&sortn=5&mincount=1000