On June 12, 2019, Fortune Magazine posted an article titled The Unemployment Rate for U.S. Tech Workers Just Hit the Lowest Number Ever Recorded. That article states:
According to CompTIA, the unemployment rate for America's technology workers hit 1.3 percent in May. It's come close to touching these lows before, most recently in March, 2018 and again in April 2007, a year before the global financial crisis wreaked havoc on markets. At those moments, the rate reached 1.4 percent.
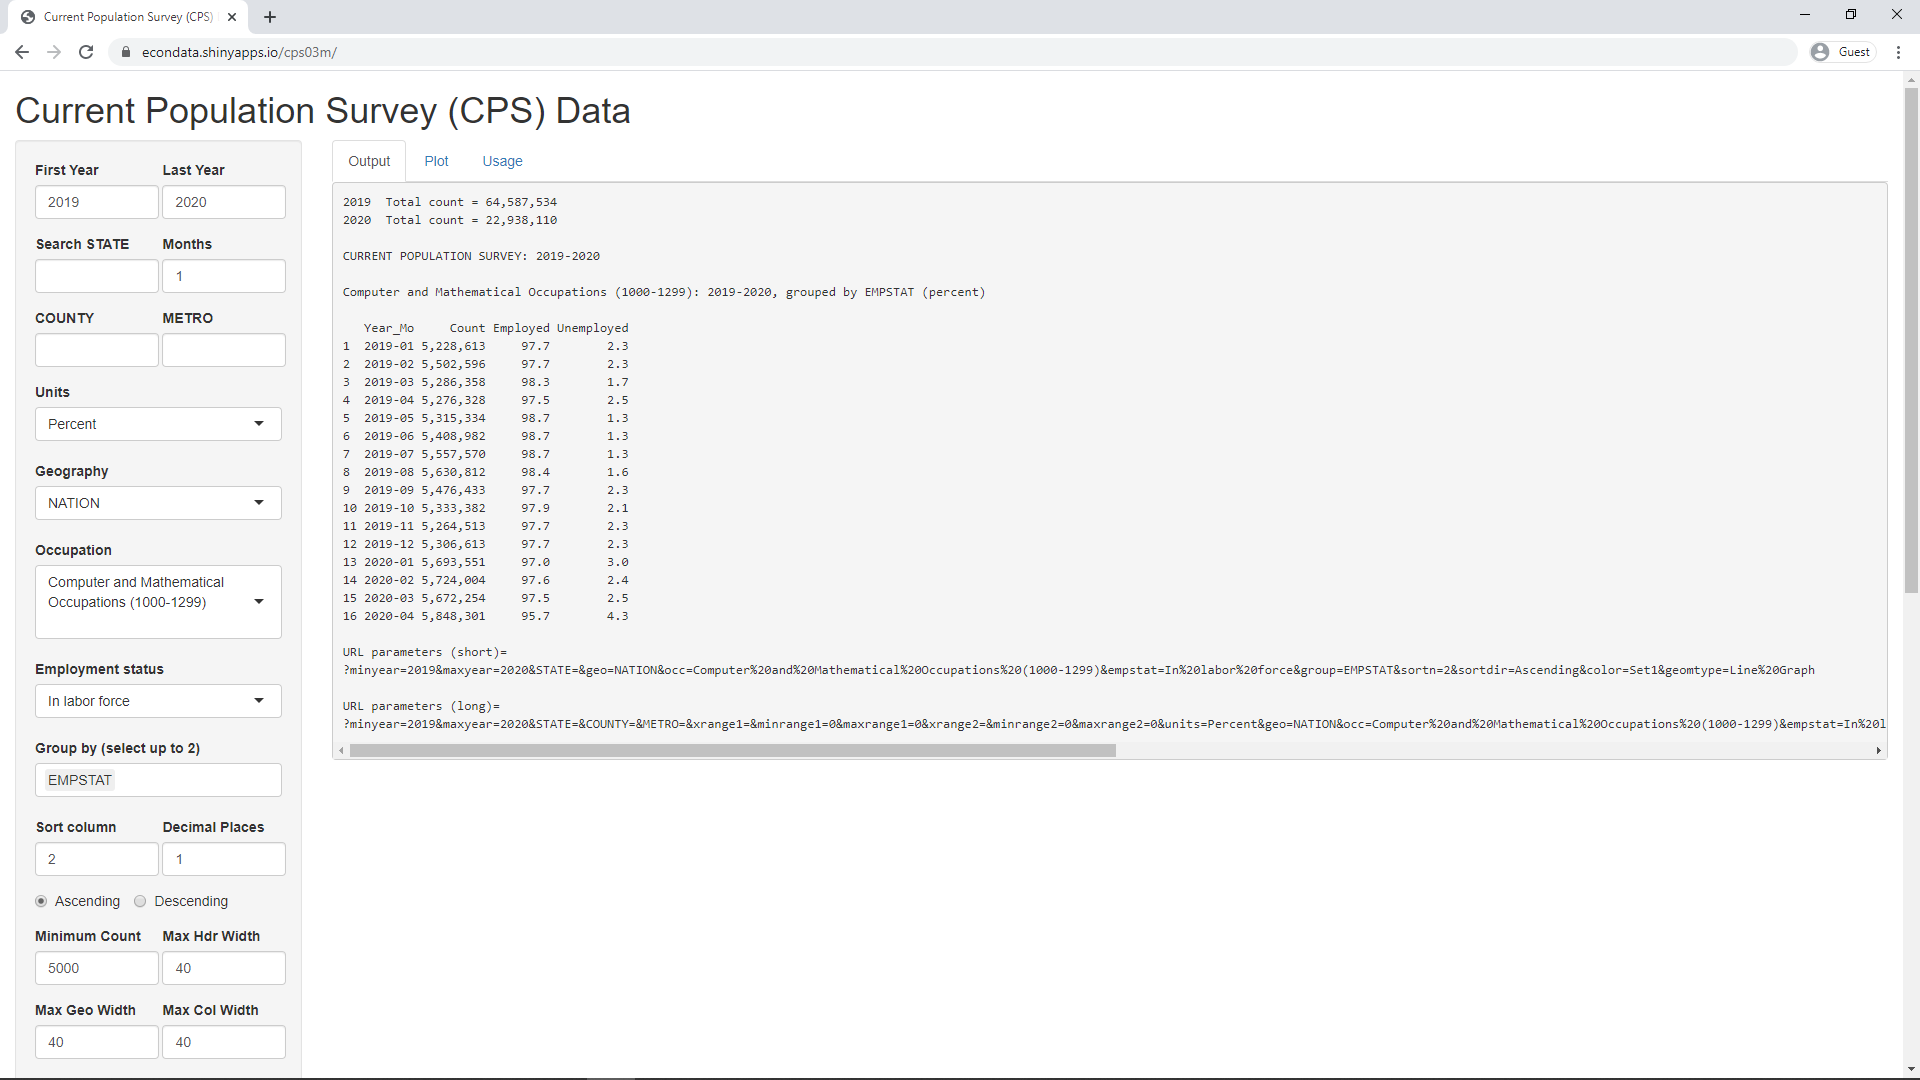
In fact, it is possible to check these numbers in the Shiny application at https://econdata.shinyapps.io/cps03m/. Going to the URL will display the following screen:
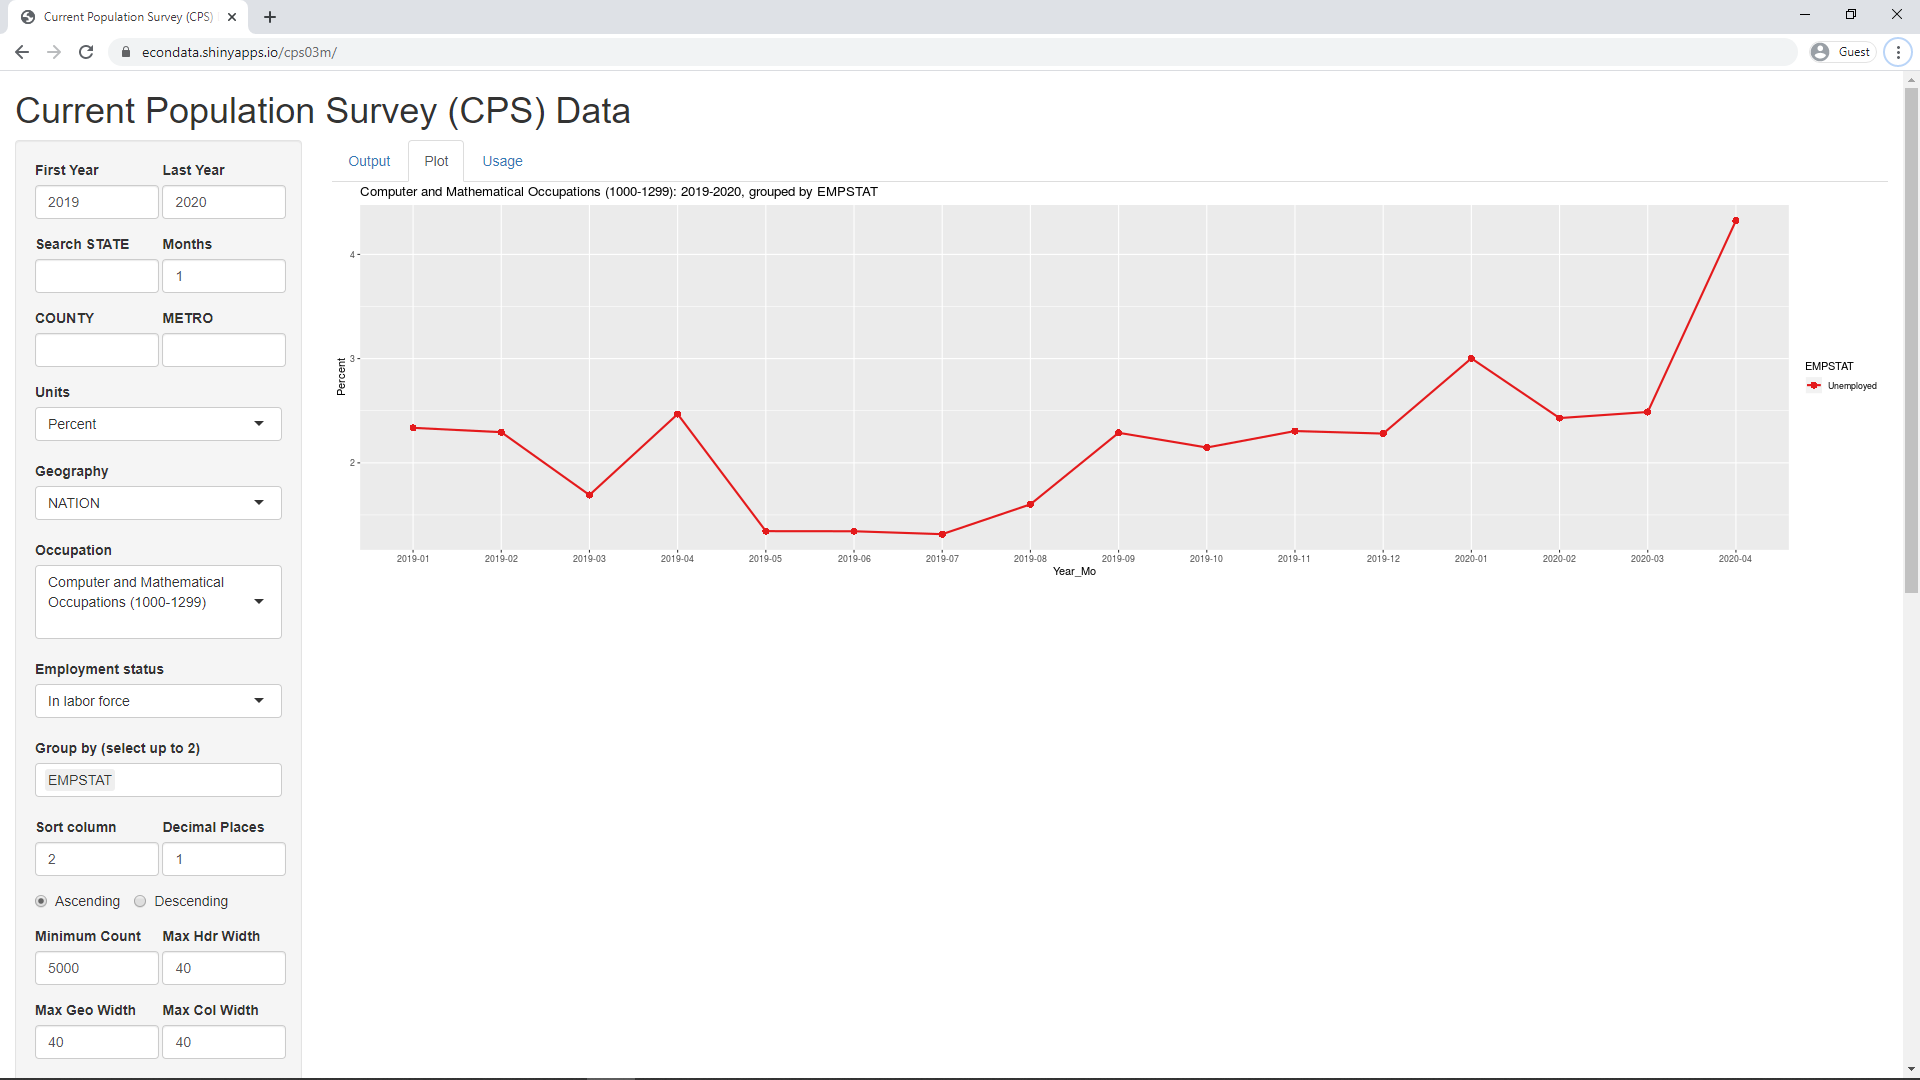
A line graph of this data can be seen by clicking on the Plot tab and ensuring that "Plot Type" (near the bottom of the left tab) is set to "Line Graph". In order to focus just on the unemployment rate, "X Min" and "X Max" are to 2 by default. This works because EMPSTAT is a factor variable in which 2 specifies "Unemployed". As a result, the following plot is displayed:
The data displayed comes from the monthly Current Population Survey (CPS) and can be obtained by going to https://cps.ipums.org/cps/, clicking "LOG IN" (signing up first, if necessary), and requesting a specific data extract. For the Shiny application, a data extract of the BASIC MONTHLY data was requested for each year from 2003 to 2020 for the following variables:
Variable    Variable Label                             Typ Dec Nov Oct Sep Aug Jul Jun May Apr Mar Feb Jan
                                                           18  18  18  18  18  18  18  18  18  18  18  18

YEAR        Survey year [preselected].................. H   X   X   X   X   X   X   X   X   X   X   X   X
SERIAL      Household serial number [preselected]...... H   X   X   X   X   X   X   X   X   X   X   X   X
MONTH       Month [preselected]........................ H   X   X   X   X   X   X   X   X   X   X   X   X
HWTFINL     Household weight, Basic Monthly [preselect] H   X   X   X   X   X   X   X   X   X   X   X   X
CPSID       CPSID, household record [preselected]...... H   X   X   X   X   X   X   X   X   X   X   X   X
ASECFLAG    Flag for ASEC [preselected]................ H   .   .   .   .   .   .   .   .   .   X   .   .
PERNUM      Person number in sample unit [preselected]. P   X   X   X   X   X   X   X   X   X   X   X   X
WTFINL      Final Basic Weight [preselected]........... P   X   X   X   X   X   X   X   X   X   X   X   X
CPSIDP      CPSID, person record [preselected]......... P   X   X   X   X   X   X   X   X   X   X   X   X
STATEFIP    State (FIPS code).......................... H   X   X   X   X   X   X   X   X   X   X   X   X
METAREA     Metropolitan area.......................... H   X   X   X   X   X   X   X   X   X   X   X   X
COUNTY      FIPS county code........................... H   X   X   X   X   X   X   X   X   X   X   X   X
AGE         Age........................................ P   X   X   X   X   X   X   X   X   X   X   X   X
SEX         Sex........................................ P   X   X   X   X   X   X   X   X   X   X   X   X
RACE        Race....................................... P   X   X   X   X   X   X   X   X   X   X   X   X
BPL         Birthplace................................. P   X   X   X   X   X   X   X   X   X   X   X   X
YRIMMIG     Year of immigration........................ P   X   X   X   X   X   X   X   X   X   X   X   X
CITIZEN     Citizenship status......................... P   X   X   X   X   X   X   X   X   X   X   X   X
HISPAN      Hispanic origin............................ P   X   X   X   X   X   X   X   X   X   X   X   X
EMPSTAT     Employment status.......................... P   X   X   X   X   X   X   X   X   X   X   X   X
OCC         Occupation................................. P   X   X   X   X   X   X   X   X   X   X   X   X
OCC1990     Occupation, 1990 basis..................... P   X   X   X   X   X   X   X   X   X   X   X   X
CLASSWKR    Class of worker............................ P   X   X   X   X   X   X   X   X   X   X   X   X
UHRSWORKT   Hours usually worked per week at all jobs.. P   X   X   X   X   X   X   X   X   X   X   X   X
AHRSWORKT   Hours worked last week..................... P   X   X   X   X   X   X   X   X   X   X   X   X
DURUNEMP    Continuous weeks unemployed................ P   X   X   X   X   X   X   X   X   X   X   X   X
WHYUNEMP    Reason for unemployment.................... P   X   X   X   X   X   X   X   X   X   X   X   X
WHYPTLWK    Reason for working part time last week..... P   X   X   X   X   X   X   X   X   X   X   X   X
WNLOOK      Reason not looking for work last 4 weeks... P   X   X   X   X   X   X   X   X   X   X   X   X
WKSTAT      Full or part time status................... P   X   X   X   X   X   X   X   X   X   X   X   X
EDUC        Educational attainment recode.............. P   X   X   X   X   X   X   X   X   X   X   X   X
As can be seen in the above screenshots, the unemployment rate for Computer and Mathematical Occupations in May matches the "unemployment rate for America's technology workers" given in the article. However, the table and graph show that there is a fair amount of noise in the data as it was 2.5 percent in the prior month and the unemployment rate has bounced between these two numbers in 2019. In any event, it has now more than tripled to 4.3 after the first full month of the COVID-19 economic shutdown.
Following are the graph and numbers shown in the above screenshots. The graph has been narrowed by narrowing the browser window and the labeling on the x-axis has been changed to every 3 months by changing X Step to 3. In addition, the y-scale has been changed by setting Y Min, Y Max, and Y Step to 0, 5, and 1, respectively.
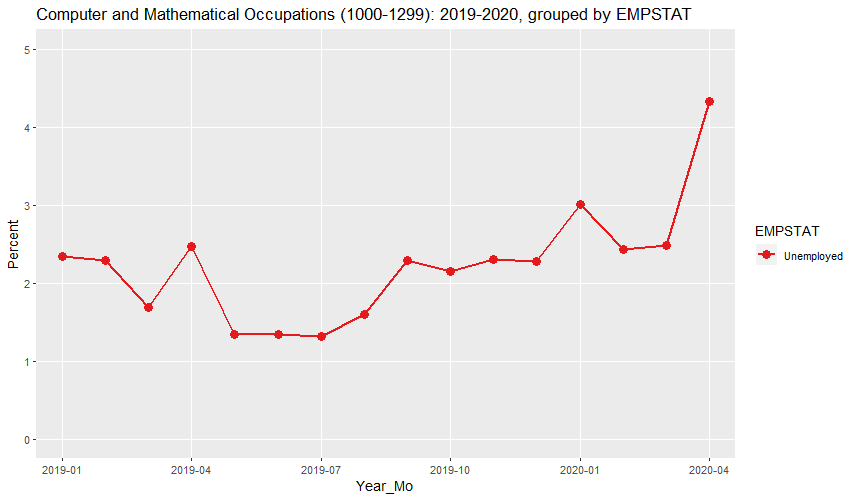
Computer and Mathematical Occupations (1000-1299): 2019-2020, grouped by EMPSTAT (percent)

   Year_Mo     Count Employed Unemployed
1  2019-01 5,228,613     97.7        2.3
2  2019-02 5,502,596     97.7        2.3
3  2019-03 5,286,358     98.3        1.7
4  2019-04 5,276,328     97.5        2.5
5  2019-05 5,315,334     98.7        1.3
6  2019-06 5,408,982     98.7        1.3
7  2019-07 5,557,570     98.7        1.3
8  2019-08 5,630,812     98.4        1.6
9  2019-09 5,476,433     97.7        2.3
10 2019-10 5,333,382     97.9        2.1
11 2019-11 5,264,513     97.7        2.3
12 2019-12 5,306,613     97.7        2.3
13 2020-01 5,693,551     97.0        3.0
14 2020-02 5,724,004     97.6        2.4
15 2020-03 5,672,254     97.5        2.5
16 2020-04 5,848,301     95.7        4.3

URL parameters (short)=
?minyear=2019&maxyear=2020&STATE=&geo=NATION&occ=Computer%20and%20Mathematical%20Occupations%20(1000-1299)&empstat=In%20labor%20force&group=EMPSTAT&sortn=2&sortdir=Ascending&ymax=3&color=Set1&geomtype=Line%20Graph
Following are the graph and numbers for Healthcare Practitioners and Technical Occupations. As can be seen, unemployment shot up to 6.8 percent in April for these occupations.
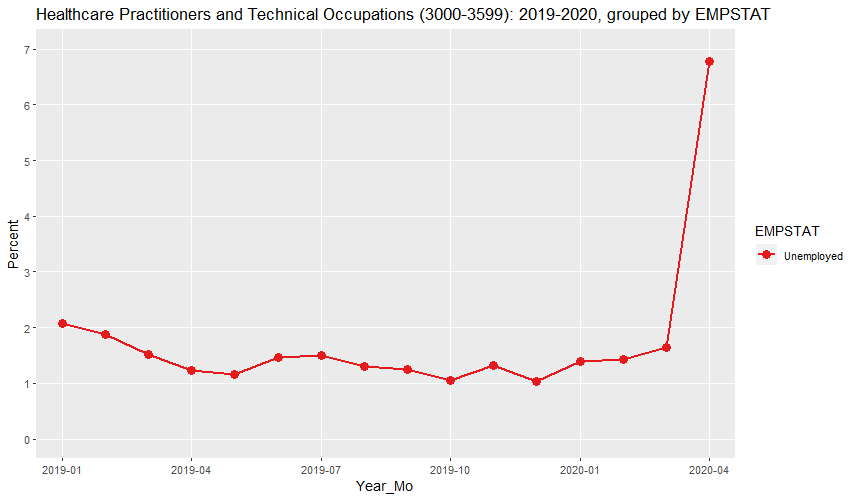
Healthcare Practitioners and Technical Occupations (3000-3599): 2019-2020, grouped by EMPSTAT (percent)

   Year_Mo      Count Employed Unemployed
1  2019-01  9,716,928     97.9        2.1
2  2019-02  9,695,656     98.1        1.9
3  2019-03  9,483,037     98.5        1.5
4  2019-04  9,512,312     98.8        1.2
5  2019-05  9,531,083     98.8        1.2
6  2019-06  9,620,787     98.5        1.5
7  2019-07  9,698,598     98.5        1.5
8  2019-08  9,687,416     98.7        1.3
9  2019-09  9,797,626     98.7        1.3
10 2019-10  9,940,185     98.9        1.1
11 2019-11 10,185,009     98.7        1.3
12 2019-12 10,248,156     99.0        1.0
13 2020-01  9,846,093     98.6        1.4
14 2020-02  9,973,039     98.6        1.4
15 2020-03  9,866,440     98.4        1.6
16 2020-04  9,568,774     93.2        6.8

URL parameters (short)=
?minyear=2019&maxyear=2020&STATE=&geo=NATION&occ=Healthcare%20Practitioners%20and%20Technical%20Occupations%20(3000-3599)&empstat=In%20labor%20force&group=EMPSTAT&sortn=2&sortdir=Ascending&ymax=3&color=Set1&geomtype=Line%20Graph
Following are the graph and numbers for Healthcare Support Occupations. As can be seen, unemployment shot up to an even higher 12.3 percent in April for these occupations.
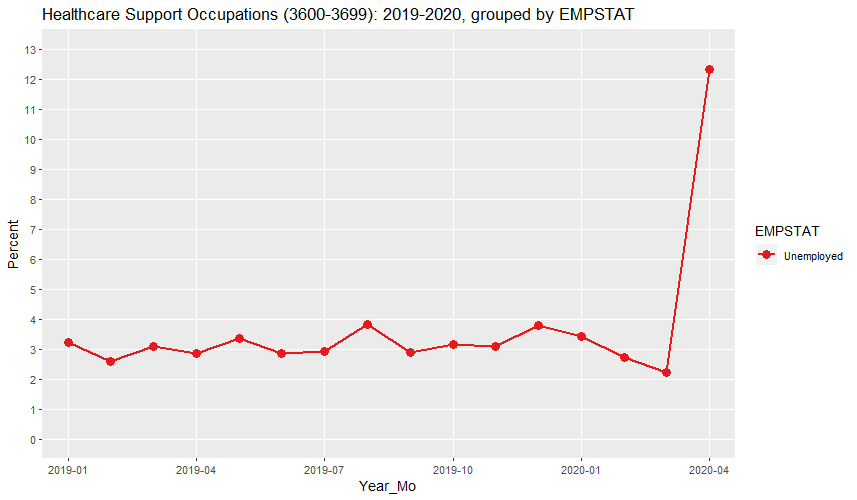
Healthcare Support Occupations (3600-3699): 2019-2020, grouped by EMPSTAT (percent)

   Year_Mo     Count Employed Unemployed
1  2019-01 3,738,726     96.8        3.2
2  2019-02 3,668,710     97.4        2.6
3  2019-03 3,639,606     96.9        3.1
4  2019-04 3,674,815     97.2        2.8
5  2019-05 3,882,564     96.7        3.3
6  2019-06 4,009,715     97.1        2.9
7  2019-07 3,910,944     97.1        2.9
8  2019-08 3,888,690     96.2        3.8
9  2019-09 3,889,002     97.1        2.9
10 2019-10 3,843,072     96.9        3.1
11 2019-11 3,918,312     96.9        3.1
12 2019-12 3,852,033     96.2        3.8
13 2020-01 5,197,351     96.6        3.4
14 2020-02 5,162,305     97.3        2.7
15 2020-03 5,077,933     97.8        2.2
16 2020-04 4,835,829     87.7       12.3

URL parameters (short)=
?minyear=2019&maxyear=2020&STATE=&geo=NATION&occ=Healthcare%20Support%20Occupations%20(3600-3699)&empstat=In%20labor%20force&group=EMPSTAT&sortn=2&sortdir=Ascending&ymax=3&color=Set1&geomtype=Line%20Graph
Much of the rise in the unemployment of Healthcare Practitioners and Technical Occupations and Healthcare Support Occupations may have been due to a reported drop in elective medical procedures and the hesitancy of some people to go to the hospital during the COVID-19 pandemic. Focusing on occupations most involved in COVID-19 treatment, following are the graph and numbers for Physicians and surgeons. As can be seen, unemployment rose just slightly, up to 2.2 percent in March but moderating a bit to 1.6 percent in April.
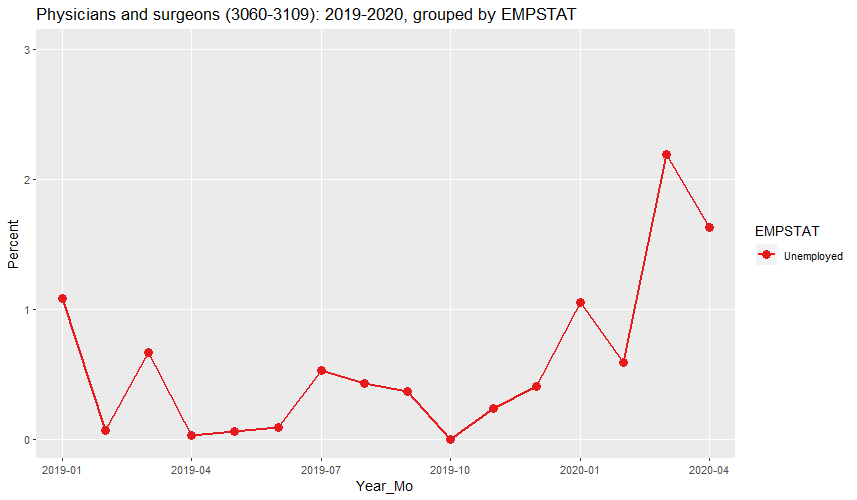
Physicians and surgeons (3060-3109): 2019-2020, grouped by EMPSTAT (percent)

   Year_Mo       Count Employed Unemployed
1  2019-01 1,136,184.0     98.9        1.1
2  2019-02 1,058,024.3     99.9        0.1
3  2019-03 1,047,743.7     99.3        0.7
4  2019-04 1,077,498.8    100.0        0.0
5  2019-05 1,082,870.9     99.9        0.1
6  2019-06 1,013,312.8     99.9        0.1
7  2019-07   997,245.8     99.5        0.5
8  2019-08   937,640.8     99.6        0.4
9  2019-09 1,093,179.8     99.6        0.4
10 2019-10 1,200,662.6    100.0        0.0
11 2019-11 1,269,243.5     99.8        0.2
12 2019-12 1,339,848.6     99.6        0.4
13 2020-01   612,214.8     98.9        1.1
14 2020-02   633,129.3     99.4        0.6
15 2020-03   635,852.8     97.8        2.2
16 2020-04   565,251.9     98.4        1.6

URL parameters (short)=
?minyear=2019&maxyear=2020&STATE=&geo=NATION&occ=Physicians%20and%20surgeons%20(3060-3109)&empstat=In%20labor%20force&group=EMPSTAT&sortn=2&sortdir=Ascending&ymax=3&color=Set1&geomtype=Line%20Graph
Following are the graph and numbers for Registered nurses. As can be seen, unemployment more than tripled to 4.4 percent in April for registered nurses.
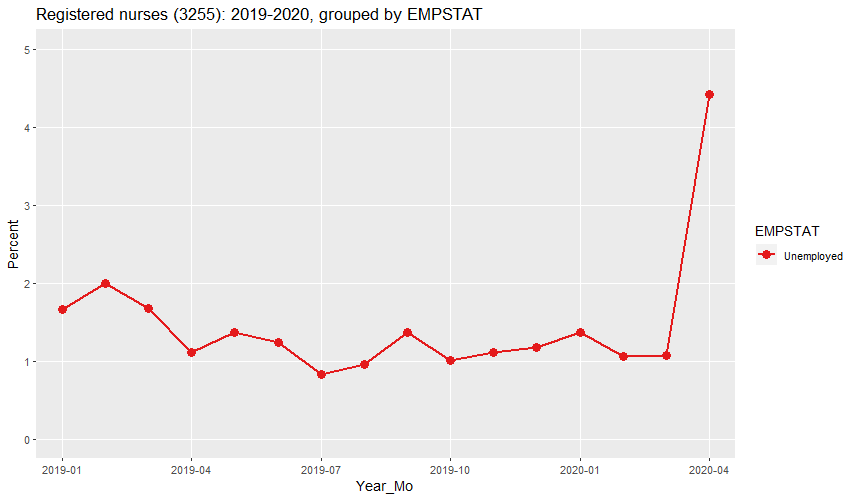
Registered nurses (3255): 2019-2020, grouped by EMPSTAT (percent)

   Year_Mo     Count Employed Unemployed
1  2019-01 3,270,198     98.3        1.7
2  2019-02 3,286,610     98.0        2.0
3  2019-03 3,207,111     98.3        1.7
4  2019-04 3,229,581     98.9        1.1
5  2019-05 3,204,524     98.6        1.4
6  2019-06 3,313,793     98.8        1.2
7  2019-07 3,420,072     99.2        0.8
8  2019-08 3,343,853     99.0        1.0
9  2019-09 3,141,691     98.6        1.4
10 2019-10 3,329,873     99.0        1.0
11 2019-11 3,293,259     98.9        1.1
12 2019-12 3,352,799     98.8        1.2
13 2020-01 3,256,131     98.6        1.4
14 2020-02 3,212,302     98.9        1.1
15 2020-03 3,135,398     98.9        1.1
16 2020-04 3,205,211     95.6        4.4

URL parameters (short)=
?minyear=2019&maxyear=2020&STATE=&geo=NATION&occ=Registered%20nurses%20(3255)&empstat=In%20labor%20force&group=EMPSTAT&sortn=2&sortdir=Ascending&ymax=3&color=Set1&geomtype=Line%20Graph
According to Table 8B on page 13 of "Characteristics of H-1B Specialty Occupation Workers, Fiscal Year 2019 Annual Report to Congress", about two-thirds of H-1B petitions in 2018 and 2019 were for computer-related jobs. As shown above, the unemployment rate for Computer and Mathematical Occupations rose to 4.3 percent in April. The second largest group listed in Table 8B is Occupations in Architecture, Engineering, and Surveying at about 10 percent of all petitions. Following are the graph and numbers for Architecture and Engineering Occupations. As can be seen, unemployment more than doubled tp 5.8 percent in April.
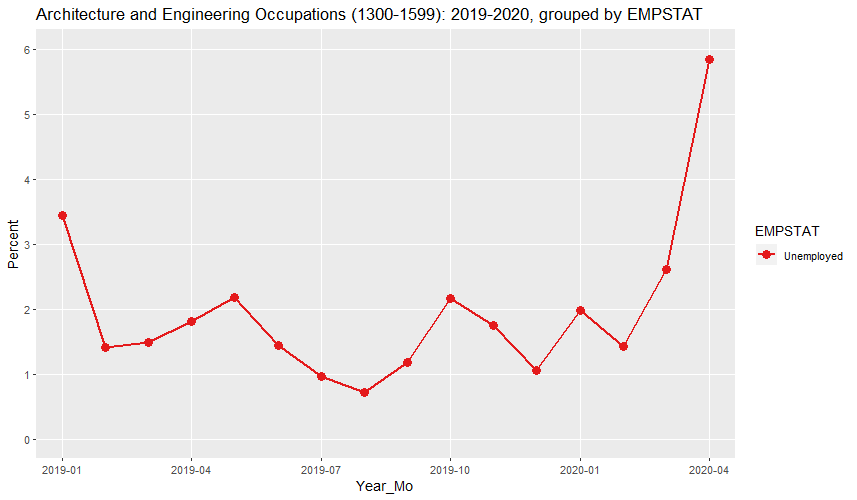
Architecture and Engineering Occupations (1300-1599): 2019-2020, grouped by EMPSTAT (percent)

   Year_Mo     Count Employed Unemployed
1  2019-01 3,528,294     96.6        3.4
2  2019-02 3,418,770     98.6        1.4
3  2019-03 3,495,458     98.5        1.5
4  2019-04 3,310,844     98.2        1.8
5  2019-05 3,363,450     97.8        2.2
6  2019-06 3,304,687     98.6        1.4
7  2019-07 3,261,220     99.0        1.0
8  2019-08 3,158,600     99.3        0.7
9  2019-09 3,263,794     98.8        1.2
10 2019-10 3,231,854     97.8        2.2
11 2019-11 3,251,366     98.3        1.7
12 2019-12 3,245,272     99.0        1.0
13 2020-01 3,233,359     98.0        2.0
14 2020-02 3,309,736     98.6        1.4
15 2020-03 3,322,289     97.4        2.6
16 2020-04 3,187,741     94.2        5.8

URL parameters (short)=
?minyear=2019&maxyear=2020&STATE=&geo=NATION&occ=Architecture%20and%20Engineering%20Occupations%20(1300-1599)&empstat=In%20labor%20force&group=EMPSTAT&sortn=2&sortdir=Ascending&color=Set1&geomtype=Line%20Graph
The above data would suggest that most of the jobs for which H-1B visas are targeted are in occupations in which unemployment has increased sharply due to COVID-19. It would therefore seem reasonable to severely limit any new petitions, at least until this situation has reversed.