On May 18, 2020, Forbes Magazine posted an article by Stuart Anderson titled Low Unemployment Rate In Tech Harms Trump H-1B Visa Plans. That article begins:
Trump administration efforts to impose new H-1B visa restrictions face a surprising obstacle - the low unemployment rate among professionals in computer occupations in the United States. Trump officials hoped to use the current economic downturn to impose more immigration restrictions, but new data show the unemployment rate for individuals in computer occupations declined from 3% in January 2020 to 2.8% in April 2020, according to an analysis of the Bureau of Labor Statistics' Current Population Survey by the National Foundation for American Policy (NFAP).
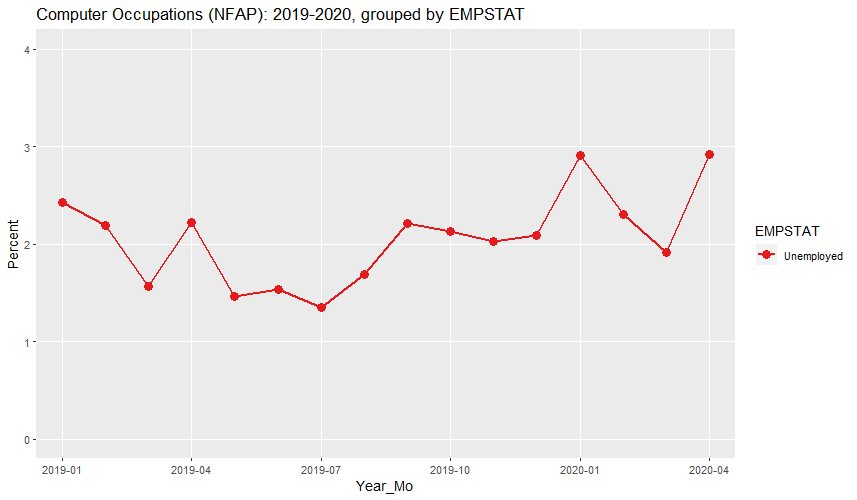
The excerpt above links to this NFAP analysis. Under table 1 is listed the source for the 3.0 and 2.8 percent numbers and lists the precise occupations included in "Computer Occupations". It is possible to reproduce these exact same occupations in the Shiny application. Following are the results:
CURRENT POPULATION SURVEY: 2019-2020

Computer Occupations (NFAP): 2019-2020, grouped by EMPSTAT (percent)

   Year_Mo     Count Employed Unemployed
1  2019-01 5,105,633    97.57       2.43
2  2019-02 5,376,182    97.81       2.19
3  2019-03 5,242,692    98.44       1.56
4  2019-04 5,187,993    97.78       2.22
5  2019-05 5,356,022    98.54       1.46
6  2019-06 5,325,730    98.47       1.53
7  2019-07 5,448,052    98.65       1.35
8  2019-08 5,511,756    98.31       1.69
9  2019-09 5,348,121    97.78       2.22
10 2019-10 5,208,288    97.87       2.13
11 2019-11 5,176,783    97.97       2.03
12 2019-12 5,175,842    97.91       2.09
13 2020-01 5,439,331    97.09       2.91
14 2020-02 5,515,825    97.70       2.30
15 2020-03 5,675,447    98.09       1.91
16 2020-04 5,825,750    97.08       2.92

URL parameters (short)=
?minyear=2019&maxyear=2020&STATE=&geo=NATION&occ=Computer%20Occupations%20(NFAP)&empstat=In%20labor%20force&group=EMPSTAT&sortn=2&sortdir=Ascending&decplaces=2&color=Set1&geomtype=Line%20Graph
As can be seen, the analysis appears to carefully cherry-pick January 2020 as the comparison month. In addition, Stuart Anderson's numbers differ slightly from those above. (Note: the reason for this difference was discovered and explained in the next section.) It shows that, even using the exact same occupations as the NFAP analysis, the unemployment rate was actually slightly higher at 2.92 percent in April 2020 versus 2.91 percent in January 2020. More importantly, the graph shows that the January 2020 date appears to have been carefully cherry-picked. As can be seen, January 2020 had the highest unemployment rate of any month from at least January of 2019 to March of 2020. The NFAP analysis makes absolutely no mention of this.
One other possible issue is that the occupations used in the NFAP analysis include "Computer and information systems manager". It's likely that very few of H-1B workers are in this occupation. Only 2.3 percent of the petitions listed in Table 8B on page 13 of "Characteristics of H-1B Specialty Occupation Workers, Fiscal Year 2019 Annual Report to Congress" are explicitly marked as being for managers. In any event, it would make perfect sense that the non-manager workers would be the first workers to be laid off due to the COVID-19 pandemic. Following are the unemployment numbers if managers are excluded:
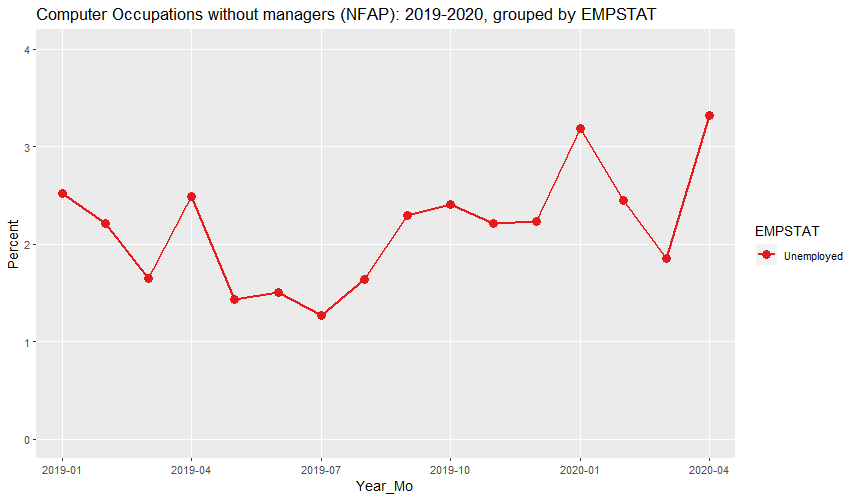
CURRENT POPULATION SURVEY: 2019-2020

Computer Occupations without managers (NFAP): 2019-2020, grouped by EMPSTAT (percent)

   Year_Mo     Count Employed Unemployed
1  2019-01 4,514,726    97.48       2.52
2  2019-02 4,749,145    97.79       2.21
3  2019-03 4,643,742    98.35       1.65
4  2019-04 4,561,826    97.51       2.49
5  2019-05 4,686,270    98.57       1.43
6  2019-06 4,697,355    98.49       1.51
7  2019-07 4,761,931    98.73       1.27
8  2019-08 4,747,817    98.36       1.64
9  2019-09 4,632,263    97.71       2.29
10 2019-10 4,526,129    97.59       2.41
11 2019-11 4,514,026    97.79       2.21
12 2019-12 4,480,388    97.77       2.23
13 2020-01 4,771,495    96.82       3.18
14 2020-02 4,803,369    97.56       2.44
15 2020-03 4,892,415    98.15       1.85
16 2020-04 5,021,247    96.68       3.32

URL parameters (short)=
?minyear=2019&maxyear=2020&STATE=&geo=NATION&occ=Computer%20Occupations%20without%20managers%20(NFAP)&empstat=In%20labor%20force&group=EMPSTAT&sortn=2&sortdir=Ascending&decplaces=2&color=Set1&geomtype=Line%20Graph
As can be seen, the unemployment rate is now a bit higher, having risen from 3.18 percent in January 2020 to 3.32 percent in April of 2020.
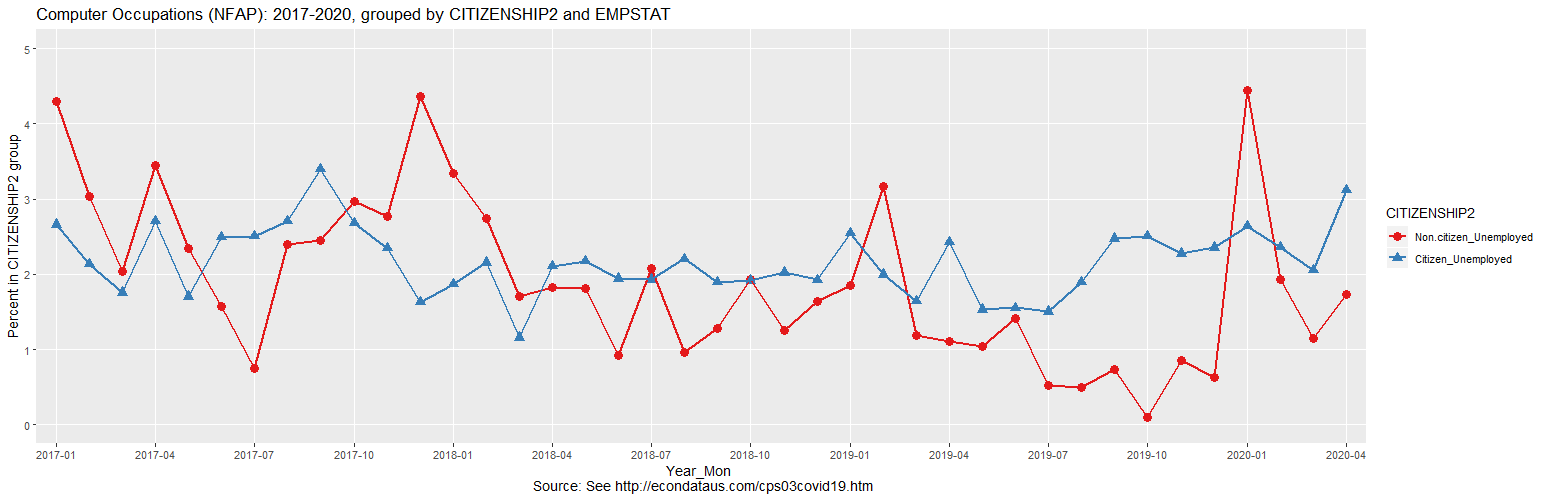
In investigating the reason that unemployment peaked in January 2020, something else became evident. There have recently been a number of newspaper articles about laid-off H-1B visa holders. For example, a May 12th New York Times article was titled They Lost Their Jobs. Now They May Have to Leave the U.S.. This in itself seems to contradict the Stu Anderson's contention that the unemployment rate in tech is dropping. In any case, the CPS data does contain citizenship status. The following graph and table show the unemployment rates of the occupations looked at by NFAP, split by citizenship status.
CURRENT POPULATION SURVEY: 2017-2020

Computer Occupations (NFAP): 2017-2020, grouped by CITIZENSHIP2 and EMPSTAT (percent in CITIZENSHIP2 group)

                                Percent Unemployed                           Count Unemployed
                     -----------------------------------------  ------------------------------------------
   Year_Mo     Count Non.citizen_Unemployed Citizen_Unemployed   Non.citizen_Unemployed Citizen_Unemployed
1  2017-01 4,984,804                    4.3                2.7               33,527.881         111,839.79
2  2017-02 4,884,569                    3.0                2.1               23,073.665          87,889.66
3  2017-03 4,827,375                    2.0                1.8               14,783.143          71,974.11
4  2017-04 4,891,954                    3.4                2.7               25,029.396         112,632.23
5  2017-05 4,838,841                    2.3                1.7               17,483.693          69,662.78
6  2017-06 4,799,142                    1.6                2.5               12,606.470          99,736.74
7  2017-07 4,693,026                    0.7                2.5                5,453.648          99,176.51
8  2017-08 4,829,429                    2.4                2.7               18,702.965         109,555.26
9  2017-09 4,871,080                    2.4                3.4               18,343.915         140,054.46
10 2017-10 4,913,458                    3.0                2.7               20,487.493         113,193.37
11 2017-11 5,008,906                    2.8                2.3               19,724.613         100,889.62
12 2017-12 5,065,524                    4.4                1.6               28,465.368          71,736.51
13 2018-01 5,092,995                    3.3                1.9               25,026.121          81,085.06
14 2018-02 5,293,158                    2.7                2.2               22,414.838          96,443.16
15 2018-03 5,256,627                    1.7                1.2               14,352.817          51,084.89
16 2018-04 5,099,725                    1.8                2.1               14,628.887          90,750.23
17 2018-05 5,133,953                    1.8                2.2               15,277.811          93,137.40
18 2018-06 5,062,406                    0.9                1.9                7,326.142          82,869.29
19 2018-07 5,057,976                    2.1                1.9               17,337.156          81,382.39
20 2018-08 5,110,765                    1.0                2.2                8,525.532          93,067.26
21 2018-09 4,948,750                    1.3                1.9               10,777.401          77,851.48
22 2018-10 5,082,571                    1.9                1.9               15,449.240          81,930.87
23 2018-11 5,085,295                    1.3                2.0               10,057.227          86,525.78
24 2018-12 5,168,445                    1.6                1.9               13,497.875          83,613.88
25 2019-01 5,105,633                    1.9                2.5               15,531.565         108,645.45
26 2019-02 5,376,182                    3.2                2.0               28,677.721          89,174.00
27 2019-03 5,242,692                    1.2                1.6               10,056.712          71,974.07
28 2019-04 5,187,993                    1.1                2.4                8,813.088         106,330.78
29 2019-05 5,356,022                    1.0                1.5                8,090.813          70,035.18
30 2019-06 5,325,730                    1.4                1.6               12,365.930          69,145.43
31 2019-07 5,448,052                    0.5                1.5                4,318.273          69,367.35
32 2019-08 5,511,756                    0.5                1.9                4,038.619          89,188.60
33 2019-09 5,348,121                    0.7                2.5                5,701.291         112,850.34
34 2019-10 5,208,288                    0.1                2.5                  827.926         110,225.61
35 2019-11 5,176,783                    0.9                2.3                7,639.578          97,283.81
36 2019-12 5,175,842                    0.6                2.4                5,037.152         103,176.08
37 2020-01 5,439,331                    4.4                2.6               36,614.497         121,826.71
38 2020-02 5,515,825                    1.9                2.4               14,875.878         112,050.82
39 2020-03 5,675,447                    1.1                2.1                9,958.555          98,667.30
40 2020-04 5,825,750                    1.7                3.1               14,738.768         155,083.93

URL parameters (short)=
?maxyear=2020&STATE=&units=Percent%20in%20group&geo=NATION&occ=Computer%20Occupations%20(NFAP)&empstat=In%20labor%20force&group=CITIZENSHIP2|EMPSTAT&sortn=2&sortdir=Ascending&ymax=5&color=Set1&geomtype=Line%20Graph
As can be seen, the spike in unemployment in January was chiefly among non-citizens. In fact, extending the timeline of the graph back through 2017 reveals that there seems to have been a peak near the beginning of each year since then. The peak was in December of 2017, and February of 2019, both within one month of January. This would seem to merit further investigation. In any event, this would indicate that it would be very misleading to use January 2020 as an indication of the unemployment level of U.S. citizens in computer occupations. At 3.1 percent, their unemployment rate in April of 2020 was the highest level since it reached 3.4 percent in September of 2017. In addition, the table above shows that over 50,000 U.S. computer workers appear to have lost their jobs in April.
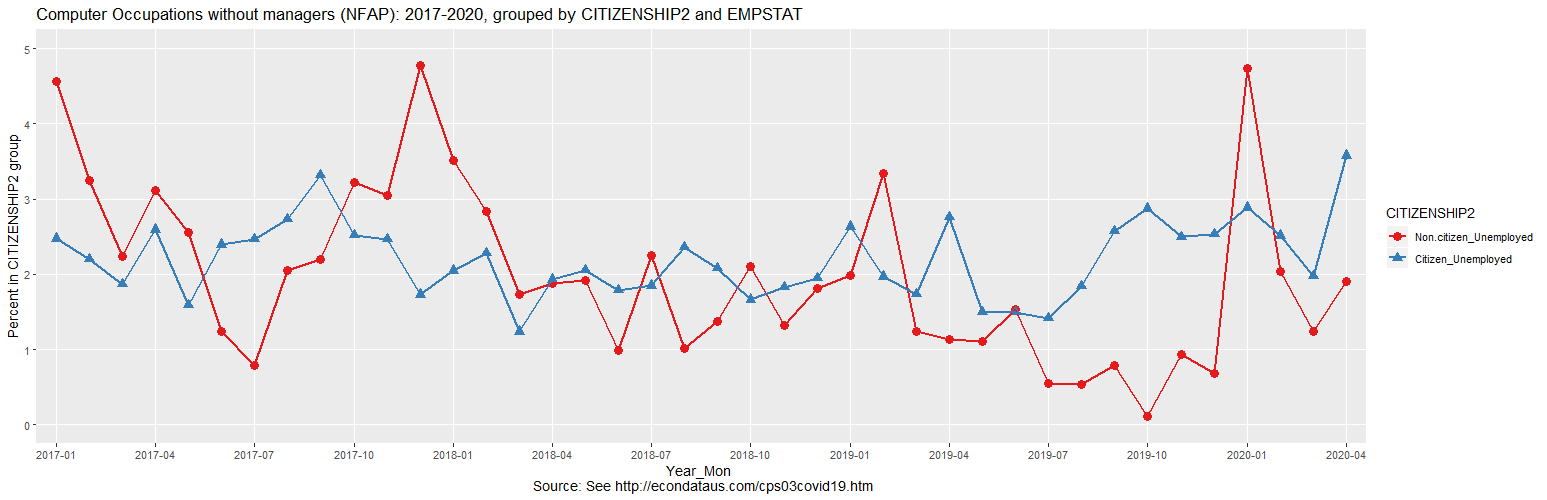
The following graph and table show the same information but with managers removed.
CURRENT POPULATION SURVEY: 2017-2020

Computer Occupations without managers (NFAP): 2017-2020, grouped by CITIZENSHIP2 and EMPSTAT (percent in CITIZENSHIP2 group)

                                Percent Unemployed                           Count Unemployed
                     -----------------------------------------  ------------------------------------------
   Year_Mo     Count Non.citizen_Unemployed Citizen_Unemployed   Non.citizen_Unemployed Citizen_Unemployed
1  2017-01 4,334,216                    4.6                2.5               33,527.881          89,004.36
2  2017-02 4,214,306                    3.2                2.2               23,073.665          77,145.73
3  2017-03 4,130,673                    2.2                1.9               14,783.143          64,868.82
4  2017-04 4,234,893                    3.1                2.6               20,801.971          92,445.26
5  2017-05 4,192,623                    2.6                1.6               17,483.693          55,696.10
6  2017-06 4,208,824                    1.2                2.4                9,268.567          82,858.90
7  2017-07 4,120,717                    0.8                2.5                5,453.648          84,532.61
8  2017-08 4,210,661                    2.0                2.7               14,956.991          95,076.55
9  2017-09 4,226,438                    2.2                3.3               15,338.376         117,042.20
10 2017-10 4,258,792                    3.2                2.5               20,487.493          91,205.83
11 2017-11 4,372,668                    3.1                2.5               19,724.613          91,788.72
12 2017-12 4,418,939                    4.8                1.7               28,465.368          66,123.35
13 2018-01 4,486,574                    3.5                2.0               24,028.261          77,922.73
14 2018-02 4,680,772                    2.8                2.3               21,446.335          89,539.80
15 2018-03 4,667,536                    1.7                1.2               13,391.596          48,178.24
16 2018-04 4,502,789                    1.9                1.9               13,741.349          72,695.99
17 2018-05 4,534,162                    1.9                2.1               15,277.811          76,758.52
18 2018-06 4,430,653                    1.0                1.8                7,326.142          65,845.77
19 2018-07 4,433,493                    2.2                1.8               17,337.156          67,718.99
20 2018-08 4,499,733                    1.0                2.4                8,525.532          86,474.93
21 2018-09 4,341,764                    1.4                2.1               10,777.401          74,024.38
22 2018-10 4,399,934                    2.1                1.7               15,449.240          60,953.53
23 2018-11 4,440,410                    1.3                1.8               10,057.227          67,299.05
24 2018-12 4,479,564                    1.8                1.9               13,497.875          72,819.67
25 2019-01 4,514,726                    2.0                2.6               15,531.565          98,272.27
26 2019-02 4,749,145                    3.3                2.0               28,360.496          76,772.04
27 2019-03 4,643,742                    1.2                1.7                9,751.318          66,835.80
28 2019-04 4,561,826                    1.1                2.8                8,510.555         105,042.30
29 2019-05 4,686,270                    1.1                1.5                8,090.813          59,105.56
30 2019-06 4,697,355                    1.5                1.5               12,365.930          58,337.47
31 2019-07 4,761,931                    0.6                1.4                4,318.273          56,294.35
32 2019-08 4,747,817                    0.5                1.8                4,038.619          73,608.71
33 2019-09 4,632,263                    0.8                2.6                5,701.291         100,580.44
34 2019-10 4,526,129                    0.1                2.9                  827.926         108,241.43
35 2019-11 4,514,026                    0.9                2.5                7,639.578          92,255.45
36 2019-12 4,480,388                    0.7                2.5                5,037.152          94,793.08
37 2020-01 4,771,495                    4.7                2.9               36,614.497         115,245.73
38 2020-02 4,803,369                    2.0                2.5               14,875.878         102,458.38
39 2020-03 4,892,415                    1.2                2.0                9,958.555          80,674.32
40 2020-04 5,021,247                    1.9                3.6               14,738.768         151,844.89

URL parameters (short)=
?maxyear=2020&STATE=&units=Percent%20in%20group&geo=NATION&occ=Computer%20Occupations%20without%20managers%20(NFAP)&empstat=In%20labor%20force&group=CITIZENSHIP2|EMPSTAT&sortn=2&sortdir=Ascending&ymax=5&color=Set1&geomtype=Line%20Graph
As can be seen, the 3.6 percent for U.S. workers in April 2020 was the highest unemployment rate since before 2017. Of course, it makes sense that computer workers have not been hit as hard as non-tech workers since much of their work can be done remotely, at least for a while. But if you look at just the unemployment rate of U.S. computer workers, it is clear that their unemployment rate went up in April of 2020.
As mentioned in the prior section, it was not possible to exactly reproduce Stuart Anderson's numbers using CPS data from IPUMS. I sent an email to the Forbes corrections department at corrections@forbes.com , explaining the problems that I had found with Stuart Anderson's numbers, and providing a link to this page. I also asked for Stuart Anderson to "provide links to the exact numbers by which he calculated the 3.0 and 2.8 percent numbers in his Table 1". I got the following reply:
Hi - thanks for reading Forbes.com and writing in. I've sent your note to the writer of the piece for review.
I received this reply on May 27, 2020 and have since asked for an update several times. I have gotten no response. Hence, neither Forbes nor Stuart Anderson have been of any help in finding Stuart's original source. Fortunately, I was able to eventually find the source on my own. It turns out that the raw CPS data is originally posted on the U.S. Census website. This same raw data is posted on the NBER website, along with the same data in Stata .dta files. The .dta files for the desired months can be downloaded and the following R program will read and process them:
# NFAP Computer occupations include (pre-2020 in parentheses):
# 1005 Computer and information research scientist
# 0110 Computer and information systems manager
# 1400 Computer hardware engineer
# 1106 Computer network architect
# 1010 Computer programmer
# 1050 Computer support specialist
# 1006 Computer systems analyst
# 1065 Database administrator and architect (1060 Database administrators)
# 1007 Information security analyst
# 1410 Electrical and electronics engineer
# 1105 Network and computer systems administrator
# 1021 Software developer (1020 Software developers, applications and systems software)
# 1022 Software quality assurance analyst and tester (1020 above)
# 1032 Web and digital interface designer (1030 Web developers)
# 1031 Web developer (1030 above)
# OCCUPATION CODES: 2011-2019 at https://cps.ipums.org/cps/codes/occ_20112019_codes.shtml
# OCCUPATION CODES: 2020+ at https://cps.ipums.org/cps/codes/occ_2020_codes.shtml
# Download data files from https://www.census.gov/data/datasets/time-series/demo/cps/cps-basic.html
# Unzip files to get .dat file in local directory; from feb 2020 on, copy .dat file from cpspb\prod\data

library("tidyverse")
library("haven")
mnth <- c("jan","feb","mar","apr","may","jun","jul","aug","sep","oct","nov","dec")
start <- c(860,172,613,393)
end   <- c(863,173,622,394)
nms   <- c("peio1ocd","prcitshp","pwsswgt","prempnot")
minyear <- 2017 # START CHANGABLE VARIABLES
maxyear <- 2020
maxmnth <- 5
xaxistp <- 4
dplaces <- 1
ymax <- 5
managers <- TRUE # END CHANGABLE VARIABLES
if (managers){
  mandesc <- "with managers"
  outfile <- sprintf("cps_nfap20%02d", maxmnth)
}else{
  mandesc <- "without managers"
  outfile <- sprintf("cps_nfap_womgr20%02d", maxmnth)
}
if (!exists("dd")){
  for (year in minyear:maxyear){
    for (month in 1:12){
      year_mo <- sprintf("%04d-%02d", year, month)
      filename <- paste0(mnth[month],year %% 100,"pub.dat")
      if (!file.exists(filename)){
        break
      }
      print(paste0("BEFORE read ", filename))
      tt <- read_fwf(filename, fwf_positions(start, end, nms), col_types = "iiii")
      print(paste0(" AFTER read ", filename))
      if (year >= 2020){
        if (managers){
          occs <- c(1005,0110,1400,1106,1010,1050,1006,1065,1007,1410,1105,1021,1022,1032,1031)
        }else{
          occs <- c(1005,1400,1106,1010,1050,1006,1065,1007,1410,1105,1021,1022,1032,1031)
        }
      }else{
        if (managers){
          occs <- c(1005,0110,1400,1106,1010,1050,1006,1060,1007,1410,1105,1020,1030)
        }else{
          occs <- c(1005,1400,1106,1010,1050,1006,1060,1007,1410,1105,1020,1030)
        }
      }
      all <- tt[tt$peio1ocd %in% occs,]
      cit <- all[all$prcitshp != 5,]
      non <- all[all$prcitshp == 5,]
      all_unemp <- sum(all$pwsswgt[all$prempnot == 2]) / 10000
      cit_unemp <- sum(cit$pwsswgt[cit$prempnot == 2]) / 10000
      non_unemp <- sum(non$pwsswgt[non$prempnot == 2]) / 10000
      all_ilf   <- sum(all$pwsswgt[all$prempnot == 1]) / 10000 + all_unemp
      cit_ilf   <- sum(cit$pwsswgt[cit$prempnot == 1]) / 10000 + cit_unemp
      non_ilf   <- sum(non$pwsswgt[non$prempnot == 1]) / 10000 + non_unemp
      all_urate <- 100 * all_unemp / all_ilf
      cit_urate <- 100 * cit_unemp / cit_ilf
      non_urate <- 100 * non_unemp / non_ilf
      cc <- data.frame(year_mo,
                       non_ilf,   cit_ilf,   all_ilf,
                       non_unemp, cit_unemp, all_unemp,
                       non_urate, cit_urate, all_urate)
      if (!exists("dd")){
        dd <- cc
      }
      else {
        dd <- rbind(dd, cc)
      }
    }
  }
}
pp <- data.frame(dd$year_mo, dd$all_ilf, dd$non_urate, dd$cit_urate, dd$all_urate,
                 dd$non_unemp, dd$cit_unemp, dd$all_unemp)
names(pp) <- c("year_mo","labor_force","non_rate","cit_rate","all_rate",
               "non_count","cit_count","all_count")
write_csv(pp, paste0(outfile, ".csv"))
pp$labor_force <- format(pp$labor_force, big.mark=",", scientific=FALSE)
for (i in 3:5){
  pp[,i] <- format(round(pp[,i], dplaces), nsmall = dplaces)
}
for (i in 6:8){
  pp[,i] <- format(round(pp[,i]), big.mark=",", scientific=FALSE)
}
title <- paste("Computer Occupations",mandesc,"(NFAP): 2017-2020, grouped by CITIZENSHIP")
cat(paste0(title,"\n\n"))
print(pp)

ee <- data.frame(dd$year_mo, dd$non_urate, dd$cit_urate, dd$all_urate)
vars <- c("Non-citizen Unemployed","Citizen Unemployed","All Unemployed")
names(ee) <- c("year_mo", vars)
mm <- gather(ee, "key", "value", vars)
mm$key <- factor(mm$key, levels = vars)
every_nth = function(n) { # function for labeling axis
  return(function(x) {x[c(TRUE, rep(FALSE, n - 1))]})
}

png(paste0(outfile,".png"), width = 1500, height = 500)
gg <- ggplot(data=mm, aes(x=year_mo,y=value,group=key)) +
  geom_point(aes(color=key,shape=key), size=3, alpha=1.0) +
  geom_line(aes(color=key), size=1, alpha=1.0) +
  scale_color_manual(values = c("red", "blue", "green")) +
  scale_x_discrete(breaks = every_nth(n = xaxistp)) +
  coord_cartesian(ylim=c(0, ymax)) +
  scale_y_continuous(breaks = seq(0, 6, 1), minor_breaks = NULL) +
  ggtitle(title) +
  xlab("Year_Mo\nSource: See http://econdataus.com/cps03covid19.htm") +
  ylab("Percent in CITIZENSHIP group")
print(gg)
dev.off()
X11(width = 24, height = 12)
print(gg)
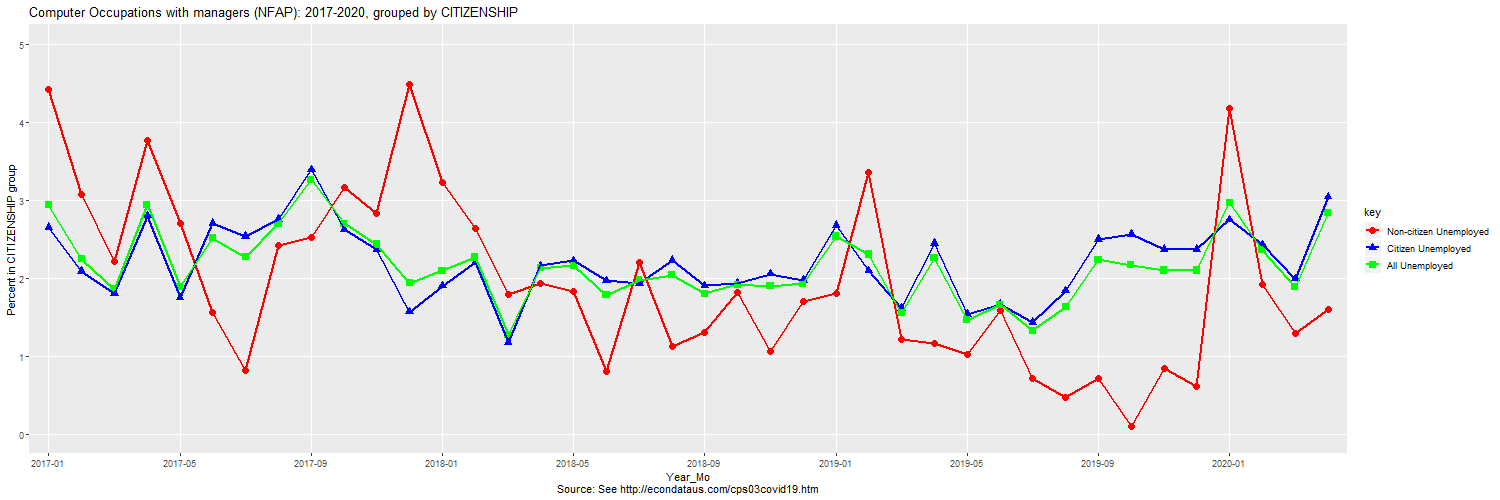
Computer Occupations with managers (NFAP): 2017-2020, grouped by CITIZENSHIP

   year_mo labor_force non_rate cit_rate all_rate non_count cit_count all_count
1  2017-01   5,083,329      4.4      2.7      2.9    35,608   113,686   149,294
2  2017-02   5,007,023      3.1      2.1      2.2    24,350    88,110   112,460
3  2017-03   4,921,265      2.2      1.8      1.9    16,225    75,456    91,681
4  2017-04   4,983,520      3.8      2.8      2.9    27,594   119,085   146,679
5  2017-05   4,887,519      2.7      1.7      1.9    19,922    72,621    92,543
6  2017-06   4,871,279      1.6      2.7      2.5    12,476   110,183   122,659
7  2017-07   4,777,019      0.8      2.5      2.3     6,121   102,340   108,461
8  2017-08   4,887,736      2.4      2.8      2.7    19,337   112,815   132,153
9  2017-09   4,941,581      2.5      3.4      3.3    19,055   142,162   161,217
10 2017-10   4,973,484      3.2      2.6      2.7    21,667   112,810   134,477
11 2017-11   5,097,665      2.8      2.4      2.4    20,012   104,162   124,173
12 2017-12   5,168,565      4.5      1.6      1.9    29,454    70,786   100,240
13 2018-01   5,204,071      3.2      1.9      2.1    24,481    84,624   109,104
14 2018-02   5,386,050      2.6      2.2      2.3    21,772   100,409   122,182
15 2018-03   5,341,738      1.8      1.2      1.3    15,174    52,967    68,141
16 2018-04   5,187,960      1.9      2.2      2.1    15,372    95,131   110,503
17 2018-05   5,241,516      1.8      2.2      2.2    15,664    97,719   113,383
18 2018-06   5,144,426      0.8      2.0      1.8     6,414    85,569    91,983
19 2018-07   5,142,346      2.2      1.9      2.0    18,644    83,032   101,676
20 2018-08   5,156,508      1.1      2.2      2.0    10,035    95,221   105,256
21 2018-09   5,004,165      1.3      1.9      1.8    10,777    79,570    90,347
22 2018-10   5,169,572      1.8      1.9      1.9    14,532    84,735    99,267
23 2018-11   5,186,986      1.1      2.1      1.9     8,745    89,765    98,510
24 2018-12   5,234,781      1.7      2.0      1.9    14,178    86,988   101,166
25 2019-01   5,154,654      1.8      2.7      2.5    15,205   115,648   130,854
26 2019-02   5,429,520      3.4      2.1      2.3    30,370    94,890   125,260
27 2019-03   5,271,519      1.2      1.6      1.6    10,295    71,602    81,897
28 2019-04   5,221,387      1.2      2.4      2.3     9,135   108,711   117,846
29 2019-05   5,413,793      1.0      1.5      1.5     7,897    71,472    79,369
30 2019-06   5,406,565      1.6      1.7      1.7    13,725    76,018    89,743
31 2019-07   5,533,182      0.7      1.4      1.3     6,052    67,442    73,495
32 2019-08   5,630,362      0.5      1.8      1.6     4,024    87,974    91,998
33 2019-09   5,410,845      0.7      2.5      2.2     5,701   115,425   121,126
34 2019-10   5,311,873      0.1      2.6      2.2       828   114,536   115,363
35 2019-11   5,301,418      0.8      2.4      2.1     7,978   103,430   111,408
36 2019-12   5,269,303      0.6      2.4      2.1     5,037   105,728   110,765
37 2020-01   5,540,113      4.2      2.8      3.0    35,387   129,266   164,653
38 2020-02   5,602,755      1.9      2.4      2.4    14,942   117,460   132,402
39 2020-03   5,794,298      1.3      2.0      1.9    11,458    97,810   109,268
40 2020-04   5,955,976      1.6      3.1      2.8    13,588   155,760   169,348
As can be seen in the above table, the R program exactly reproduces Stuart's results. The green line in the graph shows that January 2020 appears to be cherry-picked to show a decline in unemployment. In any event, the blue line shows that unemployment rose even from this cherry-picked date if one correctly looks at unemployed citizens, the group that would be affected by the import of non-citizen workers.
As seen in the CPS data from IPUMS, the spike in unemployment in January was chiefly among non-citizens. In fact, extending the timeline of the graph back through 2017 reveals that there seems to have been a peak near the beginning of each year since then. The peak was in December of 2017, and February of 2019, both within one month of January. This would seem to merit further investigation. In any event, this would indicate that it would be very misleading to use January 2020 as an indication of the unemployment level of U.S. citizens in computer occupations. At 3.1 percent, their unemployment rate in April of 2020 was the highest level since it reached 3.4 percent in September of 2017. In addition, the table above shows that over 50,000 U.S. computer workers appear to have lost their jobs in April.
By setting the variable managers to FALSE in line 28 and rerunning the R program, one can obtain the results if managers are excluded. That results in the following graph and output: The following graph and table show the same information but with managers removed.
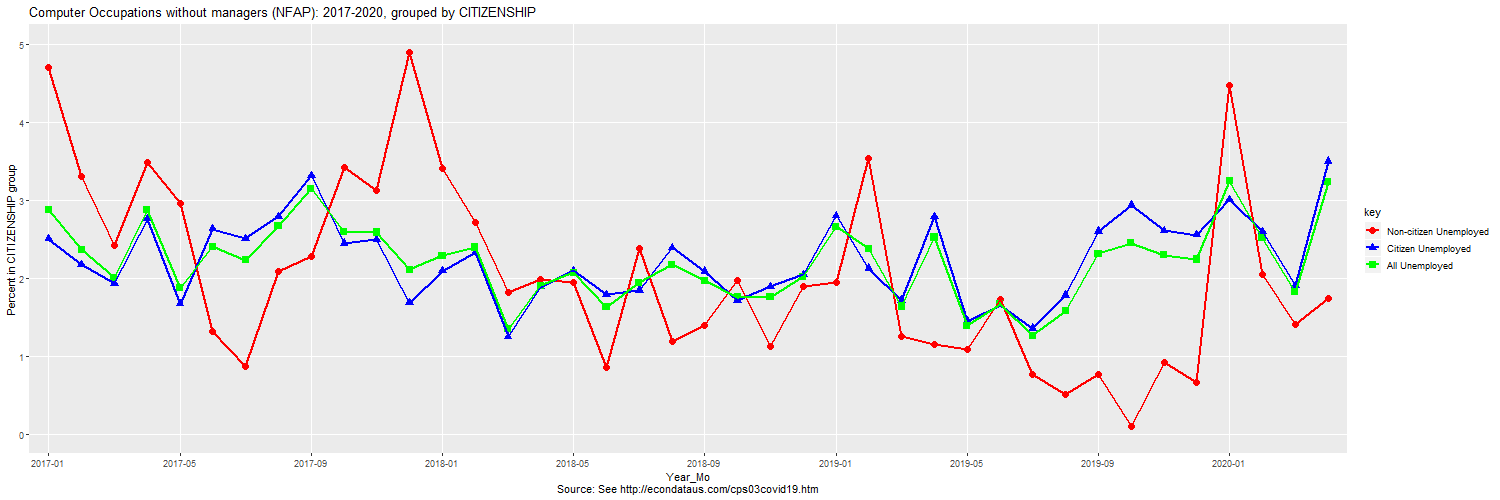
Computer Occupations without managers (NFAP): 2017-2020, grouped by CITIZENSHIP

   year_mo labor_force non_rate cit_rate all_rate non_count cit_count all_count
1  2017-01   4,418,127      4.7      2.5      2.9    35,608    91,698   127,306
2  2017-02   4,322,500      3.3      2.2      2.4    24,350    78,051   102,401
3  2017-03   4,207,951      2.4      1.9      2.0    16,225    68,350    84,576
4  2017-04   4,321,363      3.5      2.8      2.9    23,367   100,829   124,196
5  2017-05   4,250,604      3.0      1.7      1.9    19,922    59,850    79,771
6  2017-06   4,287,531      1.3      2.6      2.4     9,768    93,305   103,073
7  2017-07   4,202,769      0.9      2.5      2.2     6,121    87,852    93,973
8  2017-08   4,267,456      2.1      2.8      2.7    15,591    98,404   113,995
9  2017-09   4,292,611      2.3      3.3      3.1    16,049   119,094   135,144
10 2017-10   4,312,437      3.4      2.4      2.6    21,667    90,165   111,831
11 2017-11   4,443,990      3.1      2.5      2.6    20,012    95,061   115,072
12 2017-12   4,507,124      4.9      1.7      2.1    29,454    65,765    95,219
13 2018-01   4,583,073      3.4      2.1      2.3    23,571    81,442   105,013
14 2018-02   4,765,832      2.7      2.3      2.4    20,764    93,474   114,238
15 2018-03   4,750,518      1.8      1.3      1.3    14,192    49,864    64,056
16 2018-04   4,577,494      2.0      1.9      1.9    14,438    72,742    87,180
17 2018-05   4,627,878      2.0      2.1      2.1    15,664    80,350    96,014
18 2018-06   4,505,213      0.9      1.8      1.6     6,414    67,154    73,567
19 2018-07   4,505,654      2.4      1.8      1.9    18,644    68,871    87,515
20 2018-08   4,539,820      1.2      2.4      2.2    10,035    88,629    98,664
21 2018-09   4,382,343      1.4      2.1      2.0    10,777    75,482    86,259
22 2018-10   4,474,589      2.0      1.7      1.8    14,532    64,238    78,770
23 2018-11   4,526,183      1.1      1.9      1.8     8,745    70,920    79,665
24 2018-12   4,533,034      1.9      2.0      2.0    14,178    77,412    91,591
25 2019-01   4,553,058      2.0      2.8      2.7    15,205   105,905   121,111
26 2019-02   4,795,655      3.5      2.1      2.4    29,775    84,258   114,033
27 2019-03   4,674,276      1.3      1.7      1.6     9,725    66,947    76,672
28 2019-04   4,589,232      1.2      2.8      2.5     8,489   107,422   115,912
29 2019-05   4,748,410      1.1      1.5      1.4     7,897    58,381    66,278
30 2019-06   4,776,756      1.7      1.7      1.7    13,725    65,999    79,724
31 2019-07   4,855,038      0.8      1.4      1.3     6,052    55,382    61,434
32 2019-08   4,864,940      0.5      1.8      1.6     4,024    72,860    76,884
33 2019-09   4,695,728      0.8      2.6      2.3     5,701   103,151   108,853
34 2019-10   4,634,934      0.1      2.9      2.5       828   112,861   113,689
35 2019-11   4,633,479      0.9      2.6      2.3     7,978    98,507   106,485
36 2019-12   4,565,457      0.7      2.6      2.2     5,037    97,358   102,395
37 2020-01   4,861,975      4.5      3.0      3.2    35,387   122,510   157,897
38 2020-02   4,873,710      2.0      2.6      2.5    14,942   107,730   122,672
39 2020-03   4,977,364      1.4      1.9      1.8    11,458    79,417    90,875
40 2020-04   5,132,250      1.7      3.5      3.2    13,588   152,521   166,109
As can be seen, the 3.5 percent for U.S. workers in April 2020 was the highest unemployment rate since before 2017. Of course, it makes sense that computer workers have not been hit as hard as non-tech workers since much of their work can be done remotely, at least for a while. But if you look at just the unemployment rate of U.S. computer workers, it is clear that their unemployment rate went up in April of 2020, even from the cherry-picked month of January 2020.
Regarding the slight difference between the CPS data that is initially released and the CPS data on IPUMS, this IPUMS CPS page states the following:
IPUMS CPS unharmonized variables are original CPS data packaged for accessibility and utility. Regular IPUMS CPS variables are harmonized for comparability across time. Similar concepts are given consistent codes across months and years, unknown and NIU categories are coded consistently, and any unexpected values are recoded. IPUMS CPS unharmonized variables correspond directly to the original public use datasets made available by the Census Bureau and the Bureau of Labor Statistics.
Hence, the IPUMS CPS data seems to be slightly better for looking at data across time. However, the original public use datasets do have an advantage that they can be directly downloaded and processed via an R program like the one above. In any event, both sets of data show that Stuart Anderson's claim that the unemployment rate for individuals in computer occupations has declined is clearly false. Media would do well to demand that studies they cite have precise sources, are peer-reviewed, and/or are reproducible. Forbes appears to have demanded none of these from Stuart Anderson and his NFAP study.
On June 11, 2020, Forbes Magazine posted another article by Stuart Anderson titled Unemployment Rate For Computer Occupations Fell In May. That article begins:
The Trump administration hopes to use the economic fallout from the coronavirus pandemic to impose new immigration restrictions on H-1B visa holders and international students, but reality is undermining its case. The unemployment rate for individuals in computer occupations declined from 3% in January 2020 (before the pandemic spread in the U.S.) to 2.8% in April 2020, and fell again to 2.5% in May 2020, according to an analysis of the Bureau of Labor Statistics' Current Population Survey by the National Foundation for American Policy (NFAP). The unemployment rate in computer occupations has been stable and, in fact, falling.
The excerpt above links to this NFAP analysis. This analysis is an update through May of his prior one described above. Unfortunately, it's not yet possible to reproduce the May numbers using the Stata .dta files in the NBER website since those files have not yet been updated. Fortunately, it was relatively easy to rewrite the prior R program to read the original raw data files on the Census website. Following is the new R program that can read and process the raw files:
# NFAP Computer occupations include (pre-2020 in parentheses):
# 1005 Computer and information research scientist
# 0110 Computer and information systems manager
# 1400 Computer hardware engineer
# 1106 Computer network architect
# 1010 Computer programmer
# 1050 Computer support specialist
# 1006 Computer systems analyst
# 1065 Database administrator and architect (1060 Database administrators)
# 1007 Information security analyst
# 1410 Electrical and electronics engineer
# 1105 Network and computer systems administrator
# 1021 Software developer (1020 Software developers, applications and systems software)
# 1022 Software quality assurance analyst and tester (1020 above)
# 1032 Web and digital interface designer (1030 Web developers)
# 1031 Web developer (1030 above)
# OCCUPATION CODES: 2011-2019 at https://cps.ipums.org/cps/codes/occ_20112019_codes.shtml
# OCCUPATION CODES: 2020+ at https://cps.ipums.org/cps/codes/occ_2020_codes.shtml
# Download data files from https://www.census.gov/data/datasets/time-series/demo/cps/cps-basic.html
# Unzip files to get .dat file in local directory; from feb 2020 on, copy .dat file from cpspb\prod\data

library("tidyverse")
library("haven")
mnth <- c("jan","feb","mar","apr","may","jun","jul","aug","sep","oct","nov","dec")
start <- c(860,172,613,393)
end   <- c(863,173,622,394)
nms   <- c("peio1ocd","prcitshp","pwsswgt","prempnot")
minyear <- 2017 # START CHANGABLE VARIABLES
maxyear <- 2020
maxmnth <- 5
xaxistp <- 4
dplaces <- 1
ymax <- 5
managers <- TRUE # END CHANGABLE VARIABLES
if (managers){
  mandesc <- "with managers"
  outfile <- sprintf("cps_nfap20%02d", maxmnth)
}else{
  mandesc <- "without managers"
  outfile <- sprintf("cps_nfap_womgr20%02d", maxmnth)
}
if (!exists("dd")){
  for (year in minyear:maxyear){
    for (month in 1:12){
      year_mo <- sprintf("%04d-%02d", year, month)
      filename <- paste0(mnth[month],year %% 100,"pub.dat")
      if (!file.exists(filename)){
        break
      }
      print(paste0("BEFORE read ", filename))
      tt <- read_fwf(filename, fwf_positions(start, end, nms), col_types = "iiii")
      print(paste0(" AFTER read ", filename))
      if (year >= 2020){
        if (managers){
          occs <- c(1005,0110,1400,1106,1010,1050,1006,1065,1007,1410,1105,1021,1022,1032,1031)
        }else{
          occs <- c(1005,1400,1106,1010,1050,1006,1065,1007,1410,1105,1021,1022,1032,1031)
        }
      }else{
        if (managers){
          occs <- c(1005,0110,1400,1106,1010,1050,1006,1060,1007,1410,1105,1020,1030)
        }else{
          occs <- c(1005,1400,1106,1010,1050,1006,1060,1007,1410,1105,1020,1030)
        }
      }
      all <- tt[tt$peio1ocd %in% occs,]
      cit <- all[all$prcitshp != 5,]
      non <- all[all$prcitshp == 5,]
      all_unemp <- sum(all$pwsswgt[all$prempnot == 2]) / 10000
      cit_unemp <- sum(cit$pwsswgt[cit$prempnot == 2]) / 10000
      non_unemp <- sum(non$pwsswgt[non$prempnot == 2]) / 10000
      all_ilf   <- sum(all$pwsswgt[all$prempnot == 1]) / 10000 + all_unemp
      cit_ilf   <- sum(cit$pwsswgt[cit$prempnot == 1]) / 10000 + cit_unemp
      non_ilf   <- sum(non$pwsswgt[non$prempnot == 1]) / 10000 + non_unemp
      all_urate <- 100 * all_unemp / all_ilf
      cit_urate <- 100 * cit_unemp / cit_ilf
      non_urate <- 100 * non_unemp / non_ilf
      cc <- data.frame(year_mo,
                       non_ilf,   cit_ilf,   all_ilf,
                       non_unemp, cit_unemp, all_unemp,
                       non_urate, cit_urate, all_urate)
      if (!exists("dd")){
        dd <- cc
      }
      else {
        dd <- rbind(dd, cc)
      }
    }
  }
}
pp <- data.frame(dd$year_mo, dd$all_ilf, dd$non_urate, dd$cit_urate, dd$all_urate,
                 dd$non_unemp, dd$cit_unemp, dd$all_unemp)
names(pp) <- c("year_mo","labor_force","non_rate","cit_rate","all_rate",
               "non_count","cit_count","all_count")
write_csv(pp, paste0(outfile, ".csv"))
pp$labor_force <- format(pp$labor_force, big.mark=",", scientific=FALSE)
for (i in 3:5){
  pp[,i] <- format(round(pp[,i], dplaces), nsmall = dplaces)
}
for (i in 6:8){
  pp[,i] <- format(round(pp[,i]), big.mark=",", scientific=FALSE)
}
title <- paste("Computer Occupations",mandesc,"(NFAP): 2017-2020, grouped by CITIZENSHIP")
cat(paste0(title,"\n\n"))
print(pp)

ee <- data.frame(dd$year_mo, dd$non_urate, dd$cit_urate, dd$all_urate)
vars <- c("Non-citizen Unemployed","Citizen Unemployed","All Unemployed")
names(ee) <- c("year_mo", vars)
mm <- gather(ee, "key", "value", vars)
mm$key <- factor(mm$key, levels = vars)
every_nth = function(n) { # function for labeling axis
  return(function(x) {x[c(TRUE, rep(FALSE, n - 1))]})
}

png(paste0(outfile,".png"), width = 1500, height = 500)
gg <- ggplot(data=mm, aes(x=year_mo,y=value,group=key)) +
  geom_point(aes(color=key,shape=key), size=3, alpha=1.0) +
  geom_line(aes(color=key), size=1, alpha=1.0) +
  scale_color_manual(values = c("red", "blue", "green")) +
  scale_x_discrete(breaks = every_nth(n = xaxistp)) +
  coord_cartesian(ylim=c(0, ymax)) +
  scale_y_continuous(breaks = seq(0, 6, 1), minor_breaks = NULL) +
  ggtitle(title) +
  xlab("Year_Mo\nSource: See http://econdataus.com/cps03covid19.htm") +
  ylab("Percent in CITIZENSHIP group")
print(gg)
dev.off()
X11(width = 24, height = 12)
print(gg)
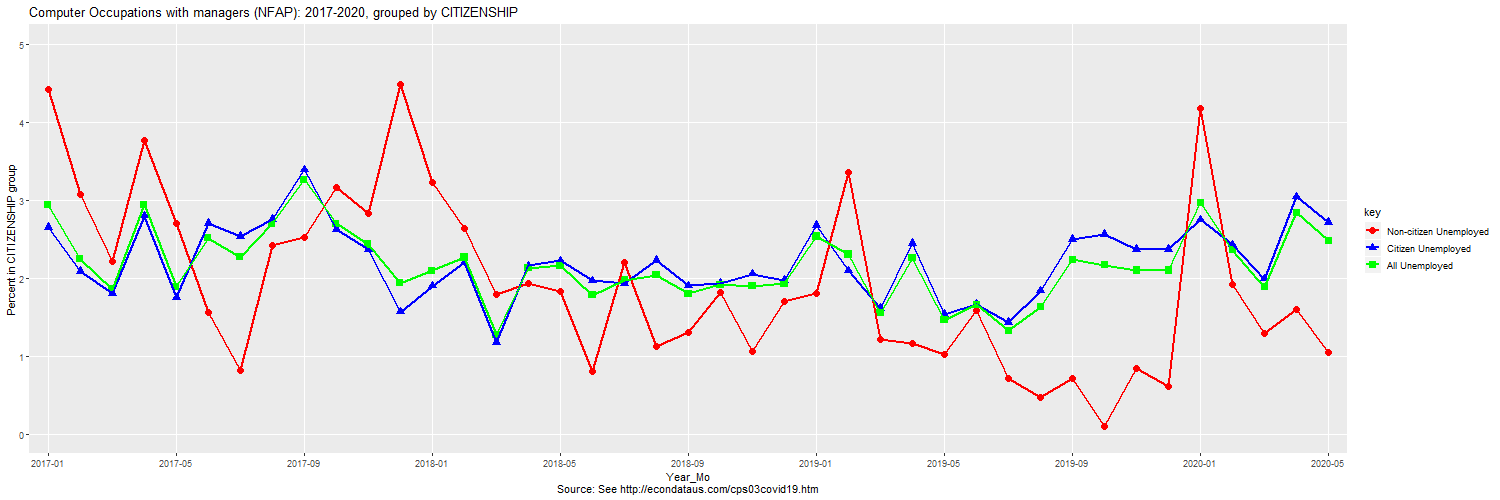
Computer Occupations with managers (NFAP): 2017-2020, grouped by CITIZENSHIP

   year_mo labor_force non_rate cit_rate all_rate non_count cit_count all_count
1  2017-01   5,083,329      4.4      2.7      2.9    35,608   113,686   149,294
2  2017-02   5,007,023      3.1      2.1      2.2    24,350    88,110   112,460
3  2017-03   4,921,265      2.2      1.8      1.9    16,225    75,456    91,681
4  2017-04   4,983,520      3.8      2.8      2.9    27,594   119,085   146,679
5  2017-05   4,887,519      2.7      1.7      1.9    19,922    72,621    92,543
6  2017-06   4,871,279      1.6      2.7      2.5    12,476   110,183   122,659
7  2017-07   4,777,019      0.8      2.5      2.3     6,121   102,340   108,461
8  2017-08   4,887,736      2.4      2.8      2.7    19,337   112,815   132,153
9  2017-09   4,941,581      2.5      3.4      3.3    19,055   142,162   161,217
10 2017-10   4,973,484      3.2      2.6      2.7    21,667   112,810   134,477
11 2017-11   5,097,665      2.8      2.4      2.4    20,012   104,162   124,173
12 2017-12   5,168,565      4.5      1.6      1.9    29,454    70,786   100,240
13 2018-01   5,204,071      3.2      1.9      2.1    24,481    84,624   109,104
14 2018-02   5,386,050      2.6      2.2      2.3    21,772   100,409   122,182
15 2018-03   5,341,738      1.8      1.2      1.3    15,174    52,967    68,141
16 2018-04   5,187,960      1.9      2.2      2.1    15,372    95,131   110,503
17 2018-05   5,241,516      1.8      2.2      2.2    15,664    97,719   113,383
18 2018-06   5,144,426      0.8      2.0      1.8     6,414    85,569    91,983
19 2018-07   5,142,346      2.2      1.9      2.0    18,644    83,032   101,676
20 2018-08   5,156,508      1.1      2.2      2.0    10,035    95,221   105,256
21 2018-09   5,004,165      1.3      1.9      1.8    10,777    79,570    90,347
22 2018-10   5,169,572      1.8      1.9      1.9    14,532    84,735    99,267
23 2018-11   5,186,986      1.1      2.1      1.9     8,745    89,765    98,510
24 2018-12   5,234,781      1.7      2.0      1.9    14,178    86,988   101,166
25 2019-01   5,154,654      1.8      2.7      2.5    15,205   115,648   130,854
26 2019-02   5,429,520      3.4      2.1      2.3    30,370    94,890   125,260
27 2019-03   5,271,519      1.2      1.6      1.6    10,295    71,602    81,897
28 2019-04   5,221,387      1.2      2.4      2.3     9,135   108,711   117,846
29 2019-05   5,413,793      1.0      1.5      1.5     7,897    71,472    79,369
30 2019-06   5,406,565      1.6      1.7      1.7    13,725    76,018    89,743
31 2019-07   5,533,182      0.7      1.4      1.3     6,052    67,442    73,495
32 2019-08   5,630,362      0.5      1.8      1.6     4,024    87,974    91,998
33 2019-09   5,410,845      0.7      2.5      2.2     5,701   115,425   121,126
34 2019-10   5,311,873      0.1      2.6      2.2       828   114,536   115,363
35 2019-11   5,301,418      0.8      2.4      2.1     7,978   103,430   111,408
36 2019-12   5,269,303      0.6      2.4      2.1     5,037   105,728   110,765
37 2020-01   5,540,113      4.2      2.8      3.0    35,387   129,266   164,653
38 2020-02   5,602,755      1.9      2.4      2.4    14,942   117,460   132,402
39 2020-03   5,794,298      1.3      2.0      1.9    11,458    97,810   109,268
40 2020-04   5,955,976      1.6      3.1      2.8    13,588   155,760   169,348
41 2020-05   6,030,322      1.0      2.7      2.5     8,921   140,820   149,741
As can be seen in the above table, the R program exactly reproduces Stuart's results. The green line in the graph shows that January 2020 appears to be cherry-picked to show a decline in unemployment. In any event, the blue line and table shows that unemployment declined only a tenth of one percent from this cherry-picked date if one correctly looks at unemployed citizens, the group that would be affected by the import of non-citizen workers.
The graph also shows that the spike in unemployment in January was chiefly among non-citizens. As previously mentioned, extending the timeline of the graph back through 2017 reveals that there seems to have been a peak near the beginning of each year since then. The peak was in December of 2017, and February of 2019, both within one month of January. This would seem to merit further investigation. In any event, this would indicate that it would be very misleading to use January 2020 as an indication of the unemployment level of U.S. citizens in computer occupations. Except for January, the citizen unemployment rate of 2.7 percent in May of 2020 was the highest level since it reached a similar level in January of 2019 and, before that, June of 2017. Also, it's worth noting that, except for April, the 140,000 citizen computer workers unemployed in May is higher than any number since September of 2017.
By setting the variable managers to FALSE in line 34 and rerunning the R program, one can obtain the results if managers are excluded. That results in the following graph and output: The following graph and table show the same information but with managers removed.

Computer Occupations without managers (NFAP): 2017-2020, grouped by CITIZENSHIP

   year_mo labor_force non_rate cit_rate all_rate non_count cit_count all_count
1  2017-01   4,418,127      4.7      2.5      2.9    35,608    91,698   127,306
2  2017-02   4,322,500      3.3      2.2      2.4    24,350    78,051   102,401
3  2017-03   4,207,951      2.4      1.9      2.0    16,225    68,350    84,576
4  2017-04   4,321,363      3.5      2.8      2.9    23,367   100,829   124,196
5  2017-05   4,250,604      3.0      1.7      1.9    19,922    59,850    79,771
6  2017-06   4,287,531      1.3      2.6      2.4     9,768    93,305   103,073
7  2017-07   4,202,769      0.9      2.5      2.2     6,121    87,852    93,973
8  2017-08   4,267,456      2.1      2.8      2.7    15,591    98,404   113,995
9  2017-09   4,292,611      2.3      3.3      3.1    16,049   119,094   135,144
10 2017-10   4,312,437      3.4      2.4      2.6    21,667    90,165   111,831
11 2017-11   4,443,990      3.1      2.5      2.6    20,012    95,061   115,072
12 2017-12   4,507,124      4.9      1.7      2.1    29,454    65,765    95,219
13 2018-01   4,583,073      3.4      2.1      2.3    23,571    81,442   105,013
14 2018-02   4,765,832      2.7      2.3      2.4    20,764    93,474   114,238
15 2018-03   4,750,518      1.8      1.3      1.3    14,192    49,864    64,056
16 2018-04   4,577,494      2.0      1.9      1.9    14,438    72,742    87,180
17 2018-05   4,627,878      2.0      2.1      2.1    15,664    80,350    96,014
18 2018-06   4,505,213      0.9      1.8      1.6     6,414    67,154    73,567
19 2018-07   4,505,654      2.4      1.8      1.9    18,644    68,871    87,515
20 2018-08   4,539,820      1.2      2.4      2.2    10,035    88,629    98,664
21 2018-09   4,382,343      1.4      2.1      2.0    10,777    75,482    86,259
22 2018-10   4,474,589      2.0      1.7      1.8    14,532    64,238    78,770
23 2018-11   4,526,183      1.1      1.9      1.8     8,745    70,920    79,665
24 2018-12   4,533,034      1.9      2.0      2.0    14,178    77,412    91,591
25 2019-01   4,553,058      2.0      2.8      2.7    15,205   105,905   121,111
26 2019-02   4,795,655      3.5      2.1      2.4    29,775    84,258   114,033
27 2019-03   4,674,276      1.3      1.7      1.6     9,725    66,947    76,672
28 2019-04   4,589,232      1.2      2.8      2.5     8,489   107,422   115,912
29 2019-05   4,748,410      1.1      1.5      1.4     7,897    58,381    66,278
30 2019-06   4,776,756      1.7      1.7      1.7    13,725    65,999    79,724
31 2019-07   4,855,038      0.8      1.4      1.3     6,052    55,382    61,434
32 2019-08   4,864,940      0.5      1.8      1.6     4,024    72,860    76,884
33 2019-09   4,695,728      0.8      2.6      2.3     5,701   103,151   108,853
34 2019-10   4,634,934      0.1      2.9      2.5       828   112,861   113,689
35 2019-11   4,633,479      0.9      2.6      2.3     7,978    98,507   106,485
36 2019-12   4,565,457      0.7      2.6      2.2     5,037    97,358   102,395
37 2020-01   4,861,975      4.5      3.0      3.2    35,387   122,510   157,897
38 2020-02   4,873,710      2.0      2.6      2.5    14,942   107,730   122,672
39 2020-03   4,977,364      1.4      1.9      1.8    11,458    79,417    90,875
40 2020-04   5,132,250      1.7      3.5      3.2    13,588   152,521   166,109
41 2020-05   5,208,495      1.1      3.1      2.8     8,921   135,082   144,003
As can be seen, the 3.1 percent for U.S. workers in May 2020 was, except for April, the highest unemployment rate since September of 2017. Of course, it makes sense that computer workers have not been hit as hard as non-tech workers since much of their work can be done remotely, at least for a while. But if you look at just the unemployment rate of U.S. computer workers, it is clear that their unemployment rate is slightly up, even from the cherry-picked month of January 2020.
One small improvement in the updated Forbes article and NFAP analysis is that they show the lower unemployment numbers for February and March of 2020 in Table 2, providing a little bit of context for the January number. The article states: "Table 2 shows the unemployment rate for individuals in computer occupations in 2020 has been fairly consistent, according to the analysis, at 3% in January 2020, 2.4% in February, 1.9% in March, 2.8% in April and 2.5% in May." But, as mentioned above, the lead paragraph states: "The unemployment rate in computer occupations has been stable and, in fact, falling." That statement is followed by Table 1 which shows only January, April, and May. Why does the article leave out February and March here? Is it that two additional month would hopelessly overload the reader? They need to warm up on 3 months in Table 1 so that they can handle 5 months in Table 2? Or could it be that the writer is aware that most readers won't read much beyond the first paragraph? In any case, the article and analysis still make the serious mistake of including non-citizen computer workers in the analysis. It makes no sense to include the unemployment of H-1B workers in measuring their effect on citizen workers.
Finally, the article makes a major point of comparing the unemployment rates of computer occupations to the much higher unemployment rates of all other occupations. This is a serious mistake. Suppose that U.S. employers are discriminating against U.S. workers due to race, gender, and/or age or because they perceive those workers to be more independent and/or higher paid. What will those workers do? If they need income to survive, younger workers will likely accept jobs in other, lower-paid fields while continuing to look for computer work. Older workers may essentially give up and move to another field or retire. Both the younger and older workers will disappear from the unemployment roles. A worker who is unemployed from ALL occupations is a very different matter. They will show up in the overall unemployment rate and in the unemployment rate of whichever occupation they identify as their current one. Hence, it's very much a mistake to treat the unemployment rate of a specific occupation the same as the overall unemployment rate. It may be useful in measuring an economic shock to an occupation that causes sudden, temporary unemployment. But it likely will not be able to detect if there is systemic bias against classes of workers and that those workers are driven out of the field.
In any event, media would do well to demand that studies they cite have precise sources, are peer-reviewed, and/or are reproducible. This would have allowed the problems of the NFAP study to be identified much sooner and would likely deter the cherry-picking that was present in the first NFAP study and in Table 1 of this one.
Investigating Stuart Anderson's Choices of Computer Occupations
I became aware that the unemployment situation looks much different for the major occupation group of "Computer and Mathematical Occupations" described on this U.S. Bureau of Labor Statistics web page. Following is a revised version of the prior R program that will also look at this and several other categories of occupations.
# NFAP Computer occupations include (pre-2020 in parentheses):
# 0110 Computer and information systems manager
# 1005 Computer and information research scientist
# 1006 Computer systems analyst
# 1007 Information security analyst
# 1010 Computer programmer
# 1021 Software developer (1020 Software developers, applications and systems software)
# 1022 Software quality assurance analyst and tester (1020 above)
# 1031 Web developer (1030 Web developers)
# 1032 Web and digital interface designer (1030 above)
# 1050 Computer support specialist
# 1065 Database administrator and architect (1060 Database administrators)
# 1105 Network and computer systems administrator
# 1106 Computer network architect

# not included in NFAP Computer occupations (pre-2020 in parentheses):
# 1108 Computer occupations, all other (1107)
# 1200 Actuaries
# 1210 Mathematicians (pre-2020 only)
# 1220 Operations research analysts
# 1230 Statisticians (pre-2020 only)
# 1240 Other mathematical science occupations

# added to NFAP Computer occupations (pre-2020 in parentheses):
# 1400 Computer hardware engineer
# 1410 Electrical and electronics engineer
# OCCUPATION CODES: 2011-2019 at https://cps.ipums.org/cps/codes/occ_20112019_codes.shtml
# OCCUPATION CODES: 2020+ at https://cps.ipums.org/cps/codes/occ_2020_codes.shtml
# Download data files from https://www.census.gov/data/datasets/time-series/demo/cps/cps-basic.html
# Unzip files to get .dat file in local directory; from feb 2020 on, copy .dat file from cpspb\prod\data

library("tidyverse")
mnth <- c("jan","feb","mar","apr","may","jun","jul","aug","sep","oct","nov","dec")
start <- c(860,172,613,393)
end   <- c(863,173,622,394)
nms   <- c("peio1ocd","prcitshp","pwsswgt","prempnot")
# START CHANGABLE VARIABLES
minyear <- 2017
maxyear <- 2020
maxmnth <- 5
xaxistp <- 4
dplaces <- 1
ymax <- 5
occt <- "Computer and Mathematical Occupations"
#occt <- "Computer Occupations, including 'all other'"
#occt <- "Computer Occupations, excluding 'all other'"
#occt <- "Computer Occupations, all other"
#occt <- "Computer Hardware or Electric Engineer (NFAP)"
#occt <- "Computer Occupations with managers (NFAP)"
#occt <- "Computer Occupations without managers (NFAP)"
# END CHANGABLE VARIABLES
if (!exists("dd")){
  for (year in minyear:maxyear){
    for (month in 1:12){
      year_mo <- sprintf("%04d-%02d", year, month)
      filename <- paste0(mnth[month],year %% 100,"pub.dat")
      if (!file.exists(filename)){
        break
      }
      print(paste0("BEFORE read ", filename))
      tt <- read_fwf(filename, fwf_positions(start, end, nms), col_types = "iiii")
      print(paste0(" AFTER read ", filename))
      title <- paste0(occt,": ",minyear,"-",maxyear,", grouped by CITIZENSHIP")
      if (occt == "Computer and Mathematical Occupations"){
        all <- tt[tt$peio1ocd >= 1000 & tt$peio1ocd <= 1299,]
        outfile <- sprintf("cps_cm20%02d", maxmnth)
      }
      else if (occt == "Computer Occupations, including 'all other'"){
        all <- tt[tt$peio1ocd >= 1000 & tt$peio1ocd <= 1199,]
        outfile <- sprintf("cps_cin_ao20%02d", maxmnth)
      }
      else if (occt == "Computer Occupations, excluding 'all other'"){
        all <- tt[tt$peio1ocd >= 1000 & tt$peio1ocd <= 1106,]
        outfile <- sprintf("cps_cex_ao20%02d", maxmnth)
      }
      else if (occt == "Computer Occupations, all other"){
        all <- tt[tt$peio1ocd >= 1107 & tt$peio1ocd <= 1108,]
        outfile <- sprintf("cps_c_ao20%02d", maxmnth)
        ymax <- 0
      }
      else if (occt == "Computer Hardware or Electric Engineer (NFAP)"){
        all <- tt[tt$peio1ocd >= 1400 & tt$peio1ocd <= 1410,]
        outfile <- sprintf("cps_nfap_eng20%02d", maxmnth)
        ymax <- 0
      }
      else if (occt == "Computer Occupations with managers (NFAP)"){
        if (year >= 2020){
          occs <- c(1005,0110,1400,1106,1010,1050,1006,1065,1007,1410,1105,1021,1022,1032,1031)
        }else{
          occs <- c(1005,0110,1400,1106,1010,1050,1006,1060,1007,1410,1105,1020,1030)
        }
        all <- tt[tt$peio1ocd %in% occs,]
        outfile <- sprintf("cps_nfap20%02d", maxmnth)
      }
      else if (occt == "Computer Occupations without managers (NFAP)"){
        if (year >= 2020){
          occs <- c(1005,1400,1106,1010,1050,1006,1065,1007,1410,1105,1021,1022,1032,1031)
        }else{
          occs <- c(1005,1400,1106,1010,1050,1006,1060,1007,1410,1105,1020,1030)
        }
        all <- tt[tt$peio1ocd %in% occs,]
        outfile <- sprintf("cps_nfap_womgr20%02d", maxmnth)
      }
      else{
        all <- tt
        outfile <- sprintf("cps_unk%02d", maxmnth)
        ymax <- 0
      }
      cit <- all[all$prcitshp != 5,]
      non <- all[all$prcitshp == 5,]
      all_unemp <- sum(all$pwsswgt[all$prempnot == 2]) / 10000
      cit_unemp <- sum(cit$pwsswgt[cit$prempnot == 2]) / 10000
      non_unemp <- sum(non$pwsswgt[non$prempnot == 2]) / 10000
      all_ilf   <- sum(all$pwsswgt[all$prempnot == 1]) / 10000 + all_unemp
      cit_ilf   <- sum(cit$pwsswgt[cit$prempnot == 1]) / 10000 + cit_unemp
      non_ilf   <- sum(non$pwsswgt[non$prempnot == 1]) / 10000 + non_unemp
      all_urate <- 100 * all_unemp / all_ilf
      cit_urate <- 100 * cit_unemp / cit_ilf
      non_urate <- 100 * non_unemp / non_ilf
      cc <- data.frame(year_mo,
                       non_ilf,   cit_ilf,   all_ilf,
                       non_unemp, cit_unemp, all_unemp,
                       non_urate, cit_urate, all_urate)
      if (!exists("dd")){
        dd <- cc
      }
      else {
        dd <- rbind(dd, cc)
      }
    }
  }
}
pp <- data.frame(dd$year_mo, dd$all_ilf, dd$non_urate, dd$cit_urate, dd$all_urate,
                 dd$non_unemp, dd$cit_unemp, dd$all_unemp)
names(pp) <- c("year_mo","labor_force","non_rate","cit_rate","all_rate",
               "non_count","cit_count","all_count")
write_csv(pp, paste0(outfile, ".csv"))
pp$labor_force <- format(pp$labor_force, big.mark=",", scientific=FALSE)
for (i in 3:5){
  pp[,i] <- format(round(pp[,i], dplaces), nsmall = dplaces)
}
for (i in 6:8){
  pp[,i] <- format(round(pp[,i]), big.mark=",", scientific=FALSE)
}
cat(paste0(title,"\n\n"))
print(pp)

ee <- data.frame(dd$year_mo, dd$non_urate, dd$cit_urate, dd$all_urate)
vars <- c("Non-citizen Unemployed","Citizen Unemployed","All Unemployed")
names(ee) <- c("year_mo", vars)
mm <- gather(ee, "key", "value", vars)
mm$key <- factor(mm$key, levels = vars)
every_nth = function(n) { # function for labeling axis
  return(function(x) {x[c(TRUE, rep(FALSE, n - 1))]})
}

png(paste0(outfile,".png"), width = 1500, height = 500)
gg <- ggplot(data=mm, aes(x=year_mo,y=value,group=key))
gg <- gg + geom_point(aes(color=key,shape=key), size=3, alpha=1.0)
gg <- gg + geom_line(aes(color=key), size=1, alpha=1.0)
gg <- gg + scale_color_manual(values = c("red", "blue", "green"))
gg <- gg + scale_x_discrete(breaks = every_nth(n = xaxistp))
if (ymax > 0){
  gg <- gg + coord_cartesian(ylim=c(0, ymax))
  gg <- gg + scale_y_continuous(breaks = seq(0, ymax, 1), minor_breaks = NULL)
}
gg <- gg + ggtitle(title)
gg <- gg + xlab("Year_Mo\nSource: See http://econdataus.com/cps03covid19.htm")
gg <- gg + ylab("Percent in CITIZENSHIP group")
print(gg)
dev.off()
X11(width = 24, height = 12)
print(gg)
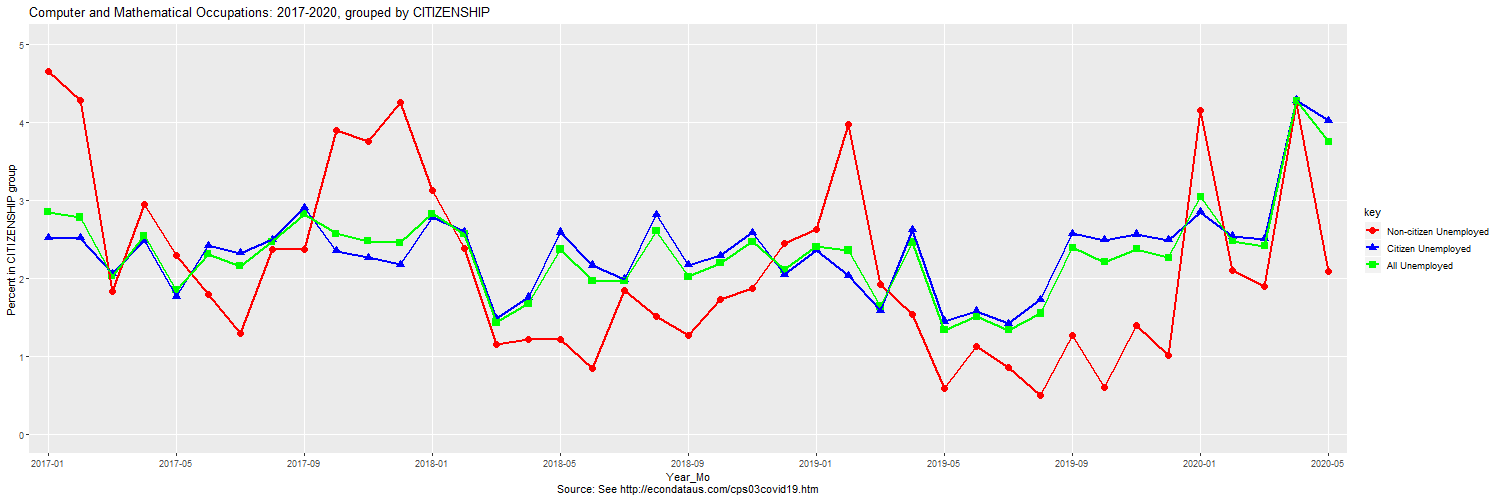
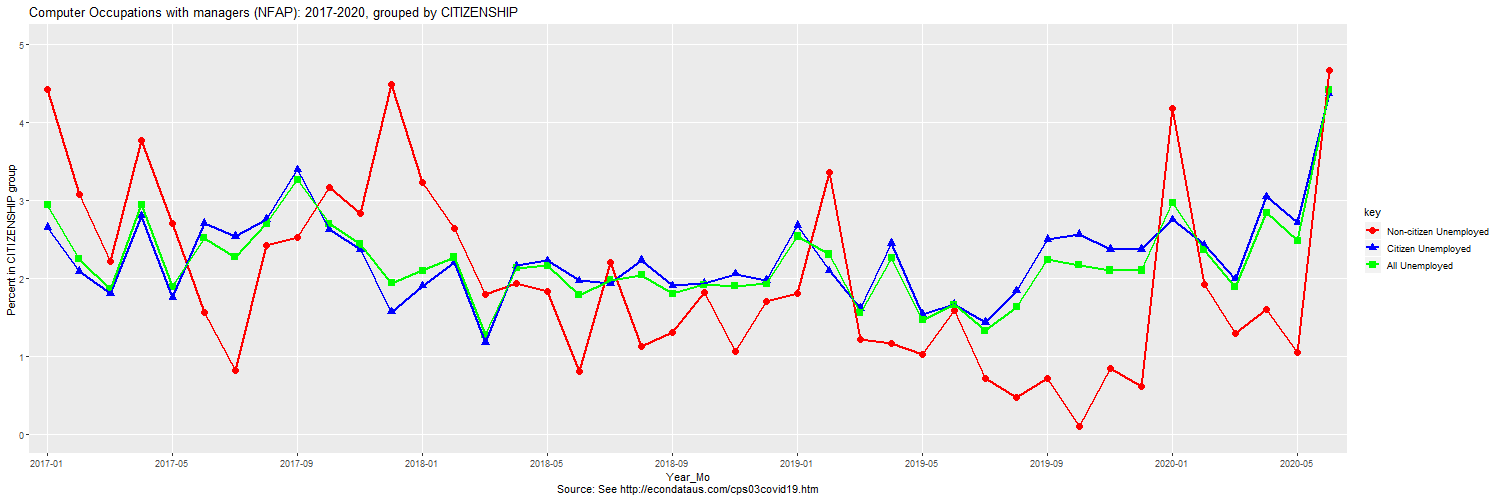
Computer and Mathematical Occupations: 2017-2020, grouped by CITIZENSHIP

   year_mo labor_force non_rate cit_rate all_rate non_count cit_count all_count
1  2017-01   4,925,576      4.7      2.5      2.8    35,608   104,685   140,294
2  2017-02   4,864,465      4.3      2.5      2.8    31,264   104,063   135,326
3  2017-03   4,765,096      1.8      2.1      2.0    12,341    84,248    96,590
4  2017-04   4,891,047      3.0      2.5      2.5    19,728   104,781   124,508
5  2017-05   4,746,049      2.3      1.8      1.8    16,358    71,373    87,731
6  2017-06   4,875,990      1.8      2.4      2.3    14,447    98,361   112,808
7  2017-07   4,809,441      1.3      2.3      2.2    10,290    93,324   103,614
8  2017-08   4,913,918      2.4      2.5      2.5    19,160   102,362   121,522
9  2017-09   5,050,421      2.4      2.9      2.8    19,137   123,427   142,563
10 2017-10   4,957,960      3.9      2.4      2.6    27,929    99,744   127,673
11 2017-11   5,192,807      3.8      2.3      2.5    27,252   101,252   128,505
12 2017-12   5,188,650      4.3      2.2      2.5    29,454    97,973   127,427
13 2018-01   5,362,693      3.1      2.8      2.8    23,571   128,228   151,799
14 2018-02   5,423,726      2.4      2.6      2.6    18,948   120,349   139,297
15 2018-03   5,313,240      1.2      1.5      1.4     9,243    67,028    76,272
16 2018-04   5,166,433      1.2      1.8      1.7     9,279    77,374    86,653
17 2018-05   5,191,494      1.2      2.6      2.4    10,227   112,899   123,126
18 2018-06   5,065,522      0.8      2.2      2.0     6,414    93,293    99,707
19 2018-07   5,158,464      1.8      2.0      2.0    14,578    86,841   101,420
20 2018-08   5,266,121      1.5      2.8      2.6    13,183   123,910   137,093
21 2018-09   5,137,030      1.3      2.2      2.0    10,777    93,123   103,900
22 2018-10   5,257,394      1.7      2.3      2.2    14,803   100,761   115,564
23 2018-11   5,343,396      1.9      2.6      2.5    16,354   115,727   132,081
24 2018-12   5,320,720      2.4      2.1      2.1    20,028    92,355   112,383
25 2019-01   5,278,705      2.6      2.4      2.4    22,450   104,668   127,118
26 2019-02   5,539,388      4.0      2.0      2.4    36,758    93,901   130,659
27 2019-03   5,319,788      1.9      1.6      1.6    16,341    70,966    87,307
28 2019-04   5,313,380      1.5      2.6      2.5    11,893   118,885   130,779
29 2019-05   5,384,440      0.6      1.4      1.3     4,205    67,604    71,809
30 2019-06   5,508,139      1.1      1.6      1.5     9,049    74,240    83,288
31 2019-07   5,671,678      0.9      1.4      1.3     6,843    69,041    75,884
32 2019-08   5,783,949      0.5      1.7      1.6     4,024    85,715    89,740
33 2019-09   5,570,780      1.3      2.6      2.4     9,879   123,347   133,225
34 2019-10   5,460,774      0.6      2.5      2.2     4,976   115,596   120,573
35 2019-11   5,406,374      1.4      2.6      2.4    12,467   115,833   128,300
36 2019-12   5,416,640      1.0      2.5      2.3     8,370   114,302   122,672
37 2020-01   5,815,714      4.2      2.9      3.0    35,909   141,194   177,103
38 2020-02   5,817,381      2.1      2.5      2.5    16,986   127,166   144,152
39 2020-03   5,792,608      1.9      2.5      2.4    16,499   123,260   139,759
40 2020-04   6,012,218      4.2      4.3      4.3    35,035   222,237   257,271
41 2020-05   6,002,364      2.1      4.0      3.7    17,633   207,430   225,062
As can be seen, the unemployment rate of citizen computer and math workers rose more than a percent in April and remained elevated at 4 percent in May. I initially assumed that this might be due to Mathematical Occupations. The following graph and table removes those occupations and looks only at computer occupations.
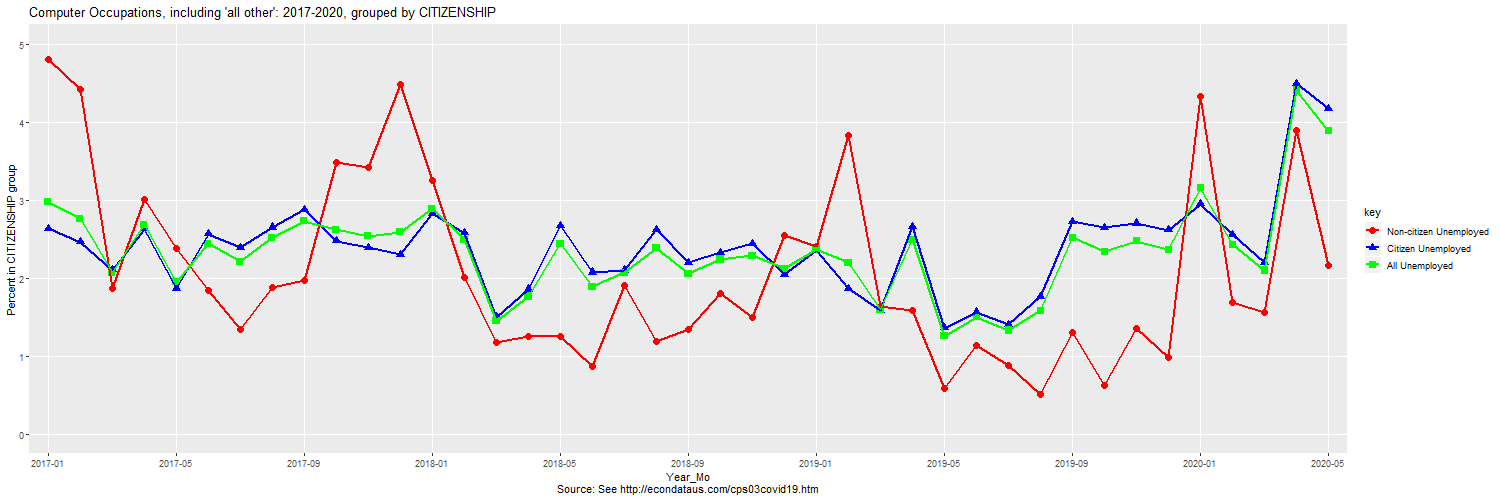
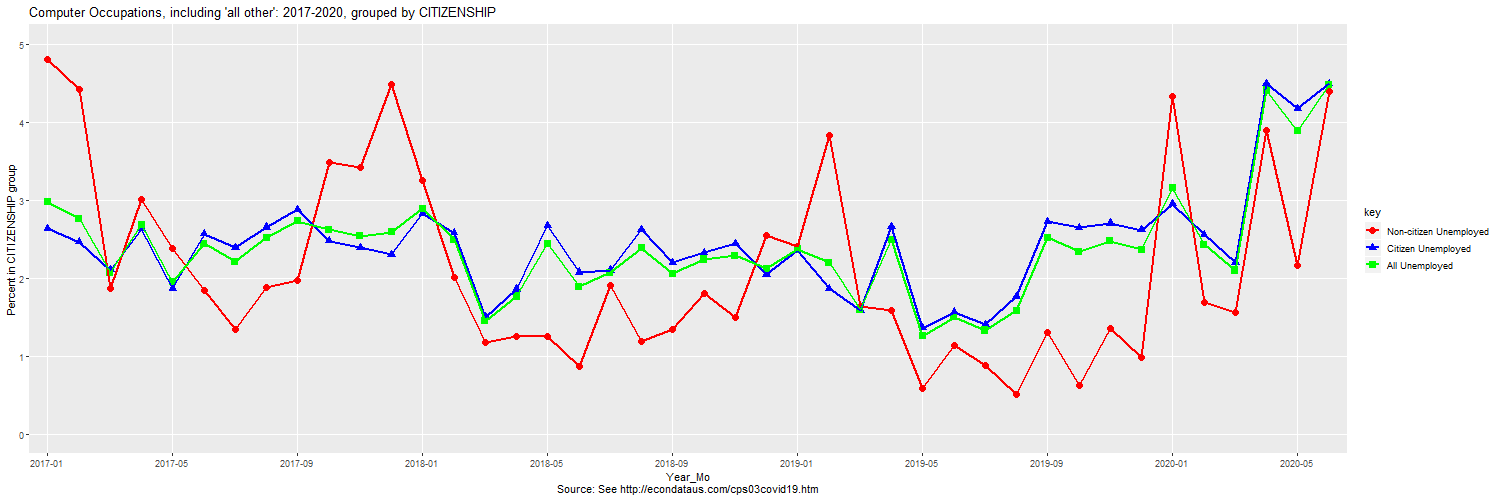
Computer Occupations, including 'all other': 2017-2020, grouped by CITIZENSHIP

   year_mo labor_force non_rate cit_rate all_rate non_count cit_count all_count
1  2017-01   4,685,816      4.8      2.6      3.0    35,608   103,944   139,552
2  2017-02   4,631,068      4.4      2.5      2.8    31,264    96,769   128,032
3  2017-03   4,498,666      1.9      2.1      2.1    12,341    80,915    93,256
4  2017-04   4,634,233      3.0      2.6      2.7    19,728   104,781   124,508
5  2017-05   4,498,814      2.4      1.9      2.0    16,358    71,373    87,731
6  2017-06   4,598,185      1.8      2.6      2.4    14,447    98,025   112,472
7  2017-07   4,512,675      1.3      2.4      2.2    10,290    89,706    99,996
8  2017-08   4,623,816      1.9      2.7      2.5    14,694   101,987   116,681
9  2017-09   4,716,498      2.0      2.9      2.7    15,191   113,710   128,901
10 2017-10   4,672,188      3.5      2.5      2.6    23,943    98,765   122,708
11 2017-11   4,917,446      3.4      2.4      2.5    23,590   101,252   124,842
12 2017-12   4,909,810      4.5      2.3      2.6    29,454    97,973   127,427
13 2018-01   5,091,390      3.3      2.8      2.9    23,571   123,616   147,187
14 2018-02   5,123,750      2.0      2.6      2.5    15,408   112,427   127,835
15 2018-03   5,049,461      1.2      1.5      1.5     9,243    64,204    73,447
16 2018-04   4,897,968      1.3      1.9      1.8     9,279    77,374    86,653
17 2018-05   4,944,899      1.3      2.7      2.4    10,227   110,594   120,821
18 2018-06   4,795,027      0.9      2.1      1.9     6,414    84,368    90,782
19 2018-07   4,891,323      1.9      2.1      2.1    14,578    86,841   101,420
20 2018-08   4,997,171      1.2      2.6      2.4    10,035   109,150   119,185
21 2018-09   4,866,778      1.3      2.2      2.1    10,777    89,525   100,303
22 2018-10   4,995,703      1.8      2.3      2.2    14,803    97,273   112,077
23 2018-11   5,055,289      1.5      2.4      2.3    12,677   103,087   115,764
24 2018-12   5,029,231      2.6      2.0      2.1    20,028    86,884   106,913
25 2019-01   4,947,938      2.4      2.4      2.4    19,223    98,116   117,339
26 2019-02   5,157,313      3.8      1.9      2.2    33,523    79,948   113,471
27 2019-03   4,965,726      1.6      1.6      1.6    13,177    66,263    79,440
28 2019-04   4,955,578      1.6      2.7      2.5    11,893   111,920   123,813
29 2019-05   5,061,264      0.6      1.4      1.3     4,205    59,402    63,607
30 2019-06   5,209,893      1.1      1.6      1.5     9,049    69,116    78,165
31 2019-07   5,386,494      0.9      1.4      1.3     6,843    64,925    71,768
32 2019-08   5,439,314      0.5      1.8      1.6     4,024    82,135    86,160
33 2019-09   5,279,188      1.3      2.7      2.5     9,879   123,347   133,225
34 2019-10   5,153,748      0.6      2.6      2.3     4,976   115,596   120,573
35 2019-11   5,142,270      1.4      2.7      2.5    11,913   115,492   127,405
36 2019-12   5,147,469      1.0      2.6      2.4     7,918   113,941   121,859
37 2020-01   5,476,662      4.3      3.0      3.2    35,387   137,614   173,001
38 2020-02   5,450,395      1.7      2.6      2.4    13,098   119,534   132,633
39 2020-03   5,421,957      1.6      2.2      2.1    12,903   101,111   114,014
40 2020-04   5,644,330      3.9      4.5      4.4    30,676   218,265   248,940
41 2020-05   5,682,895      2.2      4.2      3.9    17,633   203,287   220,920
As can be seen, the jump in unemployment of citizen computer workers looks even worse, having risen over 2 percent in April and remaining elevated at 4.2 percent in May. Looking at the difference between these computer occupations and those used by NFAP revealed a single difference. The NFAP analysis did not include the category of "Computer occupations, all other". The following graph and table shows the same data as above but with this category excluded.
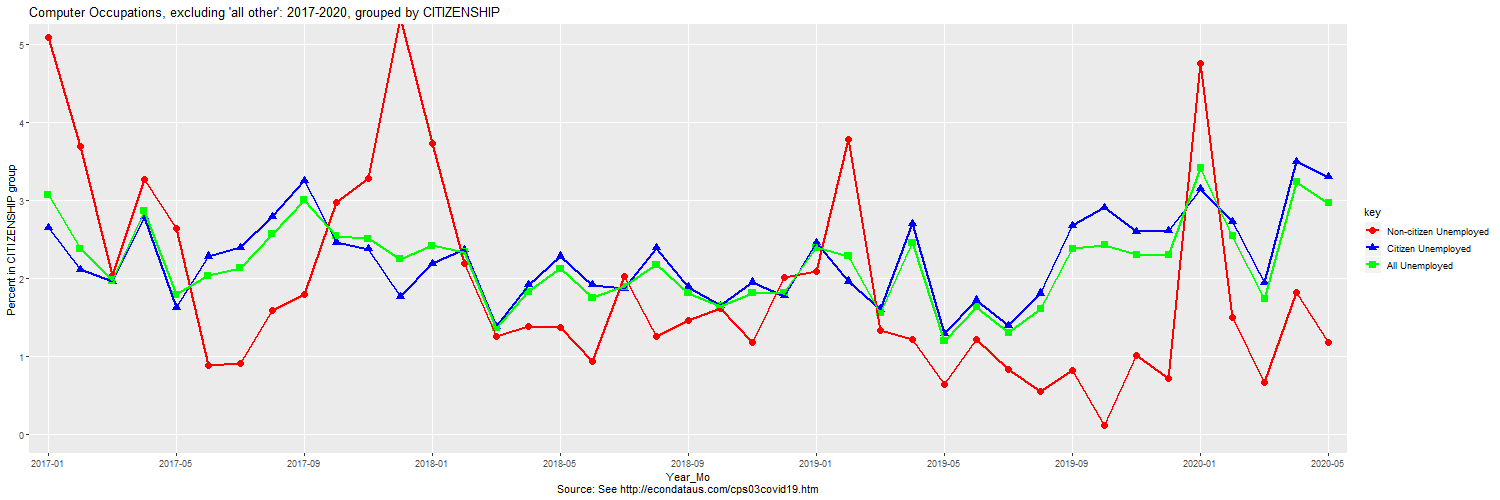
Computer Occupations, excluding 'all other': 2017-2020, grouped by CITIZENSHIP

   year_mo labor_force non_rate cit_rate all_rate non_count cit_count all_count
1  2017-01   4,007,870      5.1      2.6      3.1    35,608    87,596   123,204
2  2017-02   3,918,548      3.7      2.1      2.4    24,350    68,901    93,250
3  2017-03   3,829,361      2.0      2.0      2.0    12,341    63,254    75,595
4  2017-04   3,965,003      3.3      2.8      2.9    19,728    93,671   113,399
5  2017-05   3,867,750      2.6      1.6      1.8    16,358    52,831    69,189
6  2017-06   3,898,348      0.9      2.3      2.0     6,065    73,276    79,340
7  2017-07   3,828,896      0.9      2.4      2.1     6,121    75,587    81,708
8  2017-08   3,918,599      1.6      2.8      2.6    11,363    89,341   100,704
9  2017-09   3,960,729      1.8      3.3      3.0    12,258   106,583   118,842
10 2017-10   3,941,478      3.0      2.5      2.5    18,048    82,114   100,162
11 2017-11   4,090,703      3.3      2.4      2.5    20,012    82,677   102,688
12 2017-12   4,082,877      5.3      1.8      2.2    29,454    62,246    91,700
13 2018-01   4,175,172      3.7      2.2      2.4    23,571    77,469   101,040
14 2018-02   4,361,985      2.2      2.4      2.3    15,408    86,557   101,965
15 2018-03   4,348,462      1.3      1.4      1.4     9,243    49,864    59,108
16 2018-04   4,229,111      1.4      1.9      1.8     9,279    68,107    77,387
17 2018-05   4,267,987      1.4      2.3      2.1    10,227    80,350    90,577
18 2018-06   4,150,972      0.9      1.9      1.8     6,414    66,292    72,706
19 2018-07   4,190,791      2.0      1.9      1.9    14,578    64,870    79,448
20 2018-08   4,263,912      1.3      2.4      2.2    10,035    82,837    92,872
21 2018-09   4,098,584      1.5      1.9      1.8    10,777    63,501    74,279
22 2018-10   4,144,277      1.6      1.6      1.6    11,150    56,946    68,096
23 2018-11   4,202,758      1.2      1.9      1.8     8,745    67,430    76,176
24 2018-12   4,157,990      2.0      1.8      1.8    14,178    61,277    75,455
25 2019-01   4,177,774      2.1      2.5      2.4    15,205    84,748    99,954
26 2019-02   4,390,971      3.8      2.0      2.3    29,775    70,680   100,456
27 2019-03   4,268,305      1.3      1.6      1.6     9,725    56,739    66,464
28 2019-04   4,208,104      1.2      2.7      2.5     8,489    94,923   103,412
29 2019-05   4,319,862      0.6      1.3      1.2     4,205    47,377    51,582
30 2019-06   4,407,580      1.2      1.7      1.6     9,049    62,962    72,011
31 2019-07   4,479,548      0.8      1.4      1.3     6,052    52,331    58,383
32 2019-08   4,498,012      0.6      1.8      1.6     4,024    68,166    72,190
33 2019-09   4,388,361      0.8      2.7      2.4     5,701    98,829   104,531
34 2019-10   4,265,022      0.1      2.9      2.4       828   102,724   103,552
35 2019-11   4,269,342      1.0      2.6      2.3     7,978    90,299    98,277
36 2019-12   4,240,336      0.7      2.6      2.3     5,037    92,363    97,400
37 2020-01   4,525,050      4.8      3.1      3.4    35,387   118,943   154,329
38 2020-02   4,497,895      1.5      2.7      2.5    10,061   104,268   114,329
39 2020-03   4,596,253      0.7      1.9      1.7     5,115    74,602    79,717
40 2020-04   4,735,566      1.8      3.5      3.2    13,588   139,462   153,050
41 2020-05   4,855,682      1.2      3.3      3.0     8,921   135,082   144,003
As can be seen, this data looks much more like the NFAP data without managers. For all workers, that data showed percentages of 3.2, 2.5, 1.8, 3.2, and 2.8 for January through May. This data shows 3.4, 2.5, 1.7, 3.2, and 3.0, all within 0.2 percent of the NFAP data. The only difference now is that the NFAP occupations include Computer hardware engineer (1400) and Electrical and electronics engineer (1410). The following graph and table look only at these categories.
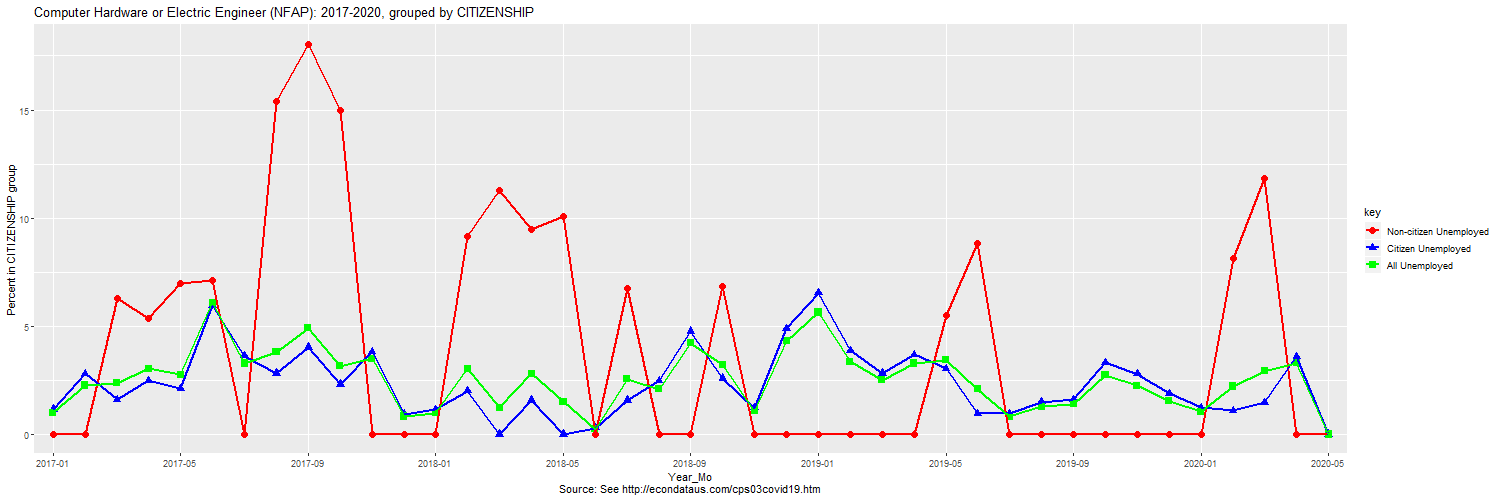
Computer Hardware or Electric Engineer (NFAP): 2017-2020, grouped by CITIZENSHIP

   year_mo labor_force non_rate cit_rate all_rate non_count cit_count all_count
1  2017-01   410,256.8      0.0      1.2      1.0         0     4,102     4,102
2  2017-02   403,952.2      0.0      2.8      2.3         0     9,150     9,150
3  2017-03   378,590.6      6.3      1.6      2.4     3,884     5,096     8,980
4  2017-04   356,360.1      5.4      2.5      3.0     3,639     7,158    10,797
5  2017-05   382,853.4      7.0      2.1      2.8     3,564     7,018    10,582
6  2017-06   389,183.4      7.1      5.9      6.1     3,703    20,030    23,733
7  2017-07   373,872.6      0.0      3.6      3.3         0    12,265    12,265
8  2017-08   348,857.9     15.4      2.8      3.8     4,228     9,063    13,291
9  2017-09   331,882.1     18.0      4.0      4.9     3,791    12,511    16,302
10 2017-10   370,959.3     15.0      2.3      3.1     3,619     8,051    11,669
11 2017-11   353,286.7      0.0      3.8      3.5         0    12,384    12,384
12 2017-12   424,247.0      0.0      0.9      0.8         0     3,519     3,519
13 2018-01   407,900.9      0.0      1.1      1.0         0     3,973     3,973
14 2018-02   403,846.3      9.2      2.0      3.0     5,355     6,918    12,273
15 2018-03   402,055.9     11.3      0.0      1.2     4,949         0     4,949
16 2018-04   348,383.5      9.5      1.6      2.8     5,159     4,635     9,793
17 2018-05   359,891.9     10.1      0.0      1.5     5,437         0     5,437
18 2018-06   354,240.6      0.0      0.3      0.2         0       861       861
19 2018-07   314,863.1      6.8      1.6      2.6     4,066     4,001     8,067
20 2018-08   275,907.9      0.0      2.5      2.1         0     5,792     5,792
21 2018-09   283,758.9      0.0      4.8      4.2         0    11,980    11,980
22 2018-10   330,312.1      6.9      2.6      3.2     3,382     7,292    10,674
23 2018-11   323,424.9      0.0      1.2      1.1         0     3,489     3,489
24 2018-12   375,043.9      0.0      4.9      4.3         0    16,135    16,135
25 2019-01   375,283.8      0.0      6.5      5.6         0    21,157    21,157
26 2019-02   404,684.6      0.0      3.9      3.4         0    13,578    13,578
27 2019-03   405,971.4      0.0      2.8      2.5         0    10,208    10,208
28 2019-04   381,127.8      0.0      3.7      3.3         0    12,500    12,500
29 2019-05   428,547.5      5.5      3.0      3.4     3,692    11,004    14,696
30 2019-06   369,176.8      8.8      1.0      2.1     4,676     3,037     7,713
31 2019-07   375,490.0      0.0      1.0      0.8         0     3,051     3,051
32 2019-08   366,928.0      0.0      1.5      1.3         0     4,694     4,694
33 2019-09   307,366.5      0.0      1.6      1.4         0     4,322     4,322
34 2019-10   369,911.2      0.0      3.3      2.7         0    10,137    10,137
35 2019-11   364,136.4      0.0      2.8      2.3         0     8,208     8,208
36 2019-12   325,121.5      0.0      1.9      1.5         0     4,996     4,996
37 2020-01   336,924.4      0.0      1.2      1.1         0     3,567     3,567
38 2020-02   375,814.8      8.1      1.1      2.2     4,881     3,462     8,343
39 2020-03   381,110.7     11.8      1.5      2.9     6,343     4,814    11,157
40 2020-04   396,684.7      0.0      3.6      3.3         0    13,059    13,059
41 2020-05   352,812.3      0.0      0.0      0.0         0         0         0
As can be seen, there's nothing that remarkable about these occupations except that they seem to include relatively few non-citizens. One odd thing is that the total number of unemployed went from 13,059 in April to zero in May. This data comes from the Current Population Survey (CPS) and samples just 60,000 eligible households per month. Hence, each survey might represent 2,000 or more workers and this limits the precision of the numbers. Still, this is the only time that the total unemployment has reached zero since at least 2016 so this could merit more investigation. In any event, the following graph and table look only at the category of "Computer Occupations, all other".
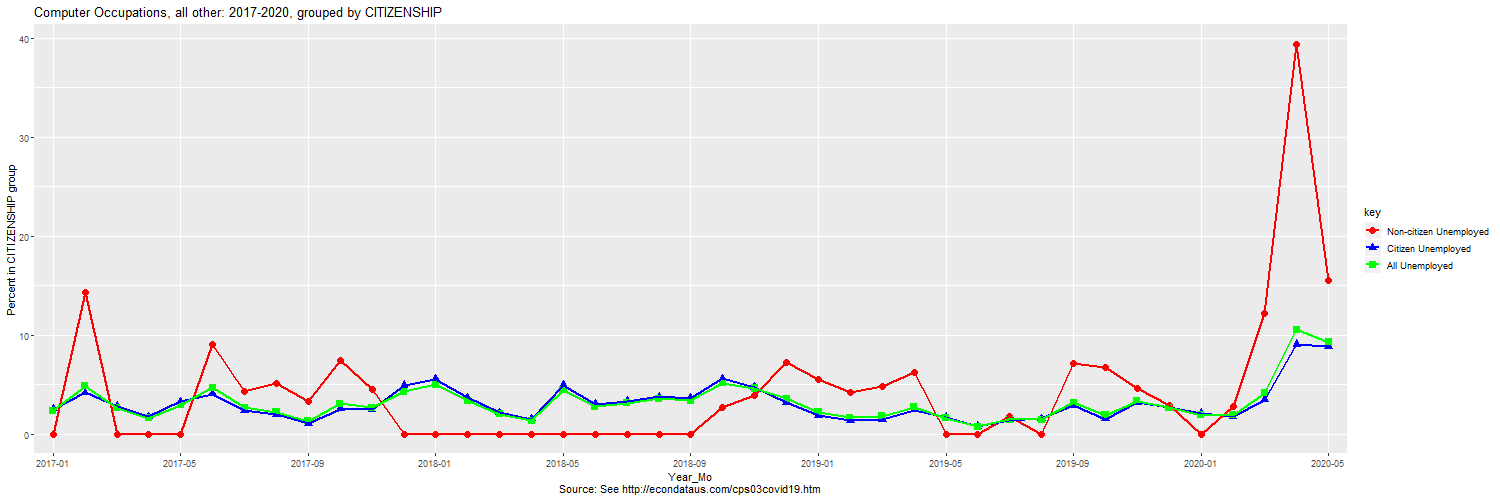
Computer Occupations, all other: 2017-2020, grouped by CITIZENSHIP

   year_mo labor_force non_rate cit_rate all_rate non_count cit_count all_count
1  2017-01   677,945.8      0.0      2.6      2.4         0    16,348    16,348
2  2017-02   712,520.1     14.3      4.2      4.9     6,914    27,868    34,782
3  2017-03   669,304.8      0.0      2.9      2.6         0    17,661    17,661
4  2017-04   669,229.8      0.0      1.8      1.7         0    11,110    11,110
5  2017-05   631,063.3      0.0      3.3      2.9         0    18,542    18,542
6  2017-06   699,837.5      9.1      4.1      4.7     8,383    24,750    33,132
7  2017-07   683,779.0      4.3      2.4      2.7     4,169    14,118    18,287
8  2017-08   705,217.4      5.1      2.0      2.3     3,331    12,646    15,977
9  2017-09   755,768.2      3.3      1.1      1.3     2,933     7,126    10,060
10 2017-10   730,710.4      7.5      2.6      3.1     5,895    16,651    22,546
11 2017-11   826,743.1      4.6      2.5      2.7     3,578    18,576    22,154
12 2017-12   826,933.2      0.0      5.0      4.3         0    35,727    35,727
13 2018-01   916,218.2      0.0      5.6      5.0         0    46,147    46,147
14 2018-02   761,765.2      0.0      3.7      3.4         0    25,870    25,870
15 2018-03   700,998.6      0.0      2.2      2.0         0    14,340    14,340
16 2018-04   668,857.7      0.0      1.5      1.4         0     9,266     9,266
17 2018-05   676,912.7      0.0      5.0      4.5         0    30,244    30,244
18 2018-06   644,054.9      0.0      3.0      2.8         0    18,076    18,076
19 2018-07   700,532.4      0.0      3.3      3.1         0    21,972    21,972
20 2018-08   733,258.8      0.0      3.8      3.6         0    26,313    26,313
21 2018-09   768,193.6      0.0      3.7      3.4         0    26,024    26,024
22 2018-10   851,425.7      2.8      5.6      5.2     3,653    40,328    43,981
23 2018-11   852,530.7      3.9      4.7      4.6     3,932    35,656    39,588
24 2018-12   871,240.8      7.3      3.2      3.6     5,850    25,607    31,457
25 2019-01   770,163.6      5.6      1.9      2.3     4,018    13,368    17,386
26 2019-02   766,341.9      4.2      1.4      1.7     3,748     9,267    13,015
27 2019-03   697,420.9      4.8      1.5      1.9     3,452     9,524    12,976
28 2019-04   747,473.6      6.2      2.5      2.7     3,404    16,997    20,401
29 2019-05   741,401.5      0.0      1.7      1.6         0    12,025    12,025
30 2019-06   802,313.8      0.0      0.8      0.8         0     6,154     6,154
31 2019-07   906,945.2      1.8      1.5      1.5       791    12,594    13,385
32 2019-08   941,302.6      0.0      1.6      1.5         0    13,969    13,969
33 2019-09   890,826.3      7.2      2.9      3.2     4,177    24,517    28,695
34 2019-10   888,725.5      6.8      1.6      1.9     4,148    12,872    17,021
35 2019-11   872,928.0      4.7      3.2      3.3     3,935    25,193    29,128
36 2019-12   907,133.2      2.9      2.7      2.7     2,881    21,578    24,459
37 2020-01   951,611.7      0.0      2.1      2.0         0    18,671    18,671
38 2020-02   952,499.8      2.9      1.8      1.9     3,038    15,266    18,304
39 2020-03   825,703.9     12.2      3.5      4.2     7,789    26,508    34,297
40 2020-04   908,764.6     39.4      9.1     10.6    17,088    78,803    95,891
41 2020-05   827,213.0     15.5      8.8      9.3     8,711    68,206    76,917
As can be seen, the unemployment rate of non-citizen workers in this category spiked in April to 39.4 percent but fell to 15.5 percent in May. On the other hand, the unemployment rate of citizen workers in this category grew from 3.5 percent to 9.1 percent in April and has recovered only slightly, to 8.8 percent. This seems to have been the category of computer occupations hit hardest by the COVID-19 crisis and represents the best argument for holding off on any additional non-citizen immigration for computer jobs. Perhaps not coincidentally, this was the category of computer occupation that was excluded in the NFAP analysis. This would seem an additional reason for media to require that such analyses include the means to reproduce them. That would likely have allowed these problems to be found much sooner.
Forbes Posts Another Stuart Anderson Editorial with the Same Numbers
On June 23, 2020, Forbes Magazine posted an article by Stuart Anderson titled New Trump H-1B Visa Restrictions Will Harm Companies. As the title suggests, it is in response to the new proclamation from Trump to restrict certain temporary visas. It repeats a claim in his prior editorial, stating:
The unemployment rate for individuals in computer occupations declined from 3% in January 2020 (before the pandemic spread in the U.S.) to 2.8% in April 2020, and fell again to 2.5% in May 2020, according to an analysis of the Bureau of Labor Statistics' Current Population Survey by the National Foundation for American Policy (NFAP). The unemployment rate in computer occupations has been stable and, in fact, falling. The vast majority of H-1B visa holders work in computer occupations.
Unlike the prior editorial, this one no longer mentions the lower unemployment rates of 2.4% and 1.9% in February and March, respectively. It appears that this provided too much context for the readers to handle. In any case, the problems with Stuart Anderson's numbers are summarized in the final section below.
Washington Post Posts an Editorial Quoting Stuart Anderson's 2.5 Number for May
On June 29, 2020, the Washington Post posted an editorial by their columnist, Catherine Rampell, titled Trump's visa suspensions may permanently damage America's reputation. The editorial references a Forbes editorial in the following statement:
While unemployment overall is in double digits, in his field - computer-related occupations - unemployment has declined since the pandemic began, hitting 2.5 percent in May.
On June 29th, I wrote the Washington Post corrections department at corrections@washpost.com to report this error but I have received no response. On July 2nd, Ron Hira, a professor at Howard University, tweeted about the same problem to the Washington Post, Catherine Rampell, and Glenn Kessler, the chief writer of Washington Post's Fact Checker. He included a graph of the BLS series LNU04034021 whose series title is "(Unadj) Unemployment Rate - Computer and Mathematical Occupation". It shows that the unemployment rate for these occupations was 3.7% in May & 4.3% in June. It's possible to see both the 3.7 number for May and the 4.3 number for June on the BLS website. It's also possible to generate a graph and table of the series by going to this page on the BLS website, typing in the series id LNU04034021, clicking Next, change the year range if desired, check the "include graphs" checkbox, and click "Retrieve Data". Following is the resultant graph and table when specifying the starting year as 2013:
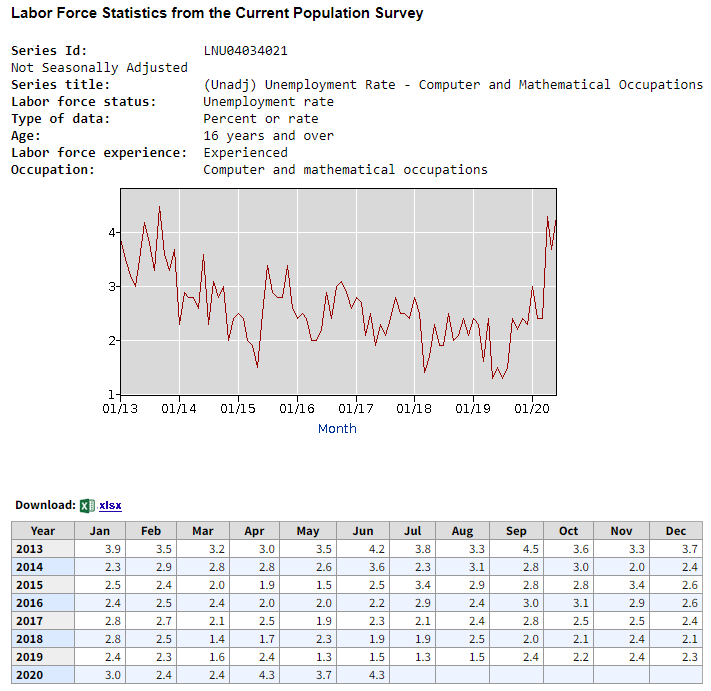
As can be seen, the unemployment rate for Computer and Mathematical occupations reached 4.3 percent in June, its highest level since September of 2013, during its recovery from the financial crisis.
Unemployment Rate for Computer Occupations Soars in June, Even By Stuart Anderson's Definition
On July 9, 2020, the Basic Monthly CPS data for June became available on the Census website. The following graph and table shows the updated results using Stuart Anderson's questionable definition of computer occupations.
Computer Occupations with managers (NFAP): 2017-2020, grouped by CITIZENSHIP

   year_mo labor_force non_rate cit_rate all_rate non_count cit_count all_count
1  2017-01   5,083,329      4.4      2.7      2.9    35,608   113,686   149,294
2  2017-02   5,007,023      3.1      2.1      2.2    24,350    88,110   112,460
3  2017-03   4,921,265      2.2      1.8      1.9    16,225    75,456    91,681
4  2017-04   4,983,520      3.8      2.8      2.9    27,594   119,085   146,679
5  2017-05   4,887,519      2.7      1.7      1.9    19,922    72,621    92,543
6  2017-06   4,871,279      1.6      2.7      2.5    12,476   110,183   122,659
7  2017-07   4,777,019      0.8      2.5      2.3     6,121   102,340   108,461
8  2017-08   4,887,736      2.4      2.8      2.7    19,337   112,815   132,153
9  2017-09   4,941,581      2.5      3.4      3.3    19,055   142,162   161,217
10 2017-10   4,973,484      3.2      2.6      2.7    21,667   112,810   134,477
11 2017-11   5,097,665      2.8      2.4      2.4    20,012   104,162   124,173
12 2017-12   5,168,565      4.5      1.6      1.9    29,454    70,786   100,240
13 2018-01   5,204,071      3.2      1.9      2.1    24,481    84,624   109,104
14 2018-02   5,386,050      2.6      2.2      2.3    21,772   100,409   122,182
15 2018-03   5,341,738      1.8      1.2      1.3    15,174    52,967    68,141
16 2018-04   5,187,960      1.9      2.2      2.1    15,372    95,131   110,503
17 2018-05   5,241,516      1.8      2.2      2.2    15,664    97,719   113,383
18 2018-06   5,144,426      0.8      2.0      1.8     6,414    85,569    91,983
19 2018-07   5,142,346      2.2      1.9      2.0    18,644    83,032   101,676
20 2018-08   5,156,508      1.1      2.2      2.0    10,035    95,221   105,256
21 2018-09   5,004,165      1.3      1.9      1.8    10,777    79,570    90,347
22 2018-10   5,169,572      1.8      1.9      1.9    14,532    84,735    99,267
23 2018-11   5,186,986      1.1      2.1      1.9     8,745    89,765    98,510
24 2018-12   5,234,781      1.7      2.0      1.9    14,178    86,988   101,166
25 2019-01   5,154,654      1.8      2.7      2.5    15,205   115,648   130,854
26 2019-02   5,429,520      3.4      2.1      2.3    30,370    94,890   125,260
27 2019-03   5,271,519      1.2      1.6      1.6    10,295    71,602    81,897
28 2019-04   5,221,387      1.2      2.4      2.3     9,135   108,711   117,846
29 2019-05   5,413,793      1.0      1.5      1.5     7,897    71,472    79,369
30 2019-06   5,406,565      1.6      1.7      1.7    13,725    76,018    89,743
31 2019-07   5,533,182      0.7      1.4      1.3     6,052    67,442    73,495
32 2019-08   5,630,362      0.5      1.8      1.6     4,024    87,974    91,998
33 2019-09   5,410,845      0.7      2.5      2.2     5,701   115,425   121,126
34 2019-10   5,311,873      0.1      2.6      2.2       828   114,536   115,363
35 2019-11   5,301,418      0.8      2.4      2.1     7,978   103,430   111,408
36 2019-12   5,269,303      0.6      2.4      2.1     5,037   105,728   110,765
37 2020-01   5,540,113      4.2      2.8      3.0    35,387   129,266   164,653
38 2020-02   5,602,755      1.9      2.4      2.4    14,942   117,460   132,402
39 2020-03   5,794,298      1.3      2.0      1.9    11,458    97,810   109,268
40 2020-04   5,955,976      1.6      3.1      2.8    13,588   155,760   169,348
41 2020-05   6,030,322      1.0      2.7      2.5     8,921   140,820   149,741
42 2020-06   6,310,136      4.7      4.4      4.4    44,361   234,111   278,472
As can be seen, even Anderson's questionable definition shows the unemployment rate of computer occupations soaring almost 2 percent, from 2.5 percent in May to 4.4 percent in June. As described in the Summary section below, an arguably better model includes the "Computer Occupations, all other" category and excludes the "Computer and information systems manager" category. The following graph and table show the results for that definition.
Computer Occupations, including 'all other': 2017-2020, grouped by CITIZENSHIP

   year_mo labor_force non_rate cit_rate all_rate non_count cit_count all_count
1  2017-01   4,685,816      4.8      2.6      3.0    35,608   103,944   139,552
2  2017-02   4,631,068      4.4      2.5      2.8    31,264    96,769   128,032
3  2017-03   4,498,666      1.9      2.1      2.1    12,341    80,915    93,256
4  2017-04   4,634,233      3.0      2.6      2.7    19,728   104,781   124,508
5  2017-05   4,498,814      2.4      1.9      2.0    16,358    71,373    87,731
6  2017-06   4,598,185      1.8      2.6      2.4    14,447    98,025   112,472
7  2017-07   4,512,675      1.3      2.4      2.2    10,290    89,706    99,996
8  2017-08   4,623,816      1.9      2.7      2.5    14,694   101,987   116,681
9  2017-09   4,716,498      2.0      2.9      2.7    15,191   113,710   128,901
10 2017-10   4,672,188      3.5      2.5      2.6    23,943    98,765   122,708
11 2017-11   4,917,446      3.4      2.4      2.5    23,590   101,252   124,842
12 2017-12   4,909,810      4.5      2.3      2.6    29,454    97,973   127,427
13 2018-01   5,091,390      3.3      2.8      2.9    23,571   123,616   147,187
14 2018-02   5,123,750      2.0      2.6      2.5    15,408   112,427   127,835
15 2018-03   5,049,461      1.2      1.5      1.5     9,243    64,204    73,447
16 2018-04   4,897,968      1.3      1.9      1.8     9,279    77,374    86,653
17 2018-05   4,944,899      1.3      2.7      2.4    10,227   110,594   120,821
18 2018-06   4,795,027      0.9      2.1      1.9     6,414    84,368    90,782
19 2018-07   4,891,323      1.9      2.1      2.1    14,578    86,841   101,420
20 2018-08   4,997,171      1.2      2.6      2.4    10,035   109,150   119,185
21 2018-09   4,866,778      1.3      2.2      2.1    10,777    89,525   100,303
22 2018-10   4,995,703      1.8      2.3      2.2    14,803    97,273   112,077
23 2018-11   5,055,289      1.5      2.4      2.3    12,677   103,087   115,764
24 2018-12   5,029,231      2.6      2.0      2.1    20,028    86,884   106,913
25 2019-01   4,947,938      2.4      2.4      2.4    19,223    98,116   117,339
26 2019-02   5,157,313      3.8      1.9      2.2    33,523    79,948   113,471
27 2019-03   4,965,726      1.6      1.6      1.6    13,177    66,263    79,440
28 2019-04   4,955,578      1.6      2.7      2.5    11,893   111,920   123,813
29 2019-05   5,061,264      0.6      1.4      1.3     4,205    59,402    63,607
30 2019-06   5,209,893      1.1      1.6      1.5     9,049    69,116    78,165
31 2019-07   5,386,494      0.9      1.4      1.3     6,843    64,925    71,768
32 2019-08   5,439,314      0.5      1.8      1.6     4,024    82,135    86,160
33 2019-09   5,279,188      1.3      2.7      2.5     9,879   123,347   133,225
34 2019-10   5,153,748      0.6      2.6      2.3     4,976   115,596   120,573
35 2019-11   5,142,270      1.4      2.7      2.5    11,913   115,492   127,405
36 2019-12   5,147,469      1.0      2.6      2.4     7,918   113,941   121,859
37 2020-01   5,476,662      4.3      3.0      3.2    35,387   137,614   173,001
38 2020-02   5,450,395      1.7      2.6      2.4    13,098   119,534   132,633
39 2020-03   5,421,957      1.6      2.2      2.1    12,903   101,111   114,014
40 2020-04   5,644,330      3.9      4.5      4.4    30,676   218,265   248,940
41 2020-05   5,682,895      2.2      4.2      3.9    17,633   203,287   220,920
42 2020-06   5,892,368      4.4      4.5      4.5    38,611   225,547   264,158
As can be seen, this better definition shows a nearly identical unemployment rate of 4.5 percent for June. It is unclear exactly why the two definitions are now in agreement. It may be some combination of the unemployment rate of managers starting to increase and the unemployment rate of the "All Other" category becoming closer to that of other computer occupations. In any event, both definitions now show the unemployment rate of U.S. workers in computer occupations to be at their highest level since at least January of 2017. It will be interesting to see if Stuart Anderson releases an update of his numbers and admit that the numbers now show that the unemployment rate of computer occupations is very much increasing, not decreasing as he stated in his prior editorials. More likely, he will just move on to other topics.
Note: The above two graphs and tables can be reproduced with the program in this section by changing line 40 from "maxmnth <- 5" to "maxmnth <- 6". In addition, the first graph and table are generated by uncommenting just the occt assignment on line 49, occt <- "Computer Occupations with managers (NFAP)". The second graph and table are generated by uncommenting just the occt assignment on line 45, occt <- "Computer Occupations, including 'all other'".
Unemployment Rate for Computer and Mathematical Occupations Continues to Rise in July
On August 7, 2020, The Bureau of Labor Statistics released the Employment Situation report for July 2020. The report begins:
Total nonfarm payroll employment rose by 1.8 million in July, and the unemployment rate fell to 10.2 percent, the U.S. Bureau of Labor Statistics reported today. These improvements in the labor market reflected the continued resumption of economic activity that had been curtailed due to the coronavirus (COVID-19) pandemic and efforts to contain it. In July, notable job gains occurred in leisure and hospitality, government, retail trade, professional and business services, other services, and health care.
It's possible to look at the unemployment rate for Computer and Mathematical Occupations by going to this page on the BLS website, typing in the series id LNU04034021, clicking Next, change the year range if desired, check the "include graphs" checkbox, and click "Retrieve Data". Following is the resultant graph and table when specifying the starting year as 2013:
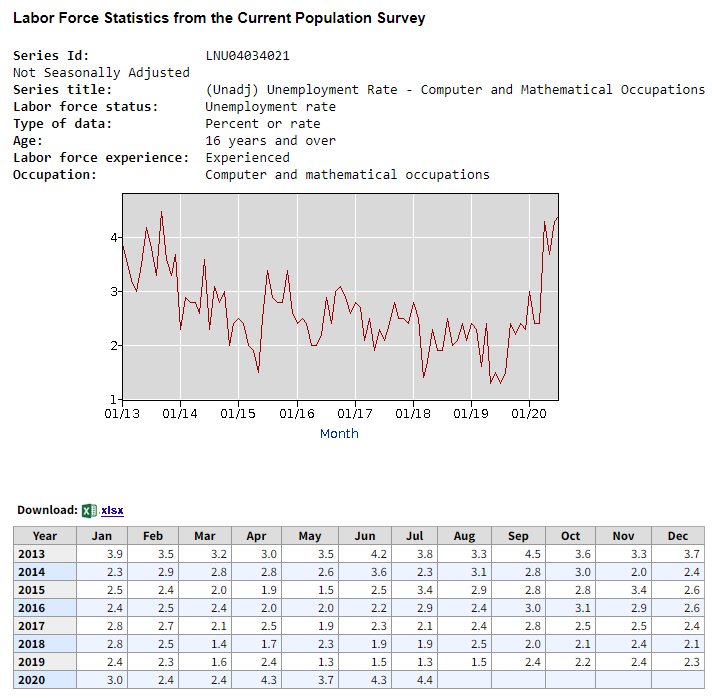
As can be seen, the unemployment rate for Computer and Mathematical occupations rose slightly to 4.4 percent in July, its highest level since September of 2013, during its recovery from the financial crisis.
Unemployment Rate for Computer and Mathematical Occupations Continues to Rise in August
On September 4, 2020, The Bureau of Labor Statistics released the Employment Situation report for August 2020. The report begins:
Total nonfarm payroll employment rose by 1.4 million in August, and the unemployment rate fell to 8.4 percent, the U.S. Bureau of Labor Statistics reported today. These improvements in the labor market reflect the continued resumption of economic activity that had been curtailed due to the coronavirus (COVID-19) pandemic and efforts to contain it. In August, an increase in government employment largely reflected temporary hiring for the 2020 Census. Notable job gains also occurred in retail trade, in professional and business services, in leisure and hospitality, and in education and health services.
It's possible to look at the unemployment rate for Computer and Mathematical Occupations by going to this page on the BLS website, typing in the series id LNU04034021, clicking Next, change the year range if desired, check the "include graphs" checkbox, and click "Retrieve Data". Following is the resultant graph and table when specifying the starting year as 2012:
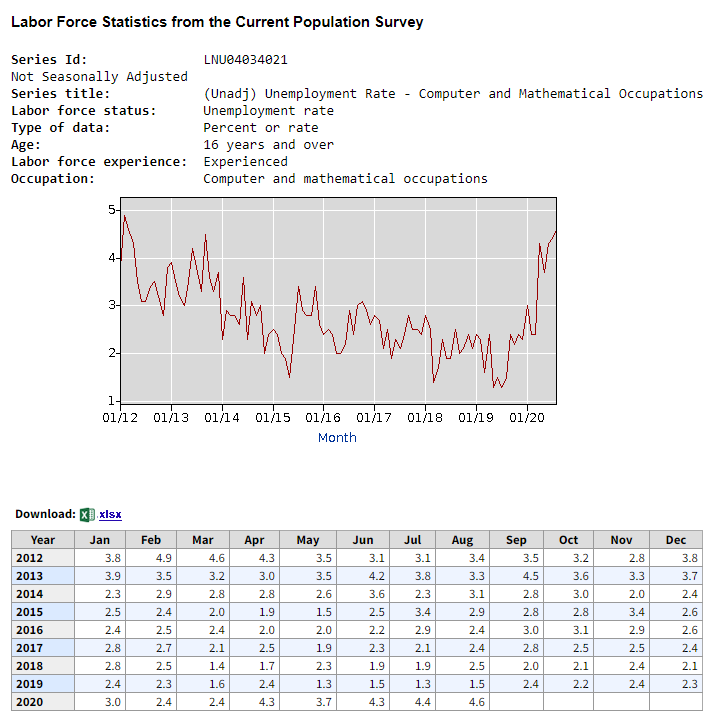
As can be seen, the unemployment rate for Computer and Mathematical occupations rose to 4.6 in August, its highest level since February of 2012, during its recovery from the financial crisis.
On September 9, 2020, the Basic Monthly CPS data for August became available on the Census website. The following graph and table shows the updated results using Stuart Anderson's questionable definition of computer occupations.
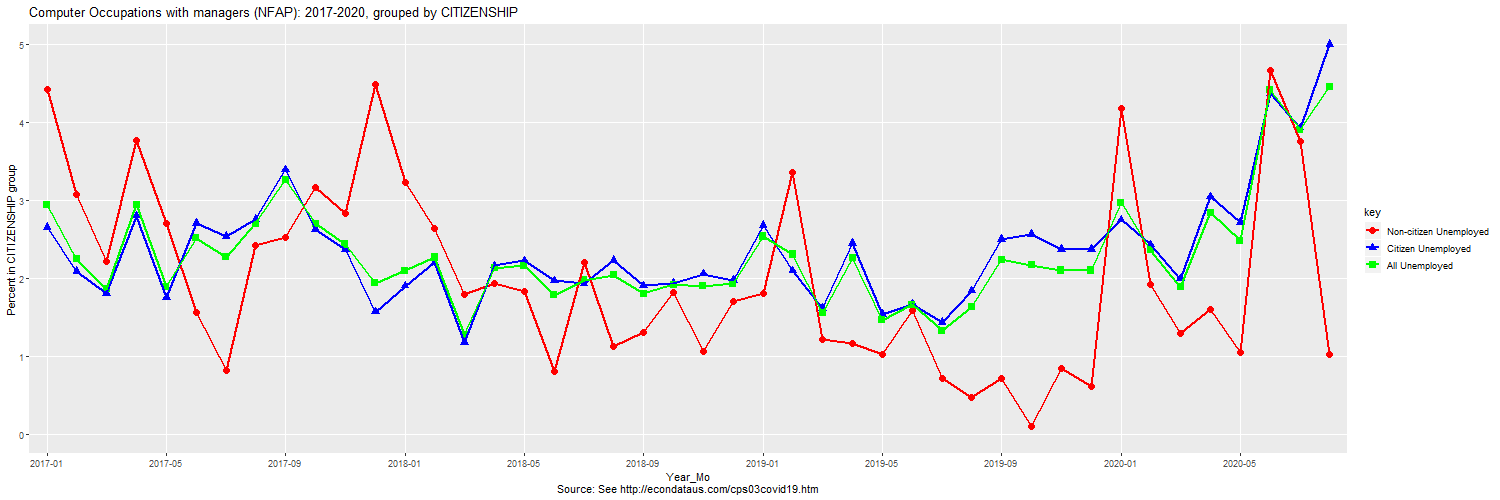
Computer Occupations with managers (NFAP): 2017-2020, grouped by CITIZENSHIP

   year_mo labor_force non_rate cit_rate all_rate non_count cit_count all_count
1  2017-01   5,083,329      4.4      2.7      2.9    35,608   113,686   149,294
2  2017-02   5,007,023      3.1      2.1      2.2    24,350    88,110   112,460
3  2017-03   4,921,265      2.2      1.8      1.9    16,225    75,456    91,681
4  2017-04   4,983,520      3.8      2.8      2.9    27,594   119,085   146,679
5  2017-05   4,887,519      2.7      1.7      1.9    19,922    72,621    92,543
6  2017-06   4,871,279      1.6      2.7      2.5    12,476   110,183   122,659
7  2017-07   4,777,019      0.8      2.5      2.3     6,121   102,340   108,461
8  2017-08   4,887,736      2.4      2.8      2.7    19,337   112,815   132,153
9  2017-09   4,941,581      2.5      3.4      3.3    19,055   142,162   161,217
10 2017-10   4,973,484      3.2      2.6      2.7    21,667   112,810   134,477
11 2017-11   5,097,665      2.8      2.4      2.4    20,012   104,162   124,173
12 2017-12   5,168,565      4.5      1.6      1.9    29,454    70,786   100,240
13 2018-01   5,204,071      3.2      1.9      2.1    24,481    84,624   109,104
14 2018-02   5,386,050      2.6      2.2      2.3    21,772   100,409   122,182
15 2018-03   5,341,738      1.8      1.2      1.3    15,174    52,967    68,141
16 2018-04   5,187,960      1.9      2.2      2.1    15,372    95,131   110,503
17 2018-05   5,241,516      1.8      2.2      2.2    15,664    97,719   113,383
18 2018-06   5,144,426      0.8      2.0      1.8     6,414    85,569    91,983
19 2018-07   5,142,346      2.2      1.9      2.0    18,644    83,032   101,676
20 2018-08   5,156,508      1.1      2.2      2.0    10,035    95,221   105,256
21 2018-09   5,004,165      1.3      1.9      1.8    10,777    79,570    90,347
22 2018-10   5,169,572      1.8      1.9      1.9    14,532    84,735    99,267
23 2018-11   5,186,986      1.1      2.1      1.9     8,745    89,765    98,510
24 2018-12   5,234,781      1.7      2.0      1.9    14,178    86,988   101,166
25 2019-01   5,154,654      1.8      2.7      2.5    15,205   115,648   130,854
26 2019-02   5,429,520      3.4      2.1      2.3    30,370    94,890   125,260
27 2019-03   5,271,519      1.2      1.6      1.6    10,295    71,602    81,897
28 2019-04   5,221,387      1.2      2.4      2.3     9,135   108,711   117,846
29 2019-05   5,413,793      1.0      1.5      1.5     7,897    71,472    79,369
30 2019-06   5,406,565      1.6      1.7      1.7    13,725    76,018    89,743
31 2019-07   5,533,182      0.7      1.4      1.3     6,052    67,442    73,495
32 2019-08   5,630,362      0.5      1.8      1.6     4,024    87,974    91,998
33 2019-09   5,410,845      0.7      2.5      2.2     5,701   115,425   121,126
34 2019-10   5,311,873      0.1      2.6      2.2       828   114,536   115,363
35 2019-11   5,301,418      0.8      2.4      2.1     7,978   103,430   111,408
36 2019-12   5,269,303      0.6      2.4      2.1     5,037   105,728   110,765
37 2020-01   5,540,113      4.2      2.8      3.0    35,387   129,266   164,653
38 2020-02   5,602,755      1.9      2.4      2.4    14,942   117,460   132,402
39 2020-03   5,794,298      1.3      2.0      1.9    11,458    97,810   109,268
40 2020-04   5,955,976      1.6      3.1      2.8    13,588   155,760   169,348
41 2020-05   6,030,322      1.0      2.7      2.5     8,921   140,820   149,741
42 2020-06   6,310,136      4.7      4.4      4.4    44,361   234,111   278,472
43 2020-07   6,044,541      3.7      3.9      3.9    29,628   206,333   235,961
44 2020-08   5,875,240      1.0      5.0      4.5     8,277   253,568   261,845
As can be seen, even Anderson's questionable definition shows the unemployment rate of computer occupations soaring 2 percent, from 2.5 percent in May to 4.5 percent in August. Looking just at computer occupations held by U.S. citizens, the unemployment rate rose from 2.7 percent in May to 5.0 percent in August. As described in the Summary section below, an arguably better model includes the "Computer Occupations, all other" category and excludes the "Computer and information systems manager" category. The following graph and table show the results for that definition.
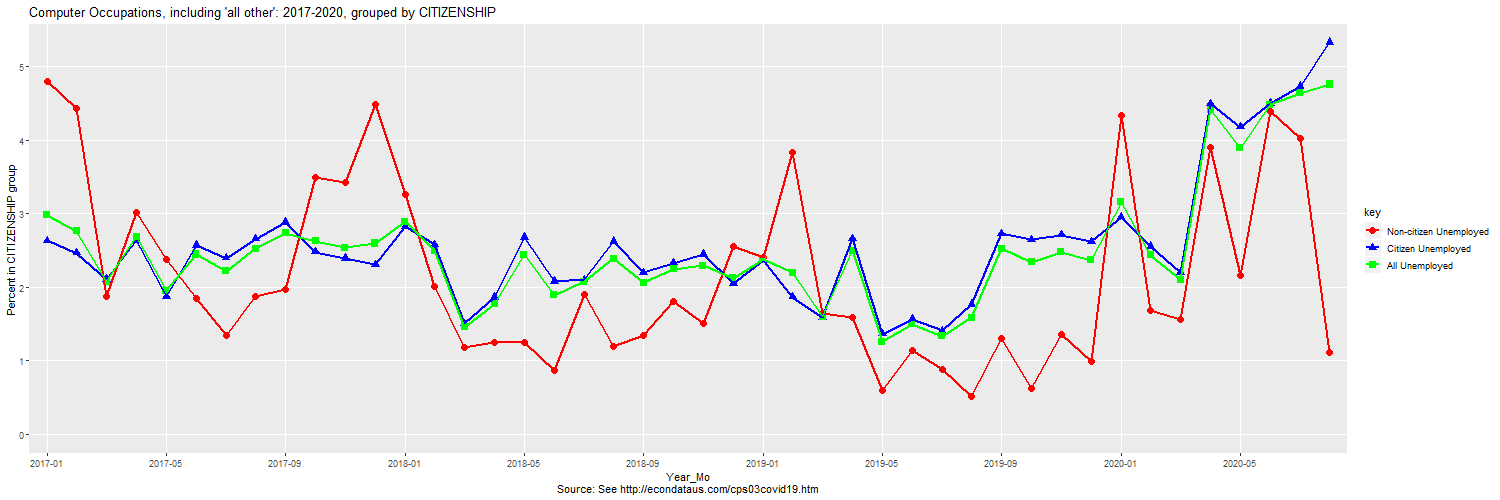
Computer Occupations, including 'all other': 2017-2020, grouped by CITIZENSHIP

   year_mo labor_force non_rate cit_rate all_rate non_count cit_count all_count
1  2017-01   4,685,816      4.8      2.6      3.0    35,608   103,944   139,552
2  2017-02   4,631,068      4.4      2.5      2.8    31,264    96,769   128,032
3  2017-03   4,498,666      1.9      2.1      2.1    12,341    80,915    93,256
4  2017-04   4,634,233      3.0      2.6      2.7    19,728   104,781   124,508
5  2017-05   4,498,814      2.4      1.9      2.0    16,358    71,373    87,731
6  2017-06   4,598,185      1.8      2.6      2.4    14,447    98,025   112,472
7  2017-07   4,512,675      1.3      2.4      2.2    10,290    89,706    99,996
8  2017-08   4,623,816      1.9      2.7      2.5    14,694   101,987   116,681
9  2017-09   4,716,498      2.0      2.9      2.7    15,191   113,710   128,901
10 2017-10   4,672,188      3.5      2.5      2.6    23,943    98,765   122,708
11 2017-11   4,917,446      3.4      2.4      2.5    23,590   101,252   124,842
12 2017-12   4,909,810      4.5      2.3      2.6    29,454    97,973   127,427
13 2018-01   5,091,390      3.3      2.8      2.9    23,571   123,616   147,187
14 2018-02   5,123,750      2.0      2.6      2.5    15,408   112,427   127,835
15 2018-03   5,049,461      1.2      1.5      1.5     9,243    64,204    73,447
16 2018-04   4,897,968      1.3      1.9      1.8     9,279    77,374    86,653
17 2018-05   4,944,899      1.3      2.7      2.4    10,227   110,594   120,821
18 2018-06   4,795,027      0.9      2.1      1.9     6,414    84,368    90,782
19 2018-07   4,891,323      1.9      2.1      2.1    14,578    86,841   101,420
20 2018-08   4,997,171      1.2      2.6      2.4    10,035   109,150   119,185
21 2018-09   4,866,778      1.3      2.2      2.1    10,777    89,525   100,303
22 2018-10   4,995,703      1.8      2.3      2.2    14,803    97,273   112,077
23 2018-11   5,055,289      1.5      2.4      2.3    12,677   103,087   115,764
24 2018-12   5,029,231      2.6      2.0      2.1    20,028    86,884   106,913
25 2019-01   4,947,938      2.4      2.4      2.4    19,223    98,116   117,339
26 2019-02   5,157,313      3.8      1.9      2.2    33,523    79,948   113,471
27 2019-03   4,965,726      1.6      1.6      1.6    13,177    66,263    79,440
28 2019-04   4,955,578      1.6      2.7      2.5    11,893   111,920   123,813
29 2019-05   5,061,264      0.6      1.4      1.3     4,205    59,402    63,607
30 2019-06   5,209,893      1.1      1.6      1.5     9,049    69,116    78,165
31 2019-07   5,386,494      0.9      1.4      1.3     6,843    64,925    71,768
32 2019-08   5,439,314      0.5      1.8      1.6     4,024    82,135    86,160
33 2019-09   5,279,188      1.3      2.7      2.5     9,879   123,347   133,225
34 2019-10   5,153,748      0.6      2.6      2.3     4,976   115,596   120,573
35 2019-11   5,142,270      1.4      2.7      2.5    11,913   115,492   127,405
36 2019-12   5,147,469      1.0      2.6      2.4     7,918   113,941   121,859
37 2020-01   5,476,662      4.3      3.0      3.2    35,387   137,614   173,001
38 2020-02   5,450,395      1.7      2.6      2.4    13,098   119,534   132,633
39 2020-03   5,421,957      1.6      2.2      2.1    12,903   101,111   114,014
40 2020-04   5,644,330      3.9      4.5      4.4    30,676   218,265   248,940
41 2020-05   5,682,895      2.2      4.2      3.9    17,633   203,287   220,920
42 2020-06   5,892,368      4.4      4.5      4.5    38,611   225,547   264,158
43 2020-07   5,807,555      4.0      4.7      4.6    29,463   239,978   269,441
44 2020-08   5,465,255      1.1      5.3      4.8     8,277   251,624   259,901
As can be seen, this better definition shows an even higher unemployment rate of 4.8 percent for August for all workers in computer occupations and 5.3 percent for those who are U.S. citizens. Both definitions now show the unemployment rate of U.S. workers in computer occupations to be at their highest level since at least January of 2017. As before, it will be interesting to see if Stuart Anderson releases an update of his numbers and admit that the numbers now show that the unemployment rate of computer occupations is very much increasing, not decreasing as he stated in his prior editorials. Judging from the past several months since May, he will just continue to focus on other topics.
Note: The above two graphs and tables can be reproduced with the program in this section by changing line 40 from "maxmnth <- 5" to "maxmnth <- 8". In addition, the first graph and table are generated by uncommenting just the occt assignment on line 49, occt <- "Computer Occupations with managers (NFAP)". The second graph and table are generated by uncommenting just the occt assignment on line 45, occt <- "Computer Occupations, including 'all other'" and increasing ymax to 5.3 in order to display the new high level of unemployment.
On October 13, 2020, Forbes Magazine posted an article by Stuart Anderson titled Tech Employment Data Contradict Need For Quick H-1B Visa Rules. As the title suggests, it is in response to new H-1B visa restrictions put out by the Trump administration. It begins:
New government data show the low unemployment rate in computer occupations contradicts Trump administration claims an economic emergency requires the quick implementation of new H-1B visa rules. A new analysis indicates the government's own data do not support the claims made in the regulations, which makes it more likely federal courts will block the new rules.
Further on, it states:
"The U.S. unemployment rate for individuals in computer occupations stood at 3.5% in September 2020, not changed significantly from the 3% unemployment rate in January 2020 (before the pandemic spread in the U.S.)," according to an analysis of the Bureau of Labor Statistics' Current Population Survey by the National Foundation for American Policy (NFAP). "A similar measure of the U.S. unemployment rate in computer and mathematical occupations, which appears on the BLS website, also found a rate of 3% in January 2020 and 3.5% in September 2020. The rates are well below the unemployment rate of 7.8% for non-computer occupations."
On October 12, 2020, the Basic Monthly CPS data for September became available on the Census website. The following graph and table shows the updated results using Stuart Anderson's questionable definition of computer occupations.
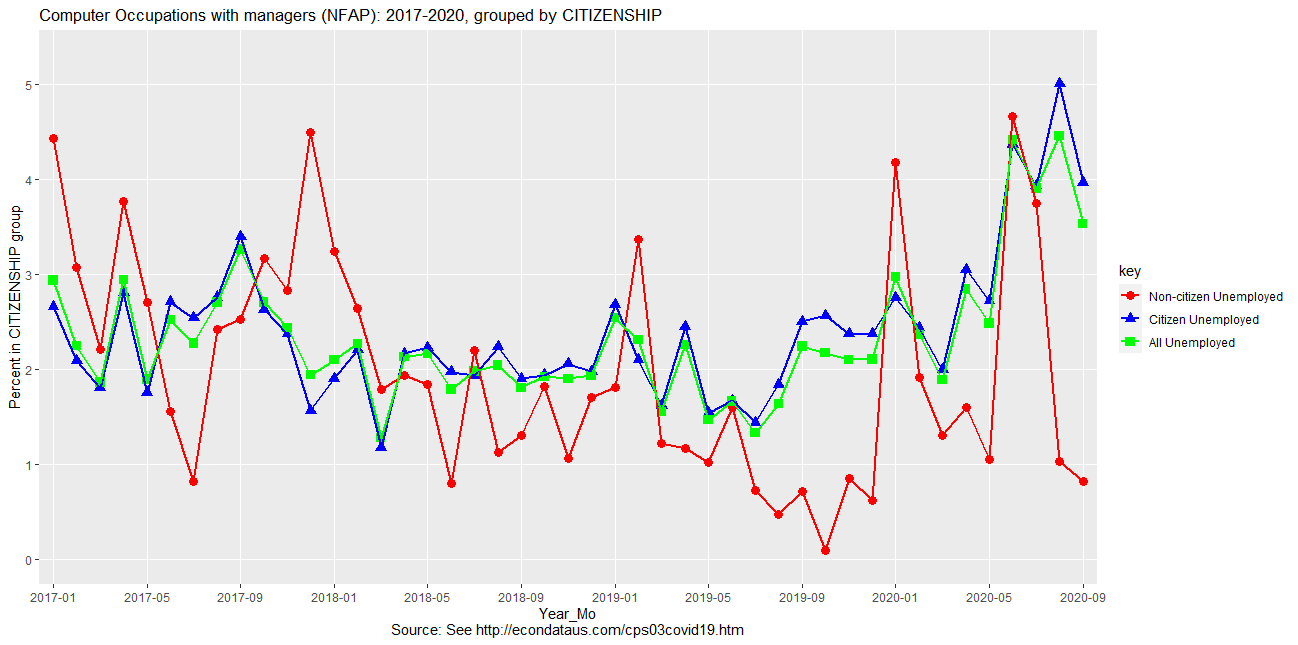
Computer Occupations with managers (NFAP): 2017-2020, grouped by CITIZENSHIP

   year_mo labor_force non_rate cit_rate all_rate non_count cit_count all_count
1  2017-01   5,083,329      4.4      2.7      2.9    35,608   113,686   149,294
2  2017-02   5,007,023      3.1      2.1      2.2    24,350    88,110   112,460
3  2017-03   4,921,265      2.2      1.8      1.9    16,225    75,456    91,681
4  2017-04   4,983,520      3.8      2.8      2.9    27,594   119,085   146,679
5  2017-05   4,887,519      2.7      1.7      1.9    19,922    72,621    92,543
6  2017-06   4,871,279      1.6      2.7      2.5    12,476   110,183   122,659
7  2017-07   4,777,019      0.8      2.5      2.3     6,121   102,340   108,461
8  2017-08   4,887,736      2.4      2.8      2.7    19,337   112,815   132,153
9  2017-09   4,941,581      2.5      3.4      3.3    19,055   142,162   161,217
10 2017-10   4,973,484      3.2      2.6      2.7    21,667   112,810   134,477
11 2017-11   5,097,665      2.8      2.4      2.4    20,012   104,162   124,173
12 2017-12   5,168,565      4.5      1.6      1.9    29,454    70,786   100,240
13 2018-01   5,204,071      3.2      1.9      2.1    24,481    84,624   109,104
14 2018-02   5,386,050      2.6      2.2      2.3    21,772   100,409   122,182
15 2018-03   5,341,738      1.8      1.2      1.3    15,174    52,967    68,141
16 2018-04   5,187,960      1.9      2.2      2.1    15,372    95,131   110,503
17 2018-05   5,241,516      1.8      2.2      2.2    15,664    97,719   113,383
18 2018-06   5,144,426      0.8      2.0      1.8     6,414    85,569    91,983
19 2018-07   5,142,346      2.2      1.9      2.0    18,644    83,032   101,676
20 2018-08   5,156,508      1.1      2.2      2.0    10,035    95,221   105,256
21 2018-09   5,004,165      1.3      1.9      1.8    10,777    79,570    90,347
22 2018-10   5,169,572      1.8      1.9      1.9    14,532    84,735    99,267
23 2018-11   5,186,986      1.1      2.1      1.9     8,745    89,765    98,510
24 2018-12   5,234,781      1.7      2.0      1.9    14,178    86,988   101,166
25 2019-01   5,154,654      1.8      2.7      2.5    15,205   115,648   130,854
26 2019-02   5,429,520      3.4      2.1      2.3    30,370    94,890   125,260
27 2019-03   5,271,519      1.2      1.6      1.6    10,295    71,602    81,897
28 2019-04   5,221,387      1.2      2.4      2.3     9,135   108,711   117,846
29 2019-05   5,413,793      1.0      1.5      1.5     7,897    71,472    79,369
30 2019-06   5,406,565      1.6      1.7      1.7    13,725    76,018    89,743
31 2019-07   5,533,182      0.7      1.4      1.3     6,052    67,442    73,495
32 2019-08   5,630,362      0.5      1.8      1.6     4,024    87,974    91,998
33 2019-09   5,410,845      0.7      2.5      2.2     5,701   115,425   121,126
34 2019-10   5,311,873      0.1      2.6      2.2       828   114,536   115,363
35 2019-11   5,301,418      0.8      2.4      2.1     7,978   103,430   111,408
36 2019-12   5,269,303      0.6      2.4      2.1     5,037   105,728   110,765
37 2020-01   5,540,113      4.2      2.8      3.0    35,387   129,266   164,653
38 2020-02   5,602,755      1.9      2.4      2.4    14,942   117,460   132,402
39 2020-03   5,794,298      1.3      2.0      1.9    11,458    97,810   109,268
40 2020-04   5,955,976      1.6      3.1      2.8    13,588   155,760   169,348
41 2020-05   6,030,322      1.0      2.7      2.5     8,921   140,820   149,741
42 2020-06   6,310,136      4.7      4.4      4.4    44,361   234,111   278,472
43 2020-07   6,044,541      3.7      3.9      3.9    29,628   206,333   235,961
44 2020-08   5,875,240      1.0      5.0      4.5     8,277   253,568   261,845
45 2020-09   5,367,953      0.8      4.0      3.5     6,063   183,429   189,492
As can be seen, Anderson's questionable definition shows the unemployment rate of computer occupations rose from 3.0 percent in January to 3.5 percent in September, a rise of just 0.5 percent as mentioned in the Forbes article. Looking just at computer occupations held by U.S. citizens, however, the unemployment rate rose from 2.8 percent in January to 4.0 percent in September, a much larger rise of 1.2 percent. Hence, the 0.5 percent rise in total unemployment since January is composed of a 1.2 percent rise in the unemployment of U.S. citizens and 3.4 percent drop in unemployment of non-citizens. It is the unemployment of U.S. citizens that is the concern of the new H-1B visa restrictions so the 1.2 percent rise in their unemployment is the concern. Also, the unemployment rate does not necessarily tell the entire story. Now that the pandemic has continued for over 6 months, it is possible that the unemployment benefits of some U.S. citizens in computer occupations has run out. They may have been forced to take lower paying jobs in other industries to maintain an income. This problem with looking at the unemployment rate of a specific industry is discussed in red font in the Summary section below. That section also describes how an arguably better definition of computer occupations includes the "Computer Occupations, all other" category and excludes the "Computer and information systems manager" category. The following graph and table show the results for that definition.
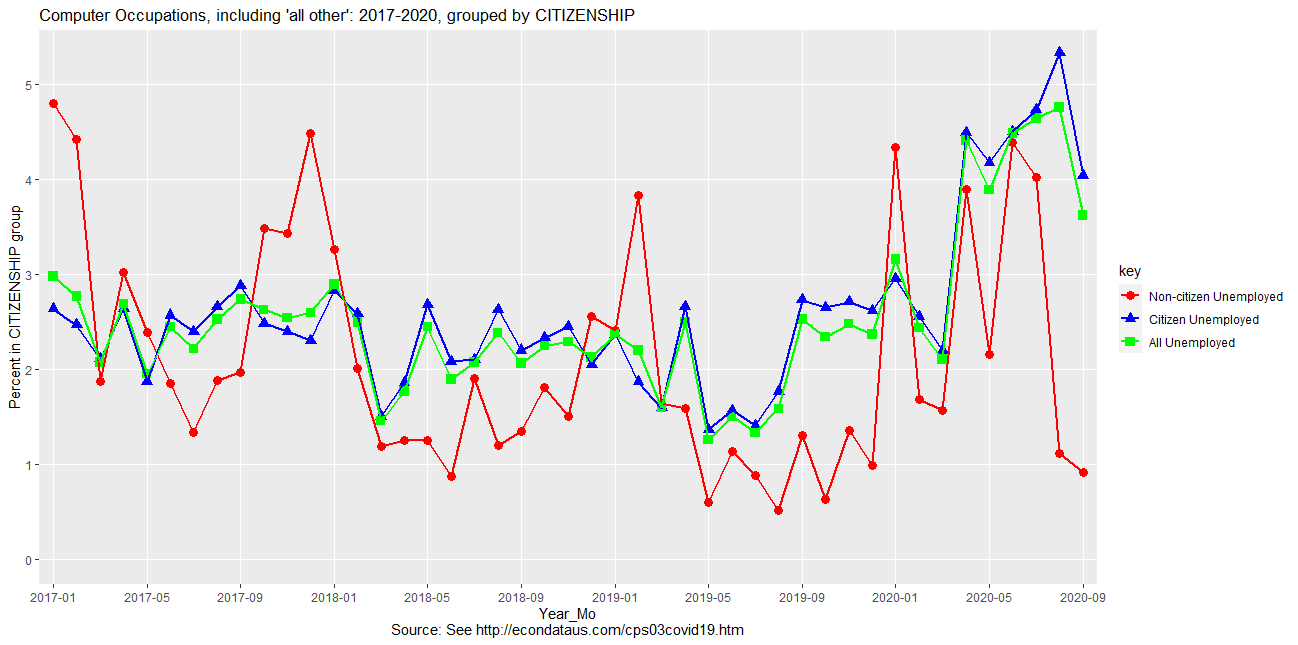
Computer Occupations, including 'all other': 2017-2020, grouped by CITIZENSHIP

   year_mo labor_force non_rate cit_rate all_rate non_count cit_count all_count
1  2017-01   4,685,816      4.8      2.6      3.0    35,608   103,944   139,552
2  2017-02   4,631,068      4.4      2.5      2.8    31,264    96,769   128,032
3  2017-03   4,498,666      1.9      2.1      2.1    12,341    80,915    93,256
4  2017-04   4,634,233      3.0      2.6      2.7    19,728   104,781   124,508
5  2017-05   4,498,814      2.4      1.9      2.0    16,358    71,373    87,731
6  2017-06   4,598,185      1.8      2.6      2.4    14,447    98,025   112,472
7  2017-07   4,512,675      1.3      2.4      2.2    10,290    89,706    99,996
8  2017-08   4,623,816      1.9      2.7      2.5    14,694   101,987   116,681
9  2017-09   4,716,498      2.0      2.9      2.7    15,191   113,710   128,901
10 2017-10   4,672,188      3.5      2.5      2.6    23,943    98,765   122,708
11 2017-11   4,917,446      3.4      2.4      2.5    23,590   101,252   124,842
12 2017-12   4,909,810      4.5      2.3      2.6    29,454    97,973   127,427
13 2018-01   5,091,390      3.3      2.8      2.9    23,571   123,616   147,187
14 2018-02   5,123,750      2.0      2.6      2.5    15,408   112,427   127,835
15 2018-03   5,049,461      1.2      1.5      1.5     9,243    64,204    73,447
16 2018-04   4,897,968      1.3      1.9      1.8     9,279    77,374    86,653
17 2018-05   4,944,899      1.3      2.7      2.4    10,227   110,594   120,821
18 2018-06   4,795,027      0.9      2.1      1.9     6,414    84,368    90,782
19 2018-07   4,891,323      1.9      2.1      2.1    14,578    86,841   101,420
20 2018-08   4,997,171      1.2      2.6      2.4    10,035   109,150   119,185
21 2018-09   4,866,778      1.3      2.2      2.1    10,777    89,525   100,303
22 2018-10   4,995,703      1.8      2.3      2.2    14,803    97,273   112,077
23 2018-11   5,055,289      1.5      2.4      2.3    12,677   103,087   115,764
24 2018-12   5,029,231      2.6      2.0      2.1    20,028    86,884   106,913
25 2019-01   4,947,938      2.4      2.4      2.4    19,223    98,116   117,339
26 2019-02   5,157,313      3.8      1.9      2.2    33,523    79,948   113,471
27 2019-03   4,965,726      1.6      1.6      1.6    13,177    66,263    79,440
28 2019-04   4,955,578      1.6      2.7      2.5    11,893   111,920   123,813
29 2019-05   5,061,264      0.6      1.4      1.3     4,205    59,402    63,607
30 2019-06   5,209,893      1.1      1.6      1.5     9,049    69,116    78,165
31 2019-07   5,386,494      0.9      1.4      1.3     6,843    64,925    71,768
32 2019-08   5,439,314      0.5      1.8      1.6     4,024    82,135    86,160
33 2019-09   5,279,188      1.3      2.7      2.5     9,879   123,347   133,225
34 2019-10   5,153,748      0.6      2.6      2.3     4,976   115,596   120,573
35 2019-11   5,142,270      1.4      2.7      2.5    11,913   115,492   127,405
36 2019-12   5,147,469      1.0      2.6      2.4     7,918   113,941   121,859
37 2020-01   5,476,662      4.3      3.0      3.2    35,387   137,614   173,001
38 2020-02   5,450,395      1.7      2.6      2.4    13,098   119,534   132,633
39 2020-03   5,421,957      1.6      2.2      2.1    12,903   101,111   114,014
40 2020-04   5,644,330      3.9      4.5      4.4    30,676   218,265   248,940
41 2020-05   5,682,895      2.2      4.2      3.9    17,633   203,287   220,920
42 2020-06   5,892,368      4.4      4.5      4.5    38,611   225,547   264,158
43 2020-07   5,807,555      4.0      4.7      4.6    29,463   239,978   269,441
44 2020-08   5,465,255      1.1      5.3      4.8     8,277   251,624   259,901
45 2020-09   5,022,122      0.9      4.0      3.6     6,063   175,728   181,792
As can be seen, this definition shows a slightly higher unemployment rate of 3.6 percent for September for all workers in computer occupations and the same 4.0 percent for those who are U.S. citizens. Also, both of the above graphs and tables show that unemployment of U.S. citizens in computer occupations is higher than any of the pre-pandemic period back through at least 2017. It would seem very much a mistake to interpret the last one-month downtick in unemployment to these still high levels to mean that all employment problems have been resolved.
Note: The above two graphs and tables can be reproduced with the program in this section by changing line 40 from "maxmnth <- 5" to "maxmnth <- 9". In addition, the first graph and table are generated by uncommenting just the occt assignment on line 49, occt <- "Computer Occupations with managers (NFAP)". The second graph and table are generated by uncommenting just the occt assignment on line 45, occt <- "Computer Occupations, including 'all other'" and increasing ymax to 5.3 in order to display the new high level of unemployment.
Stuart Anderson Continues to Focus on January of 2020
On November 19, 2020, Forbes Magazine posted an article by Stuart Anderson titled Low Computer Unemployment Rate Could Affect H-1B Visa Court Cases. It begins:
The latest data from the Bureau of Labor Statistics show the unemployment rate in computer occupations is back where it was before the start of the coronavirus pandemic. An earlier court ruling found the Trump administration's arguments lacking when it cited unemployment data to justify new restrictions on H-1B visas. The latest statistics will make it more difficult for the administration to justify emergency regulations published in October on H-1B visas.
Further on, it states:
"In a return to pre-pandemic levels, the unemployment rate for individuals in computer occupations was 3.0% in October 2020, identical to the 3.0% unemployment rate in January 2020 (before the pandemic spread in the U.S.)," according to an analysis of the Bureau of Labor Statistics' (BLS) Current Population Survey by the National Foundation for American Policy (NFAP). "In a broader category, computer and mathematical occupations, the unemployment rate declined from 3.0% in January to 2.8% in October 2020, according to BLS."
By November 15, 2020, the Basic Monthly CPS data for October became available on the Census website. The following graph and table shows the updated results using Stuart Anderson's questionable definition of computer occupations.
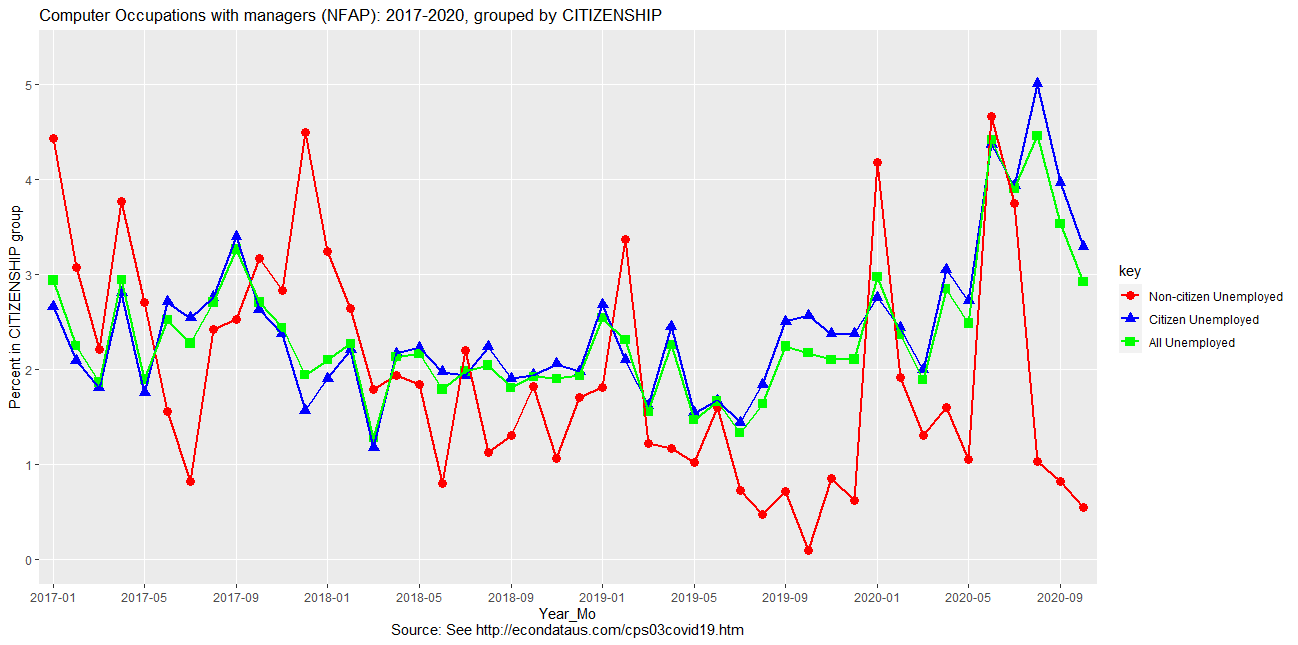
Computer Occupations with managers (NFAP): 2017-2020, grouped by CITIZENSHIP

   year_mo labor_force non_rate cit_rate all_rate non_count cit_count all_count
1  2017-01   5,083,329      4.4      2.7      2.9    35,608   113,686   149,294
2  2017-02   5,007,023      3.1      2.1      2.2    24,350    88,110   112,460
3  2017-03   4,921,265      2.2      1.8      1.9    16,225    75,456    91,681
4  2017-04   4,983,520      3.8      2.8      2.9    27,594   119,085   146,679
5  2017-05   4,887,519      2.7      1.7      1.9    19,922    72,621    92,543
6  2017-06   4,871,279      1.6      2.7      2.5    12,476   110,183   122,659
7  2017-07   4,777,019      0.8      2.5      2.3     6,121   102,340   108,461
8  2017-08   4,887,736      2.4      2.8      2.7    19,337   112,815   132,153
9  2017-09   4,941,581      2.5      3.4      3.3    19,055   142,162   161,217
10 2017-10   4,973,484      3.2      2.6      2.7    21,667   112,810   134,477
11 2017-11   5,097,665      2.8      2.4      2.4    20,012   104,162   124,173
12 2017-12   5,168,565      4.5      1.6      1.9    29,454    70,786   100,240
13 2018-01   5,204,071      3.2      1.9      2.1    24,481    84,624   109,104
14 2018-02   5,386,050      2.6      2.2      2.3    21,772   100,409   122,182
15 2018-03   5,341,738      1.8      1.2      1.3    15,174    52,967    68,141
16 2018-04   5,187,960      1.9      2.2      2.1    15,372    95,131   110,503
17 2018-05   5,241,516      1.8      2.2      2.2    15,664    97,719   113,383
18 2018-06   5,144,426      0.8      2.0      1.8     6,414    85,569    91,983
19 2018-07   5,142,346      2.2      1.9      2.0    18,644    83,032   101,676
20 2018-08   5,156,508      1.1      2.2      2.0    10,035    95,221   105,256
21 2018-09   5,004,165      1.3      1.9      1.8    10,777    79,570    90,347
22 2018-10   5,169,572      1.8      1.9      1.9    14,532    84,735    99,267
23 2018-11   5,186,986      1.1      2.1      1.9     8,745    89,765    98,510
24 2018-12   5,234,781      1.7      2.0      1.9    14,178    86,988   101,166
25 2019-01   5,154,654      1.8      2.7      2.5    15,205   115,648   130,854
26 2019-02   5,429,520      3.4      2.1      2.3    30,370    94,890   125,260
27 2019-03   5,271,519      1.2      1.6      1.6    10,295    71,602    81,897
28 2019-04   5,221,387      1.2      2.4      2.3     9,135   108,711   117,846
29 2019-05   5,413,793      1.0      1.5      1.5     7,897    71,472    79,369
30 2019-06   5,406,565      1.6      1.7      1.7    13,725    76,018    89,743
31 2019-07   5,533,182      0.7      1.4      1.3     6,052    67,442    73,495
32 2019-08   5,630,362      0.5      1.8      1.6     4,024    87,974    91,998
33 2019-09   5,410,845      0.7      2.5      2.2     5,701   115,425   121,126
34 2019-10   5,311,873      0.1      2.6      2.2       828   114,536   115,363
35 2019-11   5,301,418      0.8      2.4      2.1     7,978   103,430   111,408
36 2019-12   5,269,303      0.6      2.4      2.1     5,037   105,728   110,765
37 2020-01   5,540,113      4.2      2.8      3.0    35,387   129,266   164,653
38 2020-02   5,602,755      1.9      2.4      2.4    14,942   117,460   132,402
39 2020-03   5,794,298      1.3      2.0      1.9    11,458    97,810   109,268
40 2020-04   5,955,976      1.6      3.1      2.8    13,588   155,760   169,348
41 2020-05   6,030,322      1.0      2.7      2.5     8,921   140,820   149,741
42 2020-06   6,310,136      4.7      4.4      4.4    44,361   234,111   278,472
43 2020-07   6,044,541      3.7      3.9      3.9    29,628   206,333   235,961
44 2020-08   5,875,240      1.0      5.0      4.5     8,277   253,568   261,845
45 2020-09   5,367,953      0.8      4.0      3.5     6,063   183,429   189,492
46 2020-10   5,407,741      0.5      3.3      2.9     3,997   153,871   157,867
As can be seen, Anderson's questionable definition shows that the unemployment rate of computer occupations was at about the same 3.0 percent in January and October (actually 2.9 percent in October) as mentioned in the Forbes article. Looking just at computer occupations held by U.S. citizens, however, the unemployment rate rose from 2.8 percent in January to 3.3 percent in October, a rise of half of a percent. Also, the data shows that January experienced a local peak in unemployment. The unemployment rate for computer occupations held by U.S. citizens was 2.8 percent in January but 2.4 percent in the previous and following months. Hence, it would appear that Stuart is engaging in a little bit of cherry-picking to make his argument look better. This likely also explains why he did not write any analyses of the unemployment rate of computer occupations in June through August when it spiked at over 4 percent. It seems especially irresponsible to create a measure of unemployment that nobody else can likely calculate (though I made the effort to do so) and then not provide all of its values over time, allowing you to cherry-pick at will to strengthen your arguments.
In any event, the table above shows some other interesting facts. The number of unemployed U.S. citizens who worked in computer occupations reached a local high of 129,266 in January, dropped to a low of 97,810 in March and is now at 153,871. It's current level is still higher than any pre-pandemic level, at least back to January of 2017. This helps to make the point that the unemployment rate is an imperfect measure. A couple of ways in which it is imperfect are described in the following excerpt about a description of Weaknesses of Unemployment Statistics:
The unemployment data have a number of problems that lead to an understatement of unemployment. For example, the data count as employed all people who are working part time but who would like to work full time. Since these people represent unused labor effort that is available, the unemployment rate understates the extent of unemployed resources in the economy. Another problem that causes the unemployment rate to understate the extent of unemployed resources is the "discouraged-worker" effect. If someone wants to work, but becomes so convinced that there are no jobs available that he makes no effort to find work, he will be counted as "not in the labor force." Since there will be more discouraged workers the more severe the recession, this factor will tend to dampen the fluctuations in the unemployment rate.
The phenomena of the "discouraged worker" would also seem to apply to workers who attempt to find a job in the computer industry and finally become discouraged and take a job in another industry. This is described in the red text in the Summary below.
Note: The above graph and table can be reproduced with the program in this section by changing line 40 from "maxmnth <- 5" to "maxmnth <- 10". In addition, the graph and table are generated by uncommenting just the occt assignment on line 49, occt <- "Computer Occupations with managers (NFAP)".
Summary of Stuart Anderson's Errors about the Unemployment Rate for Computer Occupations
Stuart Anderson has made the following three major errors in his May 18th and June 11th editorials in Forbes:
Finally, both editorials make a major point of comparing the unemployment rates of computer occupations to the much higher unemployment rates of all other occupations. This is a serious mistake. Suppose that U.S. employers are discriminating against U.S. workers due to race, gender, and/or age or because they perceive those workers to be more independent and/or higher paid. What will those workers do? If they need income to survive, younger workers will likely accept jobs in other, lower-paid fields while continuing to look for computer work. Older workers may essentially give up and move to another field or retire. Both the younger and older workers will disappear from the unemployment roles. A worker who is unemployed from ALL occupations is a very different matter. They will show up in the overall unemployment rate and in the unemployment rate of whichever occupation they identify as their current one. Hence, it's very much a mistake to treat the unemployment rate of a specific occupation the same as the overall unemployment rate. It may be useful in measuring an economic shock to an occupation that causes sudden, temporary unemployment. But it likely will not be able to detect if there is systemic bias against classes of workers and that those workers are driven out of the field.
You can reproduce any of the above numbers via the R program at this link. That program uses publicly available data on the Census website.