The following graphs were created with a version of the applications described at this link. I described, the data comes originally from the American Community Survey (ACS) and is extracted from IPUMS USA.
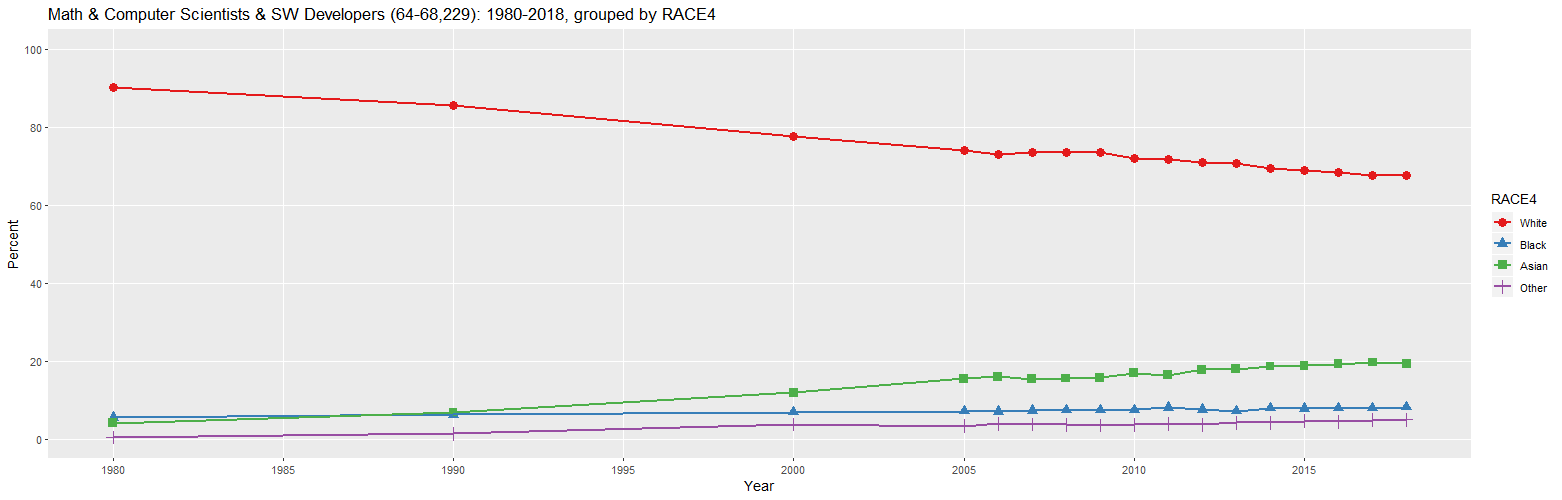
Math & Computer Scientists & SW Developers (64-68,229): 1980-2018, grouped by RACE4 (percent)

   Year     Count White Black Asian Other
1  1980   636,640  90.1   5.4   4.0   0.4
2  1990 1,408,313  85.7   6.2   6.8   1.3
3  2000 3,199,495  77.5   6.8  11.9   3.8
4  2005 3,198,708  74.1   7.1  15.5   3.3
5  2006 3,318,303  73.1   7.0  16.0   3.9
6  2007 3,385,718  73.6   7.3  15.3   3.7
7  2008 3,523,679  73.4   7.4  15.5   3.7
8  2009 3,563,731  73.4   7.4  15.7   3.5
9  2010 3,518,876  72.0   7.5  16.9   3.7
10 2011 3,665,822  71.6   8.0  16.4   3.9
11 2012 3,803,465  71.0   7.5  17.8   3.7
12 2013 3,986,605  70.7   7.2  17.9   4.2
13 2014 4,232,114  69.4   7.8  18.6   4.2
14 2015 4,398,425  68.8   7.8  18.8   4.6
15 2016 4,643,295  68.4   7.9  19.3   4.4
16 2017 4,878,498  67.6   7.9  19.6   4.9
17 2018 5,189,315  67.6   8.2  19.3   5.0

URL parameters (short)=
?minyear=1980&maxyear=2018&STATE=&geo=NATION&occ=Math%20&%20Computer%20Scientists%20&%20SW%20Developers%20(64-68,229)&group=RACE4&sortn=4&color=Set1&geomtype=Line%20Graph
As can be seen in the table above, the percentage of Math & Computer Scientists and Software Developers in the U.S. who were black was 5.4 percent in 1980 and was 8.2 percent in 2018. However, blacks make up about 13.4 percent of the U.S. population. Then the percentage seems to have grown but is still less than their percentage of the population.
Percentage by Race - Computer software developers (229): 1980-2018
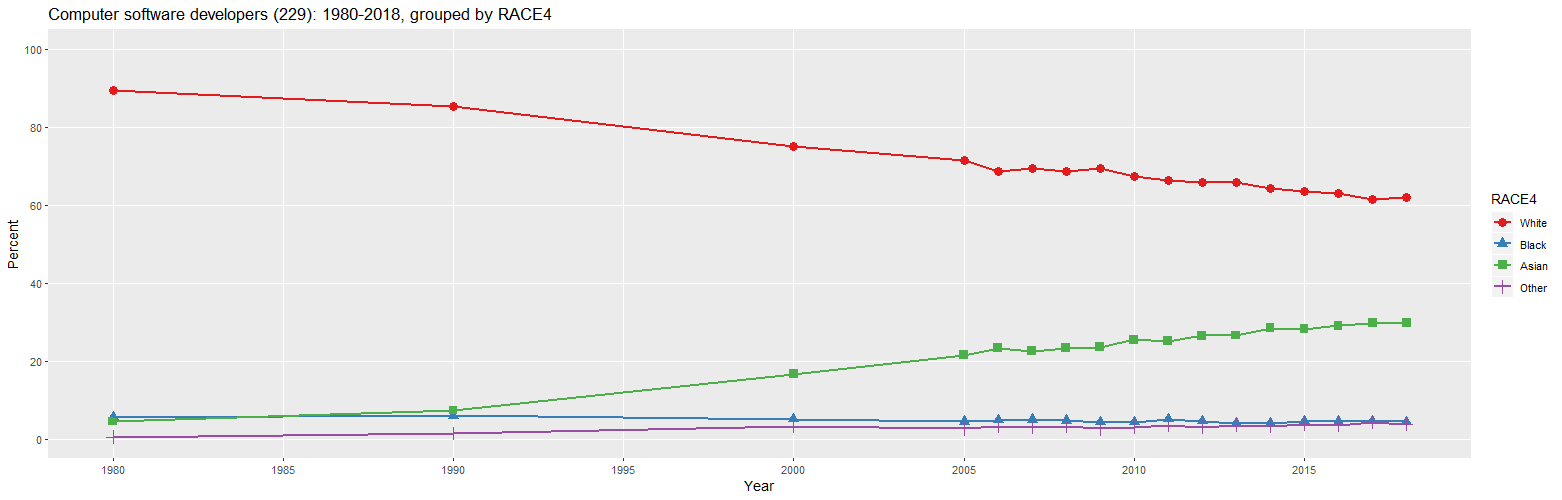
Computer software developers (229): 1980-2018, grouped by RACE4 (percent)

   Year     Count White Black Asian Other
1  1980   311,180  89.4   5.6   4.5   0.5
2  1990   644,172  85.3   5.9   7.3   1.4
3  2000 1,349,011  75.0   5.1  16.6   3.2
4  2005 1,279,997  71.4   4.4  21.5   2.6
5  2006 1,315,056  68.6   4.9  23.3   3.2
6  2007 1,290,484  69.5   5.0  22.5   3.1
7  2008 1,332,875  68.7   4.7  23.3   3.3
8  2009 1,325,989  69.5   4.3  23.6   2.6
9  2010 1,315,823  67.3   4.3  25.4   3.0
10 2011 1,343,537  66.4   5.0  25.1   3.5
11 2012 1,449,897  65.9   4.5  26.5   3.1
12 2013 1,480,496  65.8   4.1  26.6   3.6
13 2014 1,546,979  64.2   4.1  28.4   3.3
14 2015 1,630,473  63.5   4.6  28.2   3.7
15 2016 1,710,581  62.9   4.5  29.0   3.5
16 2017 1,803,306  61.4   4.6  29.7   4.4
17 2018 1,853,801  62.0   4.4  29.8   3.9

URL parameters (short)=
?minyear=1980&maxyear=2018&STATE=&geo=NATION&occ=Computer%20software%20developers%20(229)&group=RACE4&sortn=4&color=Set1&geomtype=Line%20Graph
As can be seen in the table above, the percentage of Software Developers in the U.S. who were black was 5.6 percent in 1980 and was only 4.4 percent in 2018. In fact, about two-thirds of the H-1B visas issued in 2018 were for computer-related occupations and a large percentage of these were for software developer jobs. Hence, it would seem very possible that some of this drop may have been due to competition with H-1B visa workers.
Percentage by Race - Computer software developers (229): 1980-2018, New Jersey
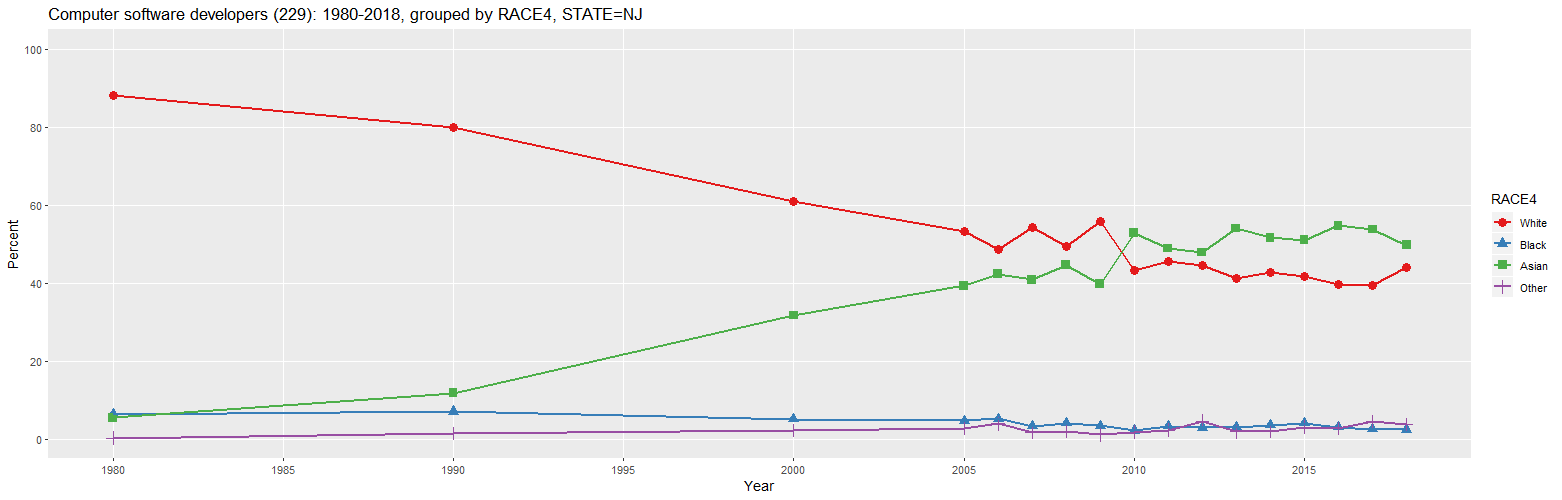
Computer software developers (229): 1980-2018, grouped by RACE4, STATE=NJ (percent)

   Year  Count White Black Asian Other
1  1980 15,520  88.0   6.3   5.4   0.3
2  1990 34,167  79.8   7.0  11.7   1.4
3  2000 68,260  61.0   5.1  31.7   2.2
4  2005 65,871  53.4   4.6  39.3   2.7
5  2006 60,366  48.7   5.2  42.3   3.9
6  2007 64,150  54.1   3.3  40.8   1.8
7  2008 67,423  49.3   4.1  44.6   2.0
8  2009 60,486  55.8   3.4  39.8   1.1
9  2010 59,849  43.2   2.2  52.8   1.8
10 2011 60,756  45.6   3.2  48.9   2.3
11 2012 61,755  44.6   2.9  47.8   4.6
12 2013 61,941  41.1   3.0  54.0   1.9
13 2014 66,562  42.7   3.6  51.6   2.1
14 2015 69,410  41.8   4.1  51.0   3.1
15 2016 71,402  39.5   3.1  54.7   2.7
16 2017 70,269  39.3   2.5  53.7   4.5
17 2018 78,855  44.1   2.4  49.8   3.8

URL parameters (short)=
?minyear=1980&maxyear=2018&STATE=NJ&geo=NATION&occ=Computer%20software%20developers%20(229)&group=RACE4&sortn=4
New Jersey is the state that receives the third largest number of H-1B visa workers annually (after California and Texas). In the table above, the black percentage of software developers in New Jersey reached a peak of 7.0 percent in 1990, the year that the H-1B visa program began. In 2018, it is just over one third of that at 2.4 percent. Again, it would seem very possible that much of this drop was due to competition with H-1B visa workers.
Percentage by Race - Computer software developers (229): 1980-2018, California
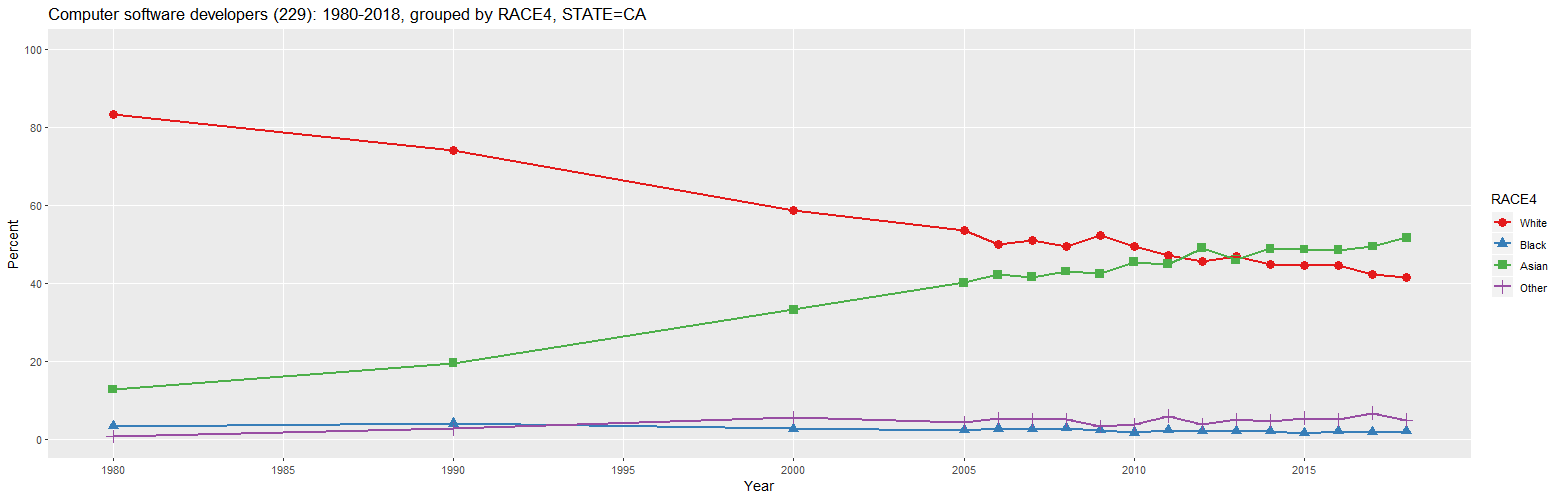
Computer software developers (229): 1980-2018, grouped by RACE4, STATE=CA (percent)

   Year   Count White Black Asian Other
1  1980  42,500  83.3   3.3  12.7   0.7
2  1990  89,177  74.0   3.9  19.5   2.6
3  2000 210,067  58.7   2.6  33.2   5.5
4  2005 188,705  53.6   2.2  40.0   4.2
5  2006 212,441  49.9   2.7  42.1   5.3
6  2007 210,177  51.0   2.5  41.5   5.0
7  2008 210,675  49.3   2.8  43.0   4.9
8  2009 216,884  52.1   2.2  42.4   3.3
9  2010 212,055  49.5   1.6  45.3   3.6
10 2011 222,821  47.0   2.3  44.9   5.8
11 2012 235,317  45.4   2.0  48.9   3.6
12 2013 248,460  46.9   2.0  46.0   5.1
13 2014 283,149  44.7   1.9  48.8   4.6
14 2015 302,577  44.6   1.4  48.6   5.4
15 2016 323,849  44.6   2.0  48.4   4.9
16 2017 340,950  42.3   1.7  49.4   6.6
17 2018 342,463  41.5   2.0  51.6   4.9

URL parameters (short)=
?minyear=1980&maxyear=2018&geo=NATION&occ=Computer%20software%20developers%20(229)&group=RACE4&sortn=5&mincount=5&color=Set1&geomtype=Line%20Graph
California is the state that receives the largest number of H-1B visa workers annually. In the table above, the black percentage of software developers in California reached a peak of 3.9 percent in 1990, the year that the H-1B visa program began. In 2018, it is nearly half of that at 2.0 percent. Once again, it would seem very possible that much of this drop was due to competition with H-1B visa workers.
Percentage by Race - Computer software developers (229): 1980-2018, Santa Clara County, California
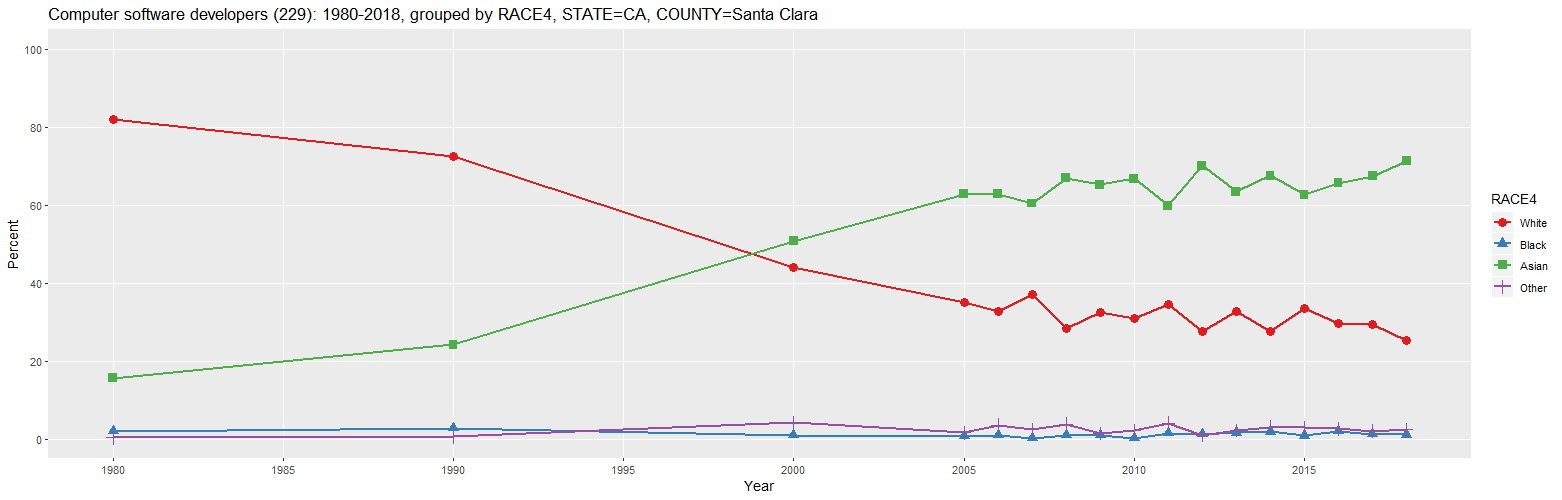
Computer software developers (229): 1980-2018, grouped by RACE4, STATE=CA, COUNTY=Santa Clara (percent)

   Year  Count White Black Asian Other
1  1980  6,900  82.0   2.0  15.7   0.3
2  1990 12,993  72.4   2.8  24.2   0.6
3  2000 47,667  44.0   1.0  50.7   4.3
4  2005 39,754  35.0   0.7  62.8   1.6
5  2006 52,282  32.7   0.9  62.8   3.6
6  2007 47,764  37.0   0.2  60.4   2.4
7  2008 52,573  28.3   1.0  66.9   3.8
8  2009 48,555  32.4   0.9  65.2   1.4
9  2010 52,260  30.9   0.2  66.8   2.2
10 2011 54,744  34.5   1.5  59.8   4.1
11 2012 58,637  27.7   1.2  70.1   1.0
12 2013 63,361  32.7   1.6  63.5   2.2
13 2014 74,352  27.5   1.9  67.5   3.0
14 2015 78,269  33.5   0.8  62.6   3.0
15 2016 85,011  29.7   2.0  65.6   2.6
16 2017 90,412  29.3   1.3  67.4   2.0
17 2018 88,430  25.3   1.1  71.3   2.4

URL parameters (short)=
?minyear=1980&maxyear=2018&COUNTY=Santa%20Clara&geo=NATION&occ=Computer%20software%20developers%20(229)&group=RACE4&sortn=4
Santa Clara County, California is at in the heart of Silicon Valley. In the table above, the black percentage of software developers in California reached a peak of 2.8 percent in 1990, the year that the H-1B visa program began. In 2018, it is far less than half of that at 1.1 percent. Being in Silicon Valley, Santa Clara County is very competitive and the additional competition from H-1B was likely a major factor in this drop.
Percentage by Race - Computer software developers (229): 1980-2018, Georgia
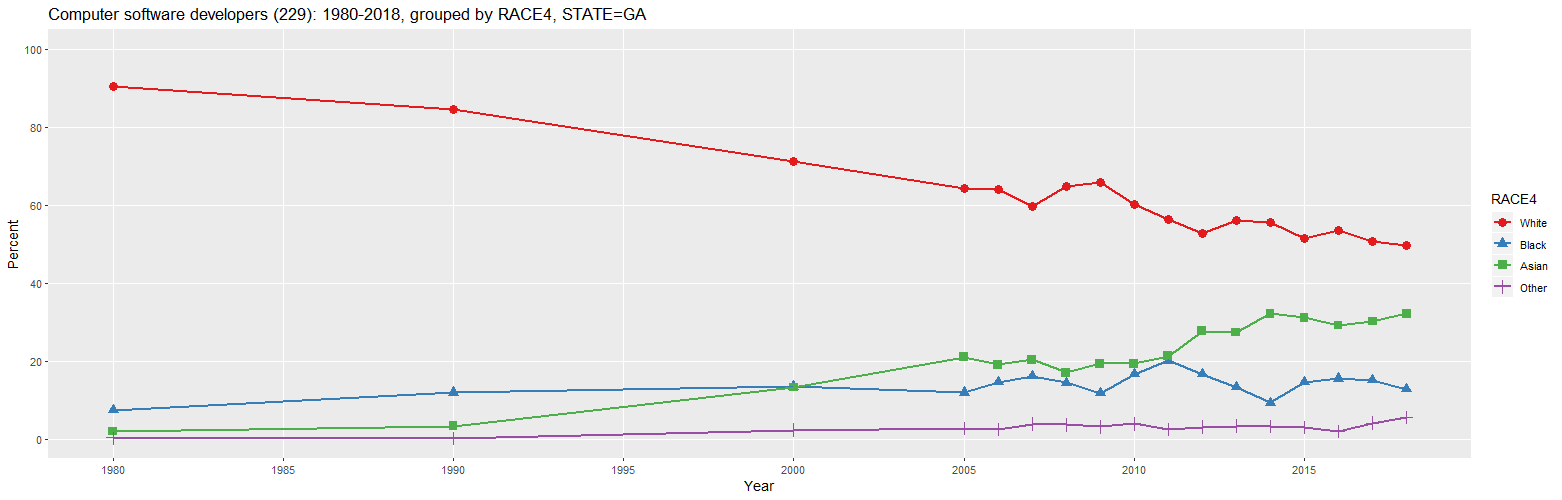
Computer software developers (229): 1980-2018, grouped by RACE4, STATE=GA (percent)

   Year  Count White Black Asian Other
1  1980  6,200  90.3   7.4   1.9   0.3
2  1990 15,745  84.6  11.9   3.3   0.2
3  2000 39,094  71.1  13.4  13.2   2.3
4  2005 38,756  64.4  11.9  21.0   2.7
5  2006 41,640  64.0  14.5  19.0   2.4
6  2007 37,289  59.7  16.1  20.4   3.9
7  2008 43,372  64.9  14.4  17.0   3.7
8  2009 35,672  65.8  11.7  19.3   3.1
9  2010 39,713  60.2  16.6  19.3   3.9
10 2011 35,209  56.2  20.1  21.2   2.4
11 2012 39,691  52.7  16.7  27.6   3.0
12 2013 41,123  56.2  13.2  27.3   3.3
13 2014 43,600  55.4   9.3  32.1   3.2
14 2015 44,944  51.4  14.5  31.1   3.0
15 2016 48,240  53.5  15.4  29.1   2.0
16 2017 51,081  50.8  15.0  30.2   4.1
17 2018 54,294  49.6  12.7  32.1   5.5

URL parameters (short)=
?minyear=1980&maxyear=2018&STATE=GA&geo=NATION&occ=Computer%20software%20developers%20(229)&group=RACE4&sortn=4&mincount=1&ymax=100&color=Set1&geomtype=Line%20Graph
Georgia has one of the larger percentages of software developers who are black. As can be seen in the graph and table above, that percentage reached a peak of 20.1 percent in 2011 but dropped to 12.7 percent by 2018. During the same period, the percentage of software developers who are Asian rose to an a high of 32.1 percent.
Percentage by Asian and Citizenship - Computer software developers (229): 1980-2018, Georgia
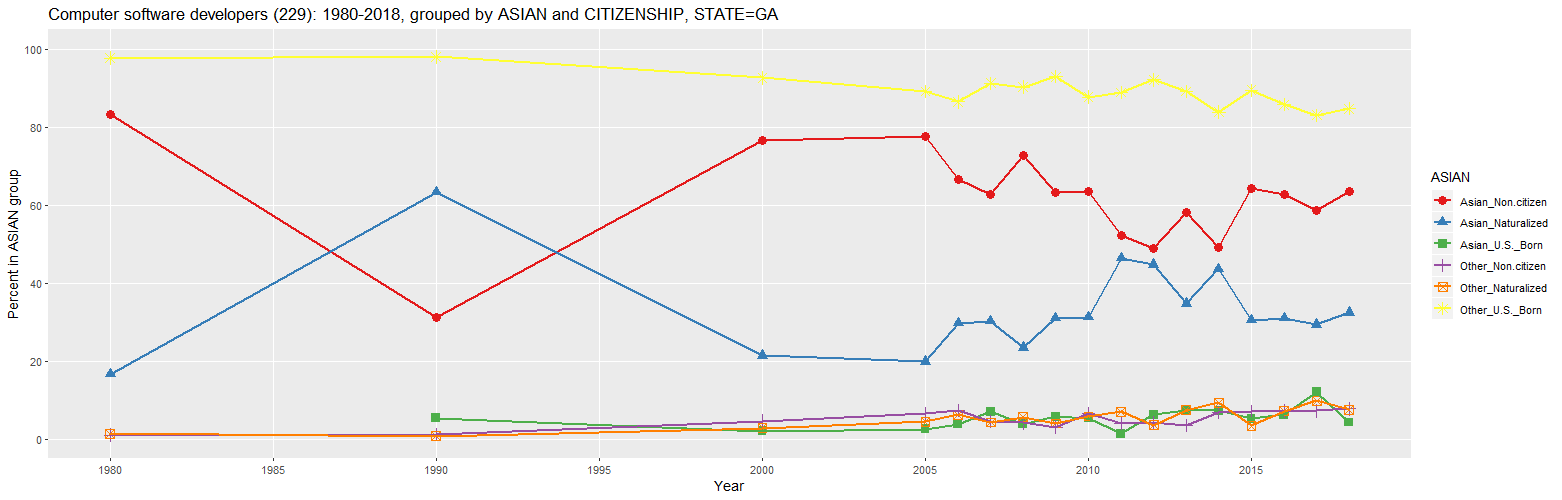
Computer software developers (229): 1980-2018, grouped by ASIAN and CITIZENSHIP, STATE=GA (percent in ASIAN group)

   Year  Count Asian_Non.citizen Asian_Naturalized Asian_U.S._Born Other_Non.citizen Other_Naturalized Other_U.S._Born
1  1980  6,200              83.3              16.7              NA               1.0               1.3            97.7
2  1990 15,745              31.3              63.4             5.3               1.2               0.8            98.0
3  2000 39,094              76.6              21.4             2.0               4.6               2.8            92.6
4  2005 38,756              77.6              19.9             2.6               6.5               4.4            89.1
5  2006 41,640              66.5              29.7             3.8               7.3               6.2            86.5
6  2007 37,289              62.8              30.2             7.0               4.5               4.3            91.2
7  2008 43,372              72.8              23.4             3.8               4.2               5.6            90.3
8  2009 35,672              63.3              31.0             5.7               3.0               4.0            93.0
9  2010 39,713              63.4              31.2             5.4               6.5               5.8            87.7
10 2011 35,209              52.3              46.4             1.3               4.1               7.0            88.9
11 2012 39,691              49.0              44.7             6.3               4.4               3.5            92.1
12 2013 41,123              58.0              34.7             7.3               3.5               7.4            89.2
13 2014 43,600              49.2              43.6             7.2               6.8               9.3            83.9
14 2015 44,944              64.4              30.5             5.2               7.1               3.4            89.5
15 2016 48,240              62.8              30.9             6.3               7.1               7.1            85.8
16 2017 51,081              58.7              29.3            12.0               7.2               9.8            83.0
17 2018 54,294              63.4              32.4             4.2               7.8               7.5            84.8

URL parameters (short)=
?minyear=1980&maxyear=2018&STATE=GA&units=Percent%20in%20group&geo=NATION&occ=Computer%20software%20developers%20(229)&group=ASIAN|CITIZENSHIP&sortn=4&ymax=100&color=Set1&geomtype=Line%20Graph
The above graph and table show that nearly two-thirds of the Asian software developers in Georgia in 2018 were non-immigrants. Only 4.2 percent were U.S. born. For all other software developers, 84.8 percent were U.S. born. The great majority of the non-citizen software developers are likely on H-1B or other non-citizen visas. Hence, these non-citizen visas likely did play a major role in the drop of the percentage of black software developers since 2011.
Unemployment Rate by Race - Math & Computer Scientists & SW Developers (64-68,229): 1980-2018
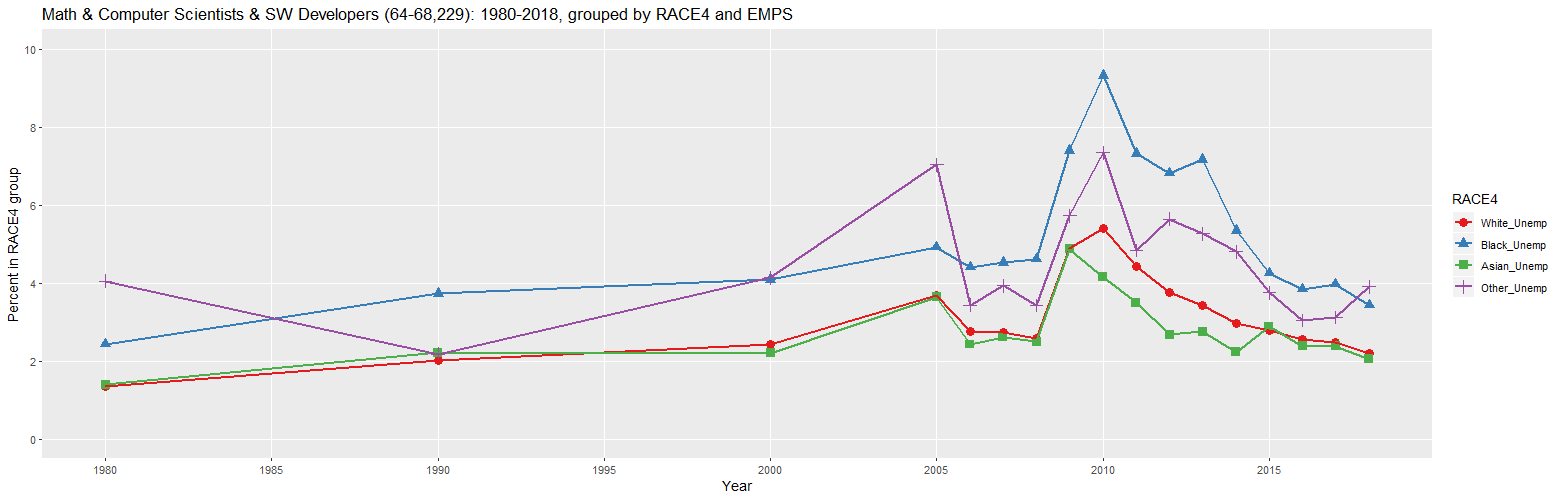
Math & Computer Scientists & SW Developers (64-68,229): 1980-2018, grouped by RACE4 and EMPS (percent in RACE4 group)

   Year     Count White_Unemp Black_Unemp Asian_Unemp Other_Unemp
1  1980   645,760         1.3         2.4         1.4         4.1
2  1990 1,439,100         2.0         3.7         2.2         2.2
3  2000 3,284,467         2.4         4.1         2.2         4.1
4  2005 3,328,058         3.7         4.9         3.6         7.0
5  2006 3,415,376         2.7         4.4         2.4         3.4
6  2007 3,486,477         2.7         4.5         2.6         3.9
7  2008 3,623,453         2.6         4.6         2.5         3.4
8  2009 3,755,117         4.9         7.4         4.9         5.7
9  2010 3,726,734         5.4         9.3         4.1         7.3
10 2011 3,840,068         4.4         7.3         3.5         4.8
11 2012 3,956,681         3.8         6.8         2.7         5.6
12 2013 4,138,319         3.4         7.2         2.8         5.3
13 2014 4,367,070         3.0         5.3         2.2         4.8
14 2015 4,532,543         2.8         4.2         2.9         3.7
15 2016 4,769,652         2.6         3.8         2.4         3.0
16 2017 5,008,906         2.5         4.0         2.4         3.1
17 2018 5,314,659         2.2         3.4         2.1         3.9

URL parameters (short)=
?minyear=1980&maxyear=2018&STATE=&units=Percent%20in%20group&geo=NATION&occ=Math%20&%20Computer%20Scientists%20&%20SW%20Developers%20(64-68,229)&empstat=In%20labor%20force&group=RACE4|EMPS&sortn=4&color=Set1&geomtype=Line%20Graph
As can be seen in the graph above, the unemployment rate for blacks working in math and computers has generally been greater than the unemployment rate of whites and Asians since at least 2000. The white and Asian unemployment rate has been very similar since at least 1980. White unemployment grew to be about a percent greater than the Asian unemployment rate in 2010 but the two rates came back together in 2015 and have been very similar since then.
Unemployment Rate by Race - Computer software developers (229): 1980-2018
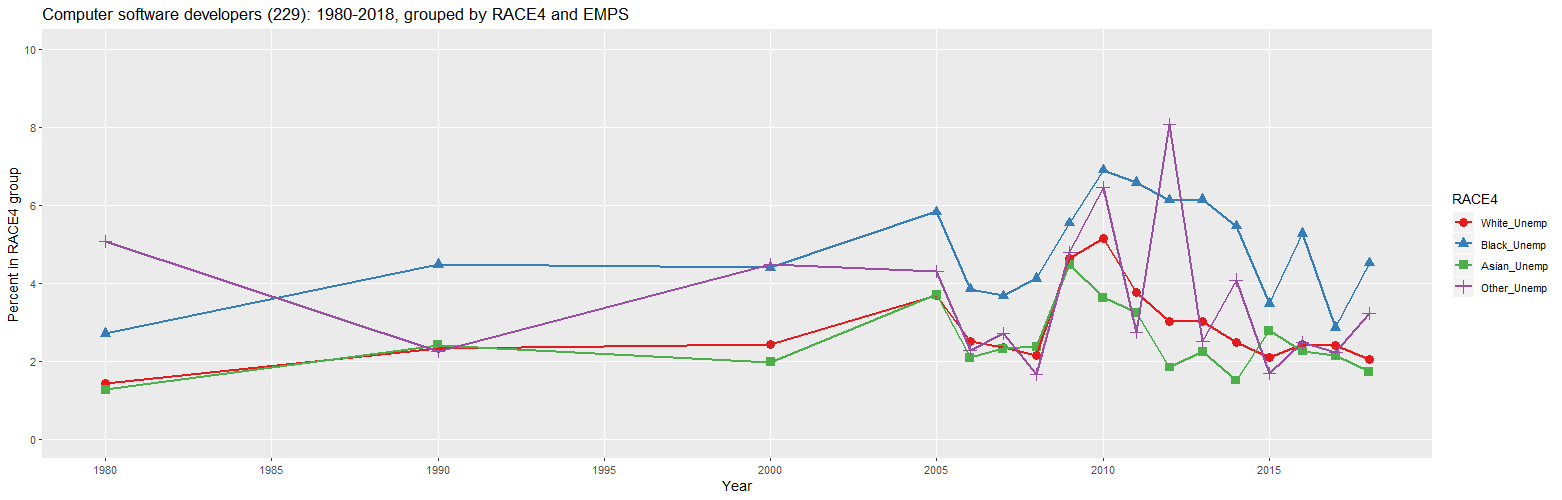
Computer software developers (229): 1980-2018, grouped by RACE4 and EMPS (percent in RACE4 group)

   Year     Count White_Unemp Black_Unemp Asian_Unemp Other_Unemp
1  1980   315,940         1.4         2.7         1.3         5.1
2  1990   660,442         2.3         4.5         2.4         2.3
3  2000 1,383,801         2.4         4.4         2.0         4.5
4  2005 1,330,438         3.7         5.8         3.7         4.3
5  2006 1,348,216         2.5         3.8         2.1         2.3
6  2007 1,322,547         2.4         3.7         2.3         2.7
7  2008 1,363,846         2.1         4.1         2.4         1.7
8  2009 1,390,352         4.6         5.5         4.5         4.8
9  2010 1,383,362         5.1         6.9         3.6         6.4
10 2011 1,395,749         3.8         6.6         3.2         2.7
11 2012 1,495,096         3.0         6.1         1.8         8.1
12 2013 1,525,094         3.0         6.1         2.2         2.5
13 2014 1,584,722         2.5         5.5         1.5         4.1
14 2015 1,669,550         2.1         3.5         2.8         1.7
15 2016 1,754,574         2.4         5.3         2.2         2.5
16 2017 1,846,508         2.4         2.9         2.1         2.2
17 2018 1,893,576         2.0         4.5         1.7         3.2

URL parameters (short)=
?minyear=1980&maxyear=2018&STATE=&units=Percent%20in%20group&geo=NATION&occ=Computer%20software%20developers%20(229)&empstat=In%20labor%20force&group=RACE4|EMPS&sortn=4&color=Set1&geomtype=Line%20Graph
Once again, the graph above shows that the unemployment rate for blacks working as software developers has generally been greater than the unemployment rate of whites and Asians since at least 2000. The white and Asian unemployment rate has been very similar since at least 1980. As before, white unemployment grew to be about a percent greater than the Asian unemployment rate in 2010 but the two rates came back together in 2015 and have been very similar since then.
State Percentage by Race - Math & Computer Scientists & SW Developers (64-68,229): 2018

Math & Computer Scientists & SW Developers (64-68,229): 2018, grouped by RACE4 (percent)

   Year STATE   Count White Black Asian Other
1  2018    MD 175,229  55.1  26.5  13.8   4.6
2  2018    DC  26,404  59.5  25.6   7.7   7.2
3  2018    GA 175,102  51.9  24.4  18.9   4.7
4  2018    MS  16,353  75.2  22.2   1.1   1.6
5  2018    LA  32,390  73.0  20.5   4.8   1.8
6  2018    AL  60,937  74.0  19.6   4.1   2.3
7  2018    SC  51,985  79.6  13.1   4.4   2.9
8  2018    NC 163,140  68.9  12.7  15.3   3.1
9  2018    VA 253,928  62.9  11.2  21.4   4.5
10 2018    AR  25,565  77.1  10.7   8.7   3.5
11 2018    TN  77,048  77.6  10.5   6.9   5.0
12 2018    TX 419,626  63.4  10.4  20.1   6.0
13 2018    FL 262,240  76.0  10.2   9.2   4.6
14 2018    NY 267,397  65.5   9.2  19.2   6.1
15 2018    MI 133,587  76.8   7.9  12.5   2.8
16 2018    DE  15,130  68.7   7.8  21.2   2.3
17 2018    NV  29,529  71.5   7.1  10.1  11.3
18 2018    WV  15,191  88.3   6.9   2.0   2.8
19 2018    MO  91,938  82.0   6.8   8.2   2.9
20 2018    IL 210,113  70.8   6.7  19.2   3.3
21 2018    OH 163,802  79.7   6.5  11.0   2.8
22 2018    NJ 200,253  52.5   6.4  36.1   5.0
23 2018    KY  44,720  83.1   6.2   6.9   3.8
24 2018    CT  61,648  68.5   5.7  20.8   5.0
25 2018    ND   5,099  80.0   5.5   3.9  10.6
26 2018    OK  40,985  75.1   5.4   3.9  15.7
27 2018    PA 187,200  78.0   5.2  13.0   3.7
28 2018    IN  78,882  82.8   5.1   9.2   2.9
29 2018    KS  46,047  78.6   4.7  13.4   3.3
30 2018    MA 165,550  70.8   4.4  21.1   3.7
31 2018    CO 130,589  81.1   4.3   8.5   6.1
32 2018    AZ 104,915  74.6   4.3  14.6   6.5
33 2018    CA 714,913  48.0   3.8  40.7   7.5
34 2018    MN 107,090  78.0   3.7  15.5   2.7
35 2018    WI  85,170  81.6   3.0  12.0   3.4
36 2018    NM  17,316  80.7   2.9   7.2   9.2
37 2018    NE  29,491  86.5   2.6   8.3   2.5
38 2018    MT  10,653  93.7   2.2   1.1   3.0
39 2018    WA 192,420  62.5   2.2  29.6   5.8
40 2018    HI  13,930  36.7   2.0  43.8  17.4
41 2018    IA  42,114  90.5   1.7   7.6   0.2
42 2018    NH  31,138  82.9   1.5  14.7   0.8
43 2018    UT  67,768  86.4   1.4   7.6   4.5
44 2018    RI  14,590  85.4   1.3  10.7   2.6
45 2018    OR  71,797  80.0   0.8  14.8   4.4
46 2018    SD   8,452  94.2   0.7   1.6   3.6
47 2018    AK   7,476  82.7   0.4   0.0  16.9
48 2018    ID  17,925  95.9   0.0   0.3   3.8
49 2018    ME  12,924  95.6   0.0   1.4   3.0
50 2018    VT   8,250  87.8   0.0  12.2   0.0
51 2018    WY   3,376  96.6   0.0   0.0   3.4

URL parameters (short)=
?minyear=2018&maxyear=2018&STATE=&geo=STATE&occ=Math%20&%20Computer%20Scientists%20&%20SW%20Developers%20(64-68,229)&group=RACE4&sortn=5&mincount=5&color=Set1&geomtype=Line%20Graph
As the above map and table show, the states with the highest percentage of blacks working in math and computer occupations are Maryland, Washington DC, Georgia, Mississippi, Louisiana, and Alabsms.
State Percentage by Race - Computer software developers (229): 2018
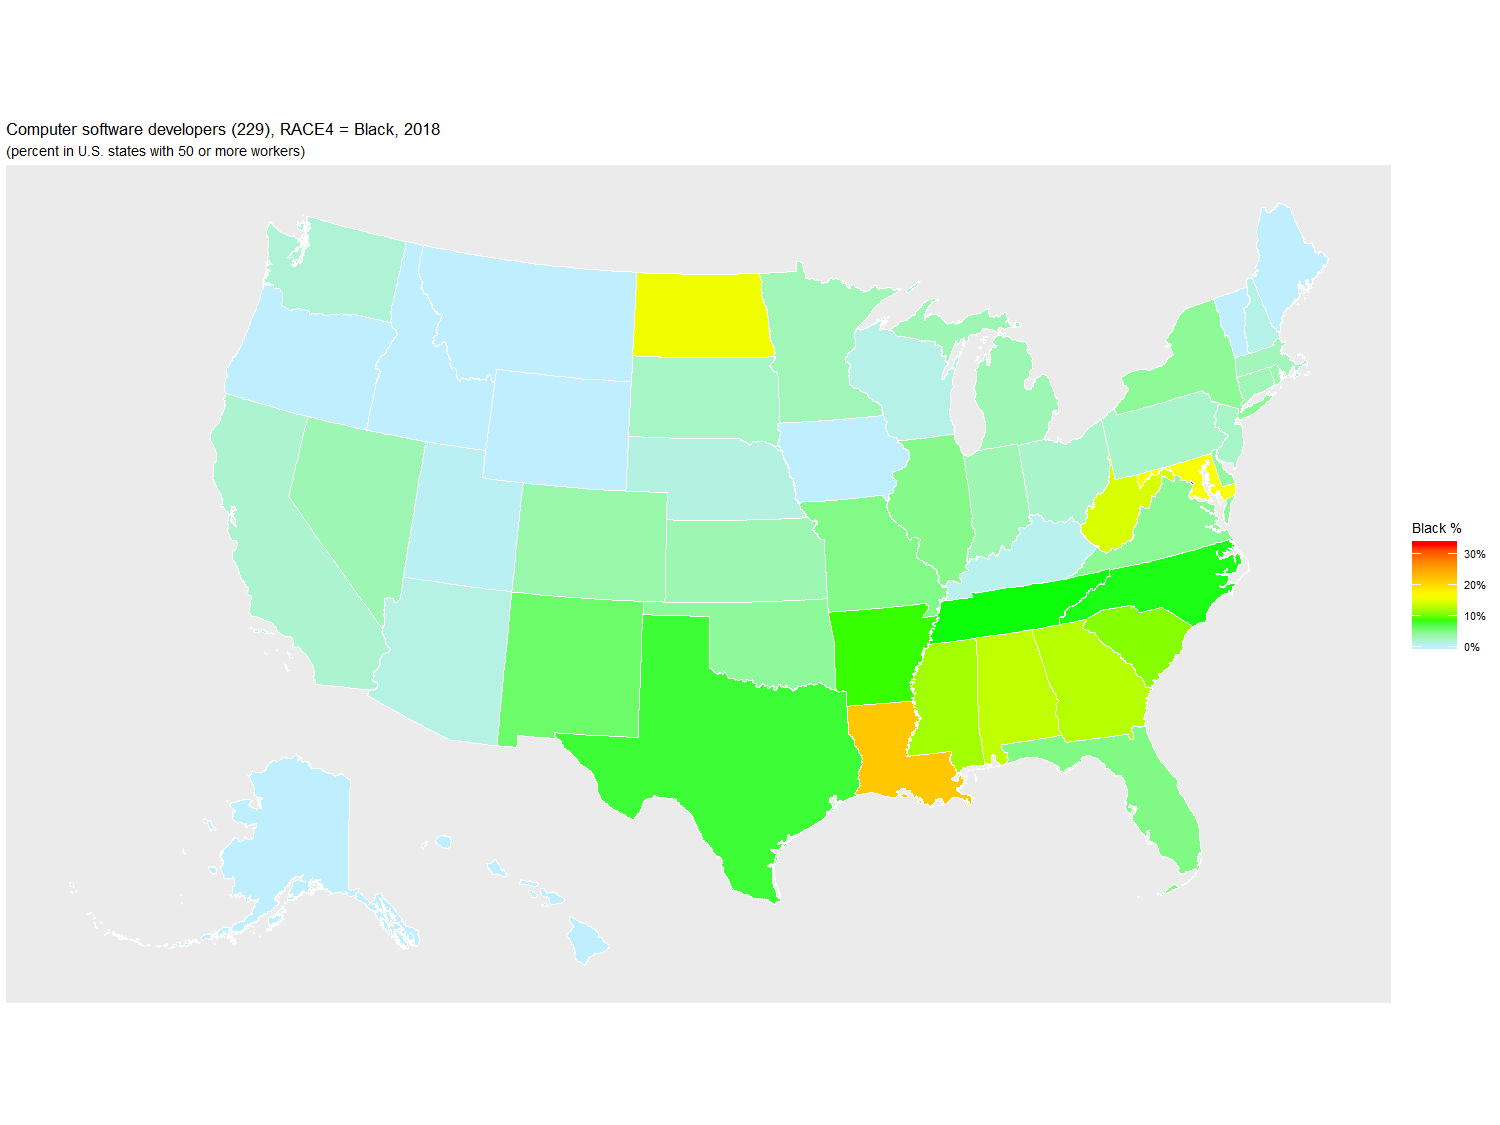
Computer software developers (229): 2018, grouped by RACE4 (percent)

   Year STATE   Count White Black Asian Other
1  2018    DC   5,954  46.7  33.1  11.7   8.5
2  2018    LA   6,830  69.7  21.7   7.4   1.2
3  2018    MD  55,323  59.9  16.1  20.1   3.9
4  2018    ND   1,770  73.1  15.7  11.2   0.0
5  2018    WV   3,077  83.4  14.4   2.2   0.0
6  2018    AL  18,416  78.2  13.2   8.4   0.2
7  2018    GA  54,294  49.6  12.7  32.1   5.5
8  2018    MS   2,625  86.2  11.9   0.0   1.9
9  2018    SC  11,909  81.4  10.8   3.3   4.5
10 2018    AR   7,578  66.0   8.7  21.0   4.2
11 2018    TN  22,383  74.4   8.2   9.9   7.5
12 2018    NC  51,741  63.5   8.1  26.6   1.8
13 2018    TX 133,851  58.0   7.6  30.2   4.2
14 2018    NM   4,125  66.5   6.1  21.6   5.8
15 2018    FL  78,800  77.9   5.1  14.0   3.0
16 2018    MO  32,577  77.1   5.0  16.9   1.0
17 2018    IL  72,109  60.7   4.8  31.2   3.3
18 2018    VA  83,874  60.9   4.4  31.9   2.8
19 2018    NY  85,884  69.0   4.3  22.4   4.3
20 2018    OK   9,665  79.1   4.2   8.8   7.9
21 2018    DE   4,657  44.0   3.9  52.0   0.0
22 2018    CO  53,524  81.4   3.5  11.2   3.9
23 2018    RI   4,268  78.5   3.4  11.2   7.0
24 2018    KS  15,455  62.8   3.2  30.9   3.1
25 2018    IN  24,331  77.2   3.2  17.1   2.5
26 2018    MI  40,892  71.0   3.2  23.0   2.8
27 2018    NV   6,672  66.4   3.1  24.9   5.7
28 2018    CT  23,450  58.4   3.0  31.6   7.0
29 2018    MN  38,545  72.7   3.0  22.7   1.5
30 2018    MA  77,137  67.6   2.8  27.0   2.5
31 2018    SD   2,289  90.3   2.5   0.0   7.3
32 2018    NJ  78,855  44.1   2.4  49.8   3.8
33 2018    PA  62,355  71.3   2.3  22.2   4.2
34 2018    OH  45,991  74.5   2.2  21.0   2.3
35 2018    CA 342,463  41.5   2.0  51.6   4.9
36 2018    WA 106,603  55.9   1.8  37.1   5.2
37 2018    NE   8,965  81.5   1.3  14.0   3.2
38 2018    AZ  32,230  71.1   1.1  23.6   4.2
39 2018    NH  14,787  75.9   1.1  22.4   0.6
40 2018    WI  24,794  78.5   1.0  18.7   1.9
41 2018    KY  11,354  83.1   0.7  11.7   4.6
42 2018    UT  26,901  85.6   0.5  10.9   3.0
43 2018    AK   1,406  86.9   0.0   0.0  13.1
44 2018    HI   2,898  46.1   0.0  42.0  11.9
45 2018    IA  14,065  92.2   0.0   7.8   0.0
46 2018    ID   5,418  93.9   0.0   0.0   6.1
47 2018    ME   4,294  95.6   0.0   0.0   4.4
48 2018    MT   1,926  83.4   0.0   6.1  10.5
49 2018    OR  30,393  74.1   0.0  21.2   4.7
50 2018    VT   4,014  90.4   0.0   9.6   0.0
51 2018    WY      84 100.0   0.0   0.0   0.0

URL parameters (short)=
?minyear=2018&maxyear=2018&STATE=&geo=STATE&occ=Computer%20software%20developers%20(229)&group=RACE4&sortn=5&mincount=5&color=Set1&geomtype=Line%20Graph
As the above map and table show, the states with the highest percentage of blacks working in computer software development Washington DC, Georgia, Louisiana, Maryland, and North Dakota.
Unemployment Rate by Race, All Occupations (1-9999): 2019-01 to 2020-05
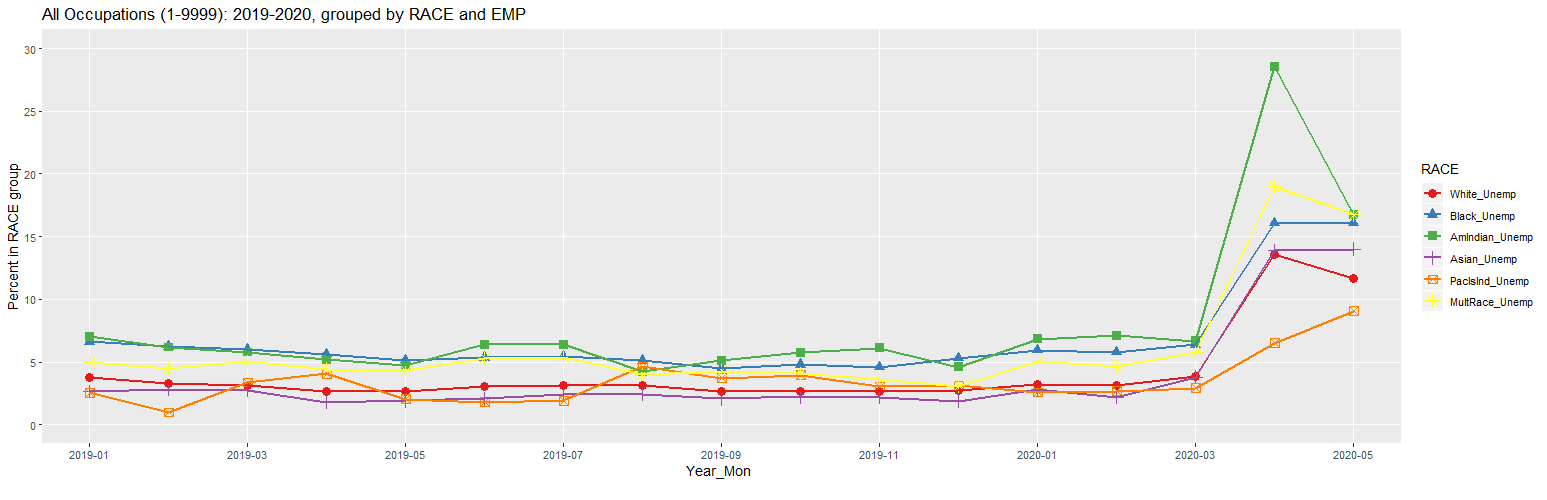
All Occupations (1-9999): 2019-2020, grouped by RACE and EMP (percent in RACE group)

   Year_Mo       Count White_Unemp Black_Unemp AmIndian_Unemp Asian_Unemp PacIslnd_Unemp MultRace_Unemp
1  2019-01 158,800,262         3.7         6.6            7.0         2.7            2.5            5.0
2  2019-02 159,573,979         3.3         6.2            6.2         2.8            1.0            4.5
3  2019-03 159,176,047         3.2         6.0            5.8         2.8            3.4            5.1
4  2019-04 158,378,914         2.6         5.6            5.2         1.8            4.1            4.5
5  2019-05 158,837,158         2.7         5.2            4.7         1.9            2.0            4.3
6  2019-06 159,925,853         3.1         5.3            6.4         2.1            1.8            5.3
7  2019-07 161,318,570         3.2         5.5            6.4         2.4            1.9            5.3
8  2019-08 160,653,164         3.2         5.1            4.2         2.4            4.6            4.1
9  2019-09 161,013,613         2.7         4.5            5.1         2.1            3.7            4.3
10 2019-10 161,420,350         2.7         4.8            5.8         2.2            3.9            4.1
11 2019-11 160,686,463         2.7         4.6            6.1         2.2            3.0            3.6
12 2019-12 160,467,259         2.7         5.3            4.6         1.9            3.1            3.1
13 2020-01 159,730,713         3.3         5.9            6.8         2.8            2.6            5.1
14 2020-02 160,387,043         3.2         5.8            7.1         2.2            2.7            4.6
15 2020-03 158,014,678         3.9         6.4            6.7         3.8            2.9            5.7
16 2020-04 151,656,440        13.6        16.1           28.5        13.9            6.5           19.0
17 2020-05 152,816,738        11.7        16.1           16.7        14.0            9.1           16.7

URL parameters (short)=
?minyear=2019&maxyear=2020&STATE=&units=Percent%20in%20group&geo=NATION&occ=All%20Occupations%20(1-9999)&empstat=In%20labor%20force&group=RACE|EMP&sortn=2&sortdir=Ascending&ymax=30&color=Set1&geomtype=Line%20Graph