H-1B and Related Data for California


Non-citizen Software Developers in California, 2017

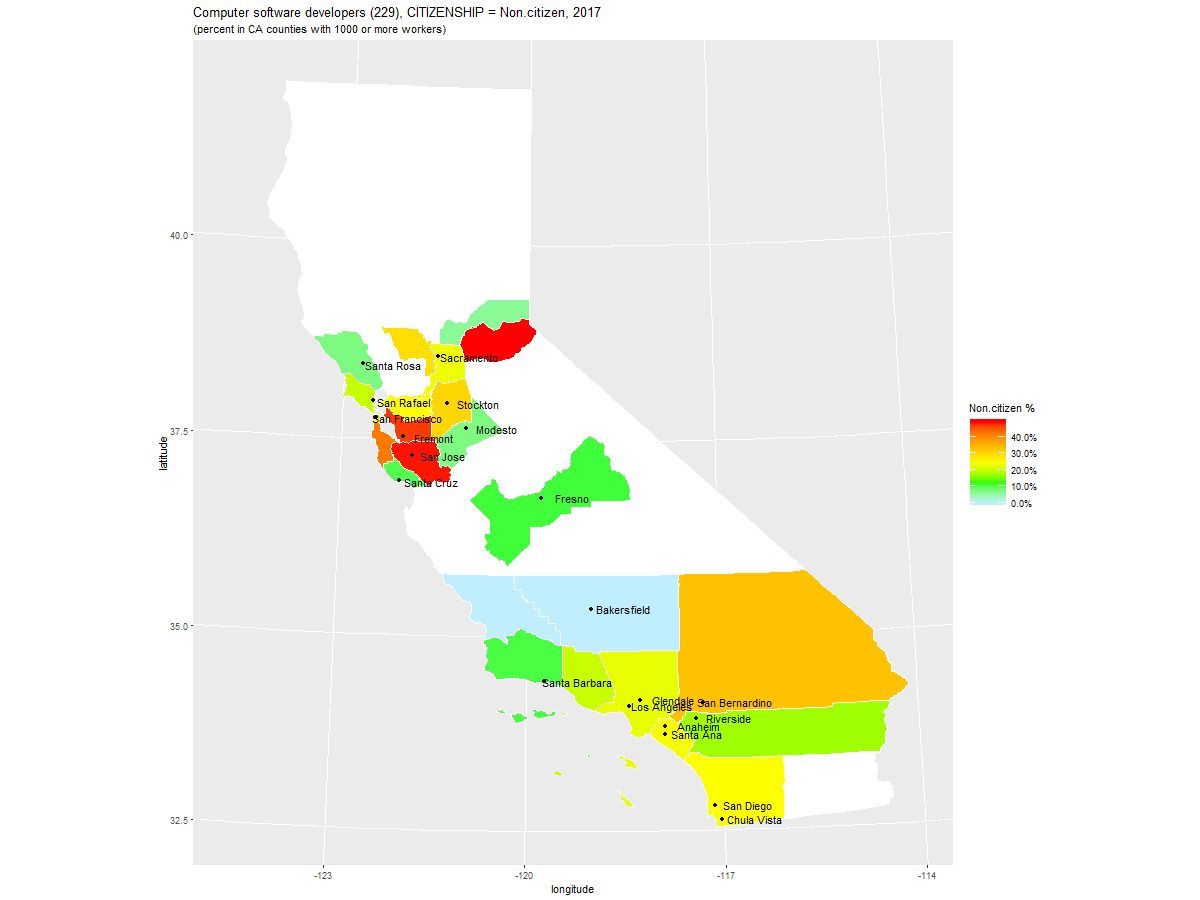
Percent of Computer Software Developers in California, grouped by CITIZENSHIP, sorted by Non-citizen, 2017

Computer software developers (229): 2017, grouped by CITIZENSHIP (percent)

   Year                    COUNTY  Count Non.citizen Naturalized U.S._Born  County Seat      Other Major Cities
1  2017       El Dorado County CA  1,205        49.8         0.0      50.2  Placerville      South Lake Tahoe (east of Sacramento)
2  2017     Santa Clara County CA 90,412        49.4        23.6      26.9  San Jose         Milpitas, Moutain View, Palo Alto
3  2017         Alameda County CA 39,393        47.9        22.1      30.0  Oakland          Berkeley, Fremont, Livermore
4  2017       San Mateo County CA 19,108        42.3        23.4      34.2  Redwood City     San Mateo, South San Francisco
5  2017  San Bernardino County CA  4,067        33.4        22.8      43.8  San Bernardino   Victorville, Apple Valley
6  2017     San Joaquin County CA  2,148        30.4        15.3      54.3  Stockton         Lodi, Tracy (south of Sacramento)
7  2017            Yolo County CA  1,016        29.3         9.2      61.5  Woodland         Davis (west of Sacramento)
8  2017    Contra Costa County CA 13,197        25.3        35.1      39.6  Martinez         Concord, Richmond, Walnut Creek (north of Fremont)
9  2017       San Diego County CA 27,569        24.8        23.8      51.4  San Diego        Carlsbad, Chula Vista
10 2017   San Francisco County CA 25,559        24.3        10.6      65.1  San Francisco
11 2017          Orange County CA 29,277        24.2        26.9      48.9  Santa Ana        Anaheim, Huntington Beach, Irvine
12 2017      Sacramento County CA  9,603        23.7        13.7      62.7  Sacramento       Elk Grove, Folsom
13 2017     Los Angeles County CA 46,009        22.9        19.1      57.9  Los Angeles      Long Beach, Lancaster, Santa Clarita
14 2017         Ventura County CA  3,917        20.5        19.1      60.5  Ventura          Oxnard, Thousand Oaks (east of Santa Barbara)
15 2017           Marin County CA  1,579        20.3        14.6      65.0  San Rafael       Larkspur, Mill Valley, Novato
16 2017       Riverside County CA  5,659        17.7        14.6      67.6  Riverside        Palm Springs
17 2017          Fresno County CA  1,481        11.3        17.4      71.3  Fresno           Coalinga, Mendota
18 2017   Santa Barbara County CA  2,208        10.9         0.0      89.1  Santa Barbara    Santa Maria
19 2017      Santa Cruz County CA  2,342        10.5        10.5      79.0  Santa Cruz       Scotts Valley, Watsonville
20 2017          Sonoma County CA  2,689         7.9        12.3      79.8  Santa Rosa       Petaluma, Sonoma
21 2017      Stanislaus County CA  1,075         7.8         8.9      83.3  Modesto          Turlock, Oakdale, Salida
22 2017          Placer County CA  2,372         6.6        16.7      76.7  Auburn           Olympic Valley (northeast of Sacramento)
23 2017                      (NA)  2,529         5.3        21.7      73.0
24 2017            Kern County CA  1,011         0.0         0.0     100.0  Bakersfield      Buttonwillow, Lost Hills
25 2017 San Luis Obispo County CA  2,394         0.0         1.9      98.1  San Luis Obispo  Morrow Bay, Pismo Beach (north of Santa Barbara)

URL parameters (short)=
?geo=COUNTY&occ=Computer%20software%20developers%20(229)&group=CITIZENSHIP&sortn=4&mincount=1000
Source: Census Bureau, AMERICAN COMMUNITY SURVEY 2017 SAMPLE

Certified Labor Condition Application (LCA) Data for California, FY 2019

Top 50 Worksite EMPLOYER_NAMEs and WORKSITE_CITYs, sorted by WORKERS, All Worksites

                              EMPLOYER_NAME2       WORKSITE_CITY WORKERS APPLICATIONS
1                                      APPLE           CUPERTINO   16506          663
2                      QUALCOMM TECHNOLOGIES           SAN DIEGO   11315          237
3                              CISCO SYSTEMS            SAN JOSE    8399         1360
4                                     NVIDIA         SANTA CLARA    6221          227
5                                   FACEBOOK          MENLO PARK    4592         1559
6                                     GOOGLE       MOUNTAIN VIEW    4544         4468
7                           QUALCOMM ATHEROS            SAN JOSE    3720           73
8               WESTERN DIGITAL TECHNOLOGIES            SAN JOSE    3280          124
9                                 SERVICENOW         SANTA CLARA    3060          178
10                     QUALCOMM TECHNOLOGIES            SAN JOSE    2705           50
11                                     APPLE           SUNNYVALE    2641         2242
12                         UBER TECHNOLOGIES       SAN FRANCISCO    2423          694
13                                  SYNOPSYS       MOUNTAIN VIEW    2415           61
14                           GILEAD SCIENCES         FOSTER CITY    2309          324
15                            ORACLE AMERICA           SAN BRUNO    2045           89
16                                    GOOGLE           SUNNYVALE    1943         1823
17                                  QUALCOMM           SAN DIEGO    1934          122
18                                   WORKDAY          PLEASANTON    1794          111
19                HEWLETT PACKARD ENTERPRISE         SANTA CLARA    1688           59
20                       DELOITTE CONSULTING            SAN JOSE    1619          125
21                                     QUORA       MOUNTAIN VIEW    1616           49
22                         APPLIED MATERIALS         SANTA CLARA    1579          232
23                               AKT AMERICA         SANTA CLARA    1564           31
24                               INFORMATICA        REDWOOD CITY    1552           83
25                       DELOITTE CONSULTING       SAN FRANCISCO    1500           97
26                                    PAYPAL            SAN JOSE    1424          813
27                QUALCOMM INNOVATION CENTER           SAN DIEGO    1300           22
28                         UBER TECHNOLOGIES           PALO ALTO    1254          143
29                          QUALCOMM ATHEROS           SAN DIEGO    1200           25
30                            SALESFORCE.COM       SAN FRANCISCO    1199          783
31                                      EBAY            SAN JOSE    1125          533
32                HEWLETT PACKARD ENTERPRISE            SAN JOSE    1090           59
33                                      HGST            SAN JOSE    1090           45
34                           MENTOR GRAPHICS             FREMONT    1052           44
35                                SERVICENOW           SAN DIEGO    1033           51
36                             CISCO SYSTEMS       SAN FRANCISCO    1016           68
37                                     INTEL              FOLSOM     960          216
38                                        HP           PALO ALTO     909           31
39                              A10 NETWORKS            SAN JOSE     884           44
40                     CYPRESS SEMICONDUCTOR            SAN JOSE     850           45
41                         APPLIED MATERIALS           SUNNYVALE     822          109
42                                     INTEL         SANTA CLARA     792          375
43                                    VMWARE           PALO ALTO     777          707
44                                  LINKEDIN           SUNNYVALE     697          474
45                       DELOITTE CONSULTING         LOS ANGELES     661           55
46                             OATH HOLDINGS           SUNNYVALE     636          310
47                         QUEST DIAGNOSTICS SAN JUAN CAPISTRANO     630           10
48                                EVELOZCITY            TORRANCE     623           31
49                            ORACLE AMERICA         SANTA CLARA     615           30
50                                       BOX        REDWOOD CITY     612           61

Top 50 Worksite EMPLOYER_NAMEs and WORKSITE_CITYs, sorted by WORKERS, Local Worksites Only

                              EMPLOYER_NAME2       WORKSITE_CITY WORKERS APPLICATIONS
1                                      APPLE           CUPERTINO   16301          540
2                      QUALCOMM TECHNOLOGIES           SAN DIEGO   11266          204
3                              CISCO SYSTEMS            SAN JOSE    6835          312
4                                     NVIDIA         SANTA CLARA    6200          206
5                                   FACEBOOK          MENLO PARK    4454         1435
6                                     GOOGLE       MOUNTAIN VIEW    4086         4086
7                           QUALCOMM ATHEROS            SAN JOSE    3720           73
8               WESTERN DIGITAL TECHNOLOGIES            SAN JOSE    3275          119
9                                 SERVICENOW         SANTA CLARA    3031          149
10                     QUALCOMM TECHNOLOGIES            SAN JOSE    2705           50
11                                  SYNOPSYS       MOUNTAIN VIEW    2412           58
12                         UBER TECHNOLOGIES       SAN FRANCISCO    2385          676
13                           GILEAD SCIENCES         FOSTER CITY    2097          116
14                            ORACLE AMERICA           SAN BRUNO    2045           89
15                                  QUALCOMM           SAN DIEGO    1780           44
16                                   WORKDAY          PLEASANTON    1776           93
17                HEWLETT PACKARD ENTERPRISE         SANTA CLARA    1685           56
18                                    GOOGLE           SUNNYVALE    1662         1662
19                                     QUORA       MOUNTAIN VIEW    1616           49
20                       DELOITTE CONSULTING            SAN JOSE    1604          124
21                               AKT AMERICA         SANTA CLARA    1564           31
22                               INFORMATICA        REDWOOD CITY    1535           80
23                       DELOITTE CONSULTING       SAN FRANCISCO    1500           97
24                         APPLIED MATERIALS         SANTA CLARA    1484          139
25                QUALCOMM INNOVATION CENTER           SAN DIEGO    1300           22
26                         UBER TECHNOLOGIES           PALO ALTO    1254          143
27                          QUALCOMM ATHEROS           SAN DIEGO    1200           25
28                                    PAYPAL            SAN JOSE    1155          636
29                            SALESFORCE.COM       SAN FRANCISCO    1150          748
30                                      HGST            SAN JOSE    1088           43
31                           MENTOR GRAPHICS             FREMONT    1052           44
32                                SERVICENOW           SAN DIEGO    1032           50
33                                      EBAY            SAN JOSE    1021          432
34                             CISCO SYSTEMS       SAN FRANCISCO    1015           67
35                HEWLETT PACKARD ENTERPRISE            SAN JOSE    1006           33
36                                     INTEL              FOLSOM     895          174
37                                        HP           PALO ALTO     892           28
38                              A10 NETWORKS            SAN JOSE     880           40
39                     CYPRESS SEMICONDUCTOR            SAN JOSE     850           45
40                         APPLIED MATERIALS           SUNNYVALE     820          107
41                                    VMWARE           PALO ALTO     740          673
42                       DELOITTE CONSULTING         LOS ANGELES     661           55
43                                     INTEL         SANTA CLARA     653          279
44                             OATH HOLDINGS           SUNNYVALE     636          310
45                                EVELOZCITY            TORRANCE     623           31
46                                  LINKEDIN           SUNNYVALE     619          402
47                            ORACLE AMERICA         SANTA CLARA     615           30
48                    A2Z DEVELOPMENT CENTER           SUNNYVALE     611          341
49                       WAL-MART ASSOCIATES           SUNNYVALE     602          602
50                                       BOX        REDWOOD CITY     591           49

Top 50 Worksite EMPLOYER_NAMEs and WORKSITE_CITYs, sorted by WORKERS, Remote Worksites Only

                              EMPLOYER_NAME2       WORKSITE_CITY WORKERS APPLICATIONS
1                                      APPLE           SUNNYVALE    2575         2176
2                              CISCO SYSTEMS            SAN JOSE    1564         1048
3                          QUEST DIAGNOSTICS SAN JUAN CAPISTRANO     608            7
4                 SOUTHERN CALIFORNIA EDISON            ROSEMEAD     490          344
5                                     GOOGLE       MOUNTAIN VIEW     458          382
6                          KAISER PERMANENTE          PLEASANTON     372          287
7                    CAPITAL GROUP COMPANIES              IRVINE     337          329
8                                     GOOGLE           SUNNYVALE     281          161
9                                     PAYPAL            SAN JOSE     269          177
10                                       GAP       SAN FRANCISCO     265          251
11                               WELLS FARGO       SAN FRANCISCO     227          177
12                                     CISCO            SAN JOSE     225          203
13                                      AT&T          EL SEGUNDO     219          177
14                           GILEAD SCIENCES         FOSTER CITY     212          208
15                                     APPLE           CUPERTINO     205          123
16                         QUEST DIAGNOSTICS          WEST HILLS     204            6
17                         QUEST DIAGNOSTICS            VALENCIA     203            5
18                         QUEST DIAGNOSTICS          SACRAMENTO     203            5
19                             FARMERS GROUP      WOODLAND HILLS     198          144
20                         MOLINA HEALTHCARE          LONG BEACH     184          184
21                       FIRST REPUBLIC BANK       SAN FRANCISCO     178           77
22                   FARMERS INSURANCE GROUP      WOODLAND HILLS     167          163
23                                   WALMART           SUNNYVALE     157          152
24                                    GOOGLE            SAN JOSE     154          149
25                                  QUALCOMM           SAN DIEGO     154           78
26                              LEVI STRAUSS       SAN FRANCISCO     151          109
27                              CISCO SYSTEM            SAN JOSE     140           47
28                                     INTEL         SANTA CLARA     139           96
29                                  FACEBOOK          MENLO PARK     138          124
30               SONY PICTURES ENTERTAINMENT         CULVER CITY     133           79
31                                    INTUIT       MOUNTAIN VIEW     128           91
32                                       GAP          PLEASANTON     120          120
33                 BLUE SHIELD OF CALIFORNIA       SAN FRANCISCO     115          104
34                                 GENENTECH SOUTH SAN FRANCISCO     113          113
35                          WELLS FARGO BANK       SAN FRANCISCO     110           36
36                           WILLIAMS-SONOMA       SAN FRANCISCO     110           31
37                                      EBAY            SAN JOSE     104          101
38                        CITY NATIONAL BANK         LOS ANGELES     100           59
39                                     AMGEN       THOUSAND OAKS      98           89
40                 BLUE SHIELD OF CALIFORNIA     EL DORADO HILLS      96           72
41                         APPLIED MATERIALS         SANTA CLARA      95           93
42                                   SAFEWAY          PLEASANTON      94           73
43                                    INTUIT           SAN DIEGO      93           39
44                                     KOFAX              IRVINE      93            7
45                          BANK OF THE WEST           SAN RAMON      92           57
46                                   CHEVRON           SAN RAMON      92           90
47                                    BOEING          SEAL BEACH      92           20
48                                    ANTHEM      WOODLAND HILLS      89           47
49   BLUE DIAMOND GROWERS - CORPORATE CAMPUS          SACRAMENTO      87           87
50                HEWLETT PACKARD ENTERPRISE            SAN JOSE      84           26
Note: Remote Worksites denote when workers will be placed at a secondary location.
      In this case, field SECONDARY ENTITY is set to Y as explained in this File Structure file and
      EMPLOYER_NAME2 above will be set to the contents of field SECONDARY ENTITY BUSINESS NAME.
      Local Worksites denote when workers will NOT be placed at a secondary location.
Source: OFLC Performance Data (click Disclosure Data tab and go to section
        "Latest Quarterly Updates"), 2019

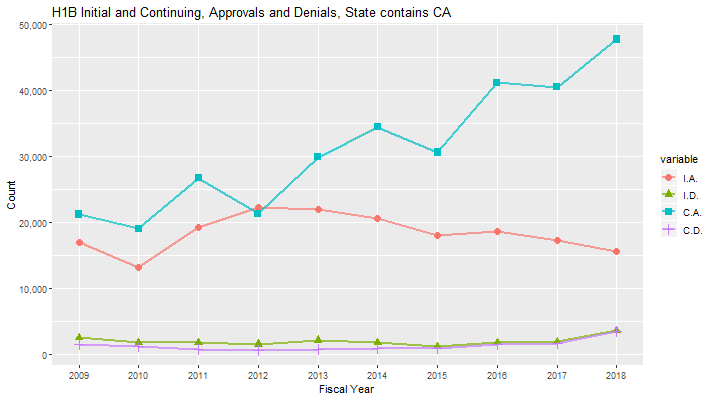
Labor Condition Application (LCA) Data for California, FY 2015-2018

YEAR CASE_STATUS WORKERS APPLICATIONS
2015   CERTIFIED  206579       100710
2016   CERTIFIED  225472       104070
2017   CERTIFIED  248871       103088
2018   CERTIFIED  304304       112887

Labor Condition Application (LCA) Data for California, FY 2018

Grouped by CASE_STATUS

  CASE_STATUS WORKERS APPLICATIONS
1   CERTIFIED  304304       112887
2 CERT-WITHDR   11097         9766
3   WITHDRAWN    5599         3999
4      DENIED    4776         1825

Grouped by VISA_CLASS

       VISA_CLASS WORKERS APPLICATIONS
1            H-1B  321208       124260
2  E-3 Australian    3873         3582
3 H-1B1 Singapore     482          440
4     H-1B1 Chile     213          195

Top 50 EMPLOYER_NAMEs, sorted by WORKERS

                               EMPLOYER_NAME WORKERS APPLICATIONS
1                     ERNST & YOUNG U.S. LLP   30791         1239
2                                 APPLE INC.   21935         1660
3                QUALCOMM TECHNOLOGIES, INC.   17528          357
4                         NVIDIA CORPORATION   10512          414
5                     QUALCOMM ATHEROS, INC.    9867          192
6                    DELOITTE CONSULTING LLP    8204         1905
7                          HCL AMERICA, INC.    7772          480
8                                KFORCE INC.    7140          239
9                             SYNOPSYS, INC.    5727          113
10                       CISCO SYSTEMS, INC.    5032          428
11                                GOOGLE LLC    4985         4985
12                          SERVICENOW, INC.    4892          232
13                            FACEBOOK, INC.    4356         2066
14                   UBER TECHNOLOGIES, INC.    3569          926
15                     QUALCOMM INCORPORATED    3489           70
16  COGNIZANT TECHNOLOGY SOLUTIONS U.S. CORP    2957          179
17                       ORACLE AMERICA, INC    2795          255
18                   APPLIED MATERIALS, INC.    2563          262
19        WESTERN DIGITAL TECHNOLOGIES, INC.    2453          214
20         TATA CONSULTANCY SERVICES LIMITED    2288         1628
21                             WORKDAY, INC.    2244          152
22                       MPHASIS CORPORATION    2178          101
23                     GILEAD SCIENCES, INC.    2101           98
24                           INFOSYS LIMITED    2068         2068
25                           INFORMATICA LLC    1940          103
26    COGNIZANT TECHNOLOGY SOLUTIONS US CORP    1703         1268
27                             WIPRO LIMITED    1642         1010
28        HEWLETT PACKARD ENTERPRISE COMPANY    1553          145
29           QUALCOMM INNOVATION CENTER INC.    1495           32
30            MANAGEMENT HEALTH SYSTEMS, LLC    1321           34
31                         INTEL CORPORATION    1305          577
32                      LINKEDIN CORPORATION    1299          879
33                        EPAM SYSTEMS, INC.    1291          131
34                                 EBAY INC.    1249          813
35                              PAYPAL, INC.    1175          853
36                      BROADCOM CORPORATION    1161          148
37                       SALESFORCE.COM INC.    1120          746
38                ADOBE SYSTEMS INCORPORATED    1107          448
39                        A10 NETWORKS, INC.    1095           45
40                               INTUIT INC.    1073          438
41              A2Z DEVELOPMENT CENTER, INC.    1066          673
42              CADENCE DESIGN SYSTEMS, INC.    1041          148
43                        MACHINE ZONE, INC.    1040           52
44                     CAPGEMINI AMERICA INC    1027          463
45                               TESLA, INC.     941          941
46         CYPRESS SEMICONDUCTOR CORPORATION     931           43
47                 AMAZON.COM SERVICES, INC.     924          535
48                             ACCENTURE LLP     915          732
49                     DELOITTE & TOUCHE LLP     890          282
50          LARSEN & TOUBRO INFOTECH LIMITED     863          474

Top 30 SOC_NAMEs, sorted by WORKERS

                                    SOC_NAME WORKERS APPLICATIONS
1          SOFTWARE DEVELOPERS, APPLICATIONS   70523        39318
2      SOFTWARE DEVELOPERS, SYSTEMS SOFTWARE   34535         8828
3     ELECTRONICS ENGINEERS, EXCEPT COMPUTER   29201         3268
4                  COMPUTER SYSTEMS ANALYSTS   24345         8726
5            COMPUTER OCCUPATIONS, ALL OTHER   23826        10443
6                   ACCOUNTANTS AND AUDITORS   14016         2824
7                       COMPUTER PROGRAMMERS    9524         3647
8               OPERATIONS RESEARCH ANALYSTS    9112         2759
9                        MANAGEMENT ANALYSTS    7883         2175
10  COMPUTER AND INFORMATION SYSTEMS MANAGER    5946         2488
11                      ELECTRICAL ENGINEERS    5324         2003
12                   DATABASE ADMINISTRATORS    4688         1686
13                        FINANCIAL ANALYSTS    4476         1640
14          FINANCIAL SPECIALISTS, ALL OTHER    4433          446
15               COMPUTER HARDWARE ENGINEERS    4258          743
16                             STATISTICIANS    4242         1691
17                      MECHANICAL ENGINEERS    3924         1740
18  NETWORK AND COMPUTER SYSTEMS ADMINISTRAT    3807         1637
19  MARKET RESEARCH ANALYSTS AND MARKETING S    3744         2080
20                  COMPUTER SYSTEMS ANALYST    3559         2139
21                      INDUSTRIAL ENGINEERS    3235          982
22    ARCHITECTURAL AND ENGINEERING MANAGERS    3137          647
23                           SALES ENGINEERS    2743          936
24             INFORMATION SECURITY ANALYSTS    2498          788
25  COMPUTER AND INFORMATION RESEARCH SCIENT    2426         1193
26                              LOGISTICIANS    2241          601
27               COMPUTER NETWORK ARCHITECTS    2049          565
28                        MARKETING MANAGERS    1952         1001
29  MEDICAL AND CLINICAL LABORATORY TECHNOLO    1886          274
30                       MATERIALS ENGINEERS    1585          373

Note: SOC_NAME is the occupational name associated with the SOC_CODE.
      SOC_CODE is the occupational code associated with the job being
      requested for temporary labor condition, as classified by the
      Standard Occupational Classification (SOC) System.

Top 30 WORKSITE_CITYs, sorted by WORKERS

             WORKSITE_CITY WORKERS APPLICATIONS
1                 SAN JOSE   42810        12265
2            SAN FRANCISCO   40520        18362
3                SAN DIEGO   30628         4516
4              SANTA CLARA   27620         6376
5                CUPERTINO   22781         2180
6              LOS ANGELES   18898         5367
7            MOUNTAIN VIEW   15960         8110
8                SUNNYVALE   15573        10311
9                PALO ALTO    7914         4576
10                  IRVINE    7486         3398
11            REDWOOD CITY    7241         1654
12              MENLO PARK    5637         2976
13              PLEASANTON    5485         2349
14                MILPITAS    5411         1968
15                 FREMONT    4100         3109
16               SAN RAMON    3628         1458
17             FOSTER CITY    3581         1360
18               SAN MATEO    2884         1802
19              SACRAMENTO    1969         1108
20          WOODLAND HILLS    1891         1011
21                 OAKLAND    1687          969
22           THOUSAND OAKS    1485          716
23              EL SEGUNDO    1451         1168
24            SANTA MONICA    1362         1030
25          REDWOOD SHORES    1286          135
26                PASADENA    1278          957
27                 BURBANK    1081          421
28     SAN JUAN CAPISTRANO    1075          125
29                  FOLSOM    1019          467
30     SOUTH SAN FRANCISCO    1002          856
Source: OFLC Performance Data (click Disclosure Data tab and go to section
        "LCA Programs (H-1B, H-1B1, E-3)"), 2015, 2016, 2017, and 2018

H1B Approval data for California, 2009-2018

H-1B Approval Data for California, FY 2009-2018

   FYear Records  I.A. I.D.  C.A. C.D. Workers I.A.R C.A.R T.A.R
1   2009   12981 16991 2450 21189 1399   38180  87.4  93.8  90.8
2   2010   10727 13207 1720 19051 1075   32258  88.5  94.7  92.0
3   2011   11726 19185 1723 26702  723   45887  91.8  97.4  94.9
4   2012   10269 22193 1474 21283  563   43476  93.8  97.4  95.5
5   2013   11085 21991 2063 29868  705   51859  91.4  97.7  94.9
6   2014   10704 20565 1694 34430  808   54995  92.4  97.7  95.6
7   2015    9601 18018 1069 30617  815   48635  94.4  97.4  96.3
8   2016   10819 18626 1720 41201 1520   59827  91.5  96.4  94.9
9   2017    9755 17246 1891 40547 1614   57793  90.1  96.2  94.3
10  2018   10871 15642 3498 47774 3367   63416  81.7  93.4  90.2

Key: I.A. = Initial Approval, I.D. = Initial Denial, C.A. = Continuing Approval, C.D. = Continuing Denial,
     I.A.R. = Initial Approval Rate, C.A.R. = Continuing Approval Rate, T.A.R. = Total Approval Rate

H-1B Approval Data for California, FY 2018

Top 50 Employers, sorted by Workers (Initial Approvals plus Continuing Approvals)

  FYear Records  I.A. I.D.  C.A. C.D. Workers I.A.R C.A.R T.A.R
1  2018   10871 15642 3498 47774 3367   63416  81.7  93.4  90.2

                              Employer Records I.A. I.D. C.A. C.D. Workers I.A.R C.A.R T.A.R
1                            APPLE INC      11  701   13 2402   26    3103  98.2  98.9  98.8
2                           GOOGLE LLC       9  727    6 1936   17    2663  99.2  99.1  99.1
3                         FACEBOOK INC      26  669    7 1816   14    2485  99.0  99.2  99.2
4                      HCL AMERICA INC       9  196  102 2111  509    2307  65.8  80.6  79.1
5                    CISCO SYSTEMS INC       9  331   13 1328   28    1659  96.2  97.9  97.6
6                   ORACLE AMERICA INC      17  158   14 1329   25    1487  91.9  98.2  97.4
7            QUALCOMM TECHNOLOGIES INC      12  115   13  774   12     889  89.8  98.5  97.3
8                   SALESFORCE.COM INC       1  115    2  692   23     807  98.3  96.8  97.0
9                 LINKEDIN CORPORATION       5  165    3  561   10     726  98.2  98.2  98.2
10                      UST GLOBAL INC       6   42   56  680  152     722  42.9  81.7  77.6
11               UBER TECHNOLOGIES INC       7  152   10  544   10     696  93.8  98.2  97.2
12                          PAYPAL INC       9  127    2  519    6     646  98.4  98.9  98.8
13                  NVIDIA CORPORATION       5  162    0  474    1     636 100.0  99.8  99.8
14                            EBAY INC       5   79    3  481    4     560  96.3  99.2  98.8
15                          VMWARE INC       2  102    1  435    4     537  99.0  99.1  99.1
16          ADOBE SYSTEMS INCORPORATED       2  150    1  342    4     492  99.3  98.8  99.0
17                          INTUIT INC       3   86    5  324    3     410  94.5  99.1  98.1
18                           TESLA INC       4  128    5  273   10     401  96.2  96.5  96.4
19                  YAHOO HOLDINGS INC       3  129    5  240    8     369  96.3  96.8  96.6
20   THE LELAND STANFORD JR UNIVERSITY       3  195    1  167    1     362  99.5  99.4  99.5
21                        SYNOPSYS INC       3   44    2  229    6     273  95.7  97.4  97.2
22              PERSISTENT SYSTEMS INC       2   19   23  227   55     246  45.2  80.5  75.9
23                     GLOBALLOGIC INC       2   25    3  219   12     244  89.3  94.8  94.2
24          ADVANCED MICRO DEVICES INC       3   92    2  145    2     237  97.9  98.6  98.3
25      VISA TECHNOLOGY OPERATIONS LLC       3   77    2  158    3     235  97.5  98.1  97.9
26                SYMANTEC CORPORATION       5   10    0  214    1     224 100.0  99.5  99.6
27                BROADCOM CORPORATION       4   44    1  174    5     218  97.8  97.2  97.3
28                JUNIPER NETWORKS INC       1   29    1  188    7     217  96.7  96.4  96.4
29                      SERVICENOW INC       3   37    2  175    1     212  94.9  99.4  98.6
30                            LYFT INC       1   23    0  187    4     210 100.0  97.9  98.1
31                          AIRBNB INC       2   44    0  164    4     208 100.0  97.6  98.1
32                         NETFLIX INC       2   11    0  196    3     207 100.0  98.5  98.6
33               APPLIED MATERIALS INC       3   81   13  124    3     205  86.2  97.6  92.8
34    WESTERN DIGITAL TECHNOLOGIES INC       5   49    1  155    2     204  98.0  98.7  98.6
35              GLOBALFOUNDRIES US INC       1  110    5   89    2     199  95.7  97.8  96.6
36              PALO ALTO NETWORKS INC       3   29    3  170    3     199  90.6  98.3  97.1
37                         NAGARRO INC       3   77    5  103   16     180  93.9  86.6  89.6
38                          ANTHEM INC       4    2    0  177    6     179 100.0  96.7  96.8
39                        AUTODESK INC       2   34    2  143    4     177  94.4  97.3  96.7
40            UNIV OF CA SAN FRANCISCO       2  103    0   74    1     177 100.0  98.7  99.4
41                          NETAPP INC       1   21    2  143    5     164  91.3  96.6  95.9
42                         WORKDAY INC       2    5    0  158    2     163 100.0  98.8  98.8
43                         NUTANIX INC       2   25    1  137    7     162  96.2  95.1  95.3
44   UNIVERSITY OF SOUTHERN CALIFORNIA       1   82    0   74    2     156 100.0  97.4  98.7
45                        VISA USA INC       2   46    0  110    2     156 100.0  98.2  98.7
46                           AMGEN INC       6   33    6  121    4     154  84.6  96.8  93.9
47              NISUM TECHNOLOGIES INC       4    0    2  147   18     147   0.0  89.1  88.0
48                         TWITTER INC       4   19    2  125    6     144  90.5  95.4  94.7
49                    BANK OF THE WEST       2   20    0  123    4     143 100.0  96.9  97.3
50                  SRS CONSULTING INC       2    8    3  133   13     141  72.7  91.1  89.8

Key: I.A. = Initial Approval, I.D. = Initial Denial, C.A. = Continuing Approval, C.D. = Continuing Denial,
     I.A.R. = Initial Approval Rate, C.A.R. = Continuing Approval Rate, T.A.R. = Total Approval Rate
Source: H-1B Employer Data Hub Files, U.S. Citizenship and Immigration Services

California Schools Among the Top 100 by Total Number of Students Participating in Optional Practical Training (OPT), 2017

California Schools Among the Top 100 by Total Number of Students Participating in Optional Practical Training (OPT), 2017

N                               School Name State Students
-- ---------------------------------------- ----- --------
2       Northwestern Polytechnic University    CA     6060
3         University of Southern California    CA     5844
11                Silicon Valley University    CA     3127
14    University of California, Los Angeles    CA     2724
15     University of California at Berkeley    CA     2690
19                San Jose State University    CA     2489
33       University of California San Diego    CA     1955
43                Academy of Art University    CA     1741
48         UNIVERSITY OF CALIFORNIA, IRVINE    CA     1604
50                      Stanford University    CA     1582
66    California State University Fullerton    CA     1224
70                           UCLA-Extension    CA     1145
80          University of California, Davis    CA     1033
89 CALIFORNIA STATE UNIVERSITY, LOS ANGELES    CA      951
92   California State University Long Beach    CA      888
-- ---------------------------------------- ----- --------
                             Total Students    CA    35057

Sources: U.S. Immigration and Customs Enforcement,
         2017 Top 100 Schools by Total Number of Students Participating in OPT

California Schools Among Top 427 Employers for Optional Practical Training (OPT) Students, 2017

California Schools Among Top 427 Employers for Optional Practical Training (OPT) plus Curricular Practical Training (CPT) Students, 2017

N                                  Employer Pre&Post  STEM   CPT Total
--- --------------------------------------- -------- ----- ----- -----
26                      Stanford University      298   250    41   589
65        University of Southern California      221    74     0   295
97       University of California, Berkeley      126    88     0   214
100      California Institute of Technology      119    85     0   204
114      University of California San Diego      177     0     0   177
115   University of California, Los Angeles      110    67     0   177
150 University of California, San Francisco       81    61     0   142
--- --------------------------------------- -------- ----- ----- -----
                             Total Students     1132   625    41  1798

Sources: U.S. Immigration and Customs Enforcement,
         2017 Top 200 Employers for Pre- and Post-Completion OPT Students,
         2017 Top 200 Employers for STEM OPT Students,
         2017 Top 200 Employers for CPT Students

Census Data for Computer Software Developers in California in 1980-2017

Percent of Computer Software Developers in California, grouped by BIRTHPLACE and SEX: 1980-2017

Computer software developers (229): 1980-2017, grouped by BIRTHPLACE_TECH and SEX_M_F, STATE=CA (percent)

  Year   Count U.S._Born_M U.S._Born_F India_M India_F China_M China_F Other_M Other_F
1 1980  42,500        62.1        23.9     0.2     0.2     1.6     1.7     7.2     3.2
2 1990  89,177        55.1        19.7     1.0     0.4     3.0     3.2    12.1     5.6
3 2000 210,067        45.7        12.1     8.6     2.2     5.8     3.7    16.8     5.1
4 2010 212,055        40.4         8.3    14.8     4.8     7.0     3.5    16.1     5.0
5 2017 340,950        37.0         6.8    18.3     6.0     8.1     3.2    16.4     4.2

URL parameters (short)=
?minyear=1980&geo=NATION&occ=Computer%20software%20developers%20(229)&group=BIRTHPLACE_TECH|SEX_M_F

Percent of Computer Software Developers in California, grouped by CITIZENSHIP and SEX: 1980-2017

Computer software developers (229): 1980-2017, grouped by CTZNSHP and SEX_M_F, STATE=CA (percent)

  Year   Count Non.ctzn_M Non.ctzn_F Naturlzd_M Naturlzd_F U.S._Brn_M U.S._Brn_F
1 1980  42,500        4.3        2.3        4.2        2.4       62.5       24.3
2 1990  89,177        6.9        3.3        8.2        5.5       56.0       20.1
3 2000 210,067       18.5        5.2       11.7        5.6       46.7       12.3
4 2010 212,055       20.2        6.1       16.9        7.0       41.2        8.6
5 2017 340,950       25.9        7.7       15.7        5.4       38.1        7.1

URL parameters (short)=
?minyear=1980&geo=NATION&occ=Computer%20software%20developers%20(229)&group=CTZNSHP|SEX_M_F

Percent of Computer Software Developers in California, grouped by RACE: 1980-2017

Computer software developers (229): 1980-2017, grouped by RACE, STATE=CA (percent)

  Year   Count White Black AmIndian Chinese Japanese OthAsian OthRace TwoRace X3.Races
1 1980  42,500  83.3   3.3      0.5     5.6      3.3      3.8     0.2      NA       NA
2 1990  89,177  74.0   3.9      0.2     9.0      2.7      7.8     2.4      NA       NA
3 2000 210,067  58.7   2.6      0.3    12.3      1.8     19.1     2.0     3.0      0.2
4 2010 212,055  49.5   1.6      0.2    14.8      0.8     29.7     1.7     1.6      0.1
5 2017 340,950  42.3   1.7      0.3    14.8      1.4     33.1     2.7     3.1      0.5

URL parameters (short)=
?minyear=1980&geo=NATION&occ=Computer%20software%20developers%20(229)&group=RACE

Percent of All Workers in California, grouped by RACE: 1980-2017

All (0-999): 1980-2017, grouped by RACE, STATE=CA (percent)

  Year      Count White Black AmIndian Chinese Japanese OthAsian OthRace TwoRace X3.Races
1 1980  6,130,720  86.8   5.9      0.7     1.7      1.6      2.9     0.5      NA       NA
2 1990  8,547,538  77.0   6.0      0.7     2.8      1.5      6.0     6.0      NA       NA
3 2000  9,182,942  68.5   5.8      0.7     3.8      1.3      8.1     8.1     3.5      0.2
4 2010 16,360,737  63.9   5.3      0.6     3.7      0.8      9.9    12.6     2.9      0.2
5 2017 18,867,615  59.3   5.3      0.7     4.2      0.7     10.9    14.9     3.5      0.5

URL parameters (short)=
?minyear=1980&geo=NATION&occ=All%20(0-999)&group=RACE

Percent of Computer Software Developers in California, grouped by HISPAN: 1980-2017

Computer software developers (229): 1980-2017, grouped by HISPAN, STATE=CA (percent)

  Year   Count NotHisp Mexican PuertoRico Cuban Other
1 1980  42,500    94.3     3.1        0.3   0.4   1.9
2 1990  89,177    94.0     3.9        0.2   0.2   1.7
3 2000 210,067    94.7     3.3        0.2   0.1   1.6
4 2010 212,055    94.8     3.7        0.0   0.2   1.2
5 2017 340,950    92.5     4.8        0.2   0.3   2.2

URL parameters (short)=
?minyear=1980&geo=NATION&occ=Computer%20software%20developers%20(229)&group=HISPAN

Percent of All Workers in California, grouped by HISPAN: 1980-2017

All (0-999): 1980-2017, grouped by HISPAN, STATE=CA (percent)

  Year      Count NotHisp Mexican PuertoRico Cuban Other
1 1980  6,130,720    90.5     6.4        0.3   0.3   2.5
2 1990  8,547,538    86.7     9.7        0.4   0.3   3.0
3 2000  9,182,942    83.1    12.4        0.4   0.2   3.9
4 2010 16,360,737    65.4    28.1        0.5   0.3   5.7
5 2017 18,867,615    62.7    30.1        0.6   0.3   6.3

URL parameters (short)=
?minyear=1980&geo=NATION&occ=All%20(0-999)&group=HISPAN

Percent of Computer Software Developers in California, grouped by CITIZENSHIP and SEX: 1990-2017

Computer software developers (229): 1990-2017, grouped by CTZNSHP and EDUC, STATE=CA (percent)

  Year   Count Non.ctzn_Bac- Non.ctzn_Mast Non.ctzn_Phd+ Naturlzd_Bac- Naturlzd_Mast Naturlzd_Phd+ U.S._Brn_Bac- U.S._Brn_Mast U.S._Brn_Phd+
1 1990  89,177           6.8           3.1           0.3          11.0           2.5           0.2          66.1           8.2           1.8
2 2000 210,067          11.9          10.0           1.8          11.4           5.2           0.8          48.4           8.8           1.8
3 2010 212,055          11.5          13.0           1.9          13.8           9.1           1.1          40.7           7.7           1.4
4 2017 340,950          13.5          17.7           2.4          11.1           8.2           1.9          35.7           7.9           1.7

Key: Bac- = Bachelor's Degree or less, Mast = Master's Degree, Phd+ = PhD Degree or more

URL parameters (short)=
?minyear=1990&geo=NATION&occ=Computer%20software%20developers%20(229)&group=CTZNSHP|EDUC&sortn=4

Census Data for Computer Software Developers in California in 2017

Percent of Computer Software Developers in California, grouped by BIRTHPLACE and SEX, sorted by India_Male, 2017

Computer software developers (229): 2017, grouped by BIRTHPLACE_TECH and SEX_M_F, 1000 or more workers (percent)

   Year                    COUNTY  Count U.S._Born_M U.S._Born_F India_M India_F China_M China_F Other_M Other_F
1  2017         Alameda County CA 39,393        24.7         4.9    36.1    11.0    10.3     2.6     8.4     2.0
2  2017     Santa Clara County CA 90,412        21.7         4.4    28.1     9.6    13.0     4.3    16.0     2.7
3  2017       El Dorado County CA  1,205        44.1         6.1    25.0    24.8     0.0     0.0     0.0     0.0
4  2017    Contra Costa County CA 13,197        33.0         6.6    21.4     9.4     5.1     3.5    18.2     2.8
5  2017     San Joaquin County CA  2,148        48.3         2.4    19.6     9.4     2.4     0.0    18.0     0.0
6  2017      Sacramento County CA  9,603        44.6        17.0    19.3     2.9     2.4     0.0    13.2     0.6
7  2017  San Bernardino County CA  4,067        31.9         7.7    16.2     3.8     7.3     9.4    23.9     0.0
8  2017       San Mateo County CA 19,108        29.5         3.4    15.6     4.1     9.3    11.9    18.5     7.7
9  2017          Orange County CA 29,277        40.9         5.8    11.8     2.6     9.1     1.7    21.0     7.1
10 2017         Ventura County CA  3,917        49.9        10.6    11.7     2.8     3.1     0.0    22.0     0.0
11 2017       San Diego County CA 27,569        41.3         7.7    11.1     4.6     3.6     1.5    21.4     8.8
12 2017          Placer County CA  2,372        68.0         2.5    10.8     0.0     5.2     0.0    13.4     0.0
13 2017     Los Angeles County CA 46,009        49.3         8.2    10.0     4.1     6.6     2.4    15.9     3.5
14 2017      Stanislaus County CA  1,075        78.6         4.7     7.8     0.0     0.0     0.0     8.9     0.0
15 2017       Riverside County CA  5,659        57.6         6.7     7.7     3.0     9.2     1.2     7.0     7.6
16 2017            Yolo County CA  1,016        45.1        16.4     7.3     6.3     0.0    10.9    14.0     0.0
17 2017                      (NA)  2,529        46.8        23.8     6.6     0.0     2.5     0.0    14.3     6.0
18 2017   San Francisco County CA 25,559        49.4        12.1     4.1     0.9     4.5     2.8    21.4     4.9
19 2017           Marin County CA  1,579        65.0         0.0     4.1     0.0     0.0     0.0    26.3     4.6
20 2017          Sonoma County CA  2,689        67.8         3.0     2.6     0.0     0.0     0.0    10.2    16.5
21 2017 San Luis Obispo County CA  2,394        85.8         7.6     1.9     0.0     0.0     0.0     4.8     0.0
22 2017          Fresno County CA  1,481        44.8        14.8     0.0     0.0     0.0     0.0    29.2    11.3
23 2017            Kern County CA  1,011        93.7         6.3     0.0     0.0     0.0     0.0     0.0     0.0
24 2017   Santa Barbara County CA  2,208        79.9         9.1     0.0     0.0     0.0     0.0    10.9     0.0
25 2017      Santa Cruz County CA  2,342        64.9         7.6     0.0     0.0     5.6     0.0    10.5    11.3

URL parameters (short)=
?geo=COUNTY&occ=Computer%20software%20developers%20(229)&group=BIRTHPLACE_TECH|SEX_M_F&sortn=6&mincount=1000

Percent of Computer Software Developers in California, grouped by CITIZENSHIP and SEX, sorted by Non.citizen_Male, 2017

Computer software developers (229): 2017, grouped by CTZNSHP and SEX_M_F, 1000 or more workers (percent)

   Year                    COUNTY  Count Non.ctzn_M Non.ctzn_F Naturlzd_M Naturlzd_F U.S._Brn_M U.S._Brn_F
1  2017     Santa Clara County CA 90,412       38.8       10.6       17.6        6.0       22.4        4.5
2  2017         Alameda County CA 39,393       38.5        9.4       16.0        6.1       25.1        4.9
3  2017  San Bernardino County CA  4,067       26.5        6.9       16.5        6.2       36.1        7.7
4  2017       San Mateo County CA 19,108       25.9       16.4       16.2        7.3       30.9        3.4
5  2017       El Dorado County CA  1,205       25.0       24.8        0.0        0.0       44.1        6.1
6  2017      Sacramento County CA  9,603       22.4        1.2       11.4        2.2       45.7       17.0
7  2017     San Joaquin County CA  2,148       21.1        9.4       15.3        0.0       51.9        2.4
8  2017          Orange County CA 29,277       20.0        4.2       20.2        6.6       42.6        6.4
9  2017         Ventura County CA  3,917       18.9        1.6       17.8        1.2       49.9       10.6
10 2017   San Francisco County CA 25,559       18.9        5.4        7.7        2.9       52.8       12.3
11 2017       San Diego County CA 27,569       18.6        6.2       16.2        7.6       42.6        8.9
12 2017     Los Angeles County CA 46,009       17.8        5.2       14.3        4.8       49.7        8.2
13 2017    Contra Costa County CA 13,197       17.5        7.9       27.2        7.9       33.0        6.6
14 2017           Marin County CA  1,579       15.7        4.6       14.6        0.0       65.0        0.0
15 2017            Yolo County CA  1,016       12.1       17.2        9.2        0.0       45.1       16.4
16 2017       Riverside County CA  5,659       12.0        5.7       11.9        2.8       57.6       10.0
17 2017   Santa Barbara County CA  2,208       10.9        0.0        0.0        0.0       79.9        9.1
18 2017          Sonoma County CA  2,689        7.9        0.0        4.8        7.4       67.8       12.0
19 2017      Stanislaus County CA  1,075        7.8        0.0        8.9        0.0       78.6        4.7
20 2017          Placer County CA  2,372        6.6        0.0       16.7        0.0       74.2        2.5
21 2017      Santa Cruz County CA  2,342        4.0        6.5        5.6        4.8       71.4        7.6
22 2017                      (NA)  2,529        3.7        1.6       17.3        4.4       49.2       23.8
23 2017          Fresno County CA  1,481        0.0       11.3       17.4        0.0       56.5       14.8
24 2017            Kern County CA  1,011        0.0        0.0        0.0        0.0       93.7        6.3
25 2017 San Luis Obispo County CA  2,394        0.0        0.0        1.9        0.0       90.6        7.6

URL parameters (short)=
?geo=COUNTY&occ=Computer%20software%20developers%20(229)&group=CTZNSHP|SEX_M_F&sortn=4&mincount=1000

Percent of Computer Software Developers in California, grouped by CITIZENSHIP and SEX, sorted as above, 1990

Computer software developers (229): 1990, grouped by CTZNSHP and SEX_M_F (percent)

   Year                    COUNTY  Count Non.ctzn_M Non.ctzn_F Naturlzd_M Naturlzd_F U.S._Brn_M U.S._Brn_F
12 1990     Santa Clara County CA 12,993        6.9        4.9        8.0        7.9       53.7       18.6
15 1990         Alameda County CA  6,794        4.9        4.5        7.6        3.8       55.4       23.8
16 1990  San Bernardino County CA  1,585        4.4        1.3        8.4        3.9       69.0       12.9
11 1990       San Mateo County CA  2,921        7.2        2.1        7.5        5.5       61.4       16.4
2  1990       El Dorado County CA    169       27.8        0.0        0.0        0.0       46.2       26.0
19 1990      Sacramento County CA  3,260        3.7        4.1        5.6        3.6       59.1       23.8
23 1990     San Joaquin County CA    536        3.0        5.2        0.0        0.0       63.1       28.7
10 1990          Orange County CA  8,328        7.2        3.9        9.4        4.2       55.2       20.2
24 1990         Ventura County CA  2,260        2.7        4.7        3.5        5.2       65.5       18.4
5  1990   San Francisco County CA  3,408        9.9        3.3        8.8        7.3       51.4       19.2
20 1990       San Diego County CA  7,040        3.7        1.1        4.1        3.6       63.7       23.8
6  1990     Los Angeles County CA 25,211        9.9        3.6       11.5        7.7       50.4       16.9
14 1990    Contra Costa County CA  3,834        6.1        2.7       10.8        3.8       54.1       22.5
7  1990           Marin County CA  1,074        9.8        0.0        6.2        2.0       54.5       27.6
13 1990            Yolo County CA    457        6.1        0.0        3.5        0.0       72.6       17.7
18 1990       Riverside County CA  1,789        3.8        2.0        9.6        0.0       60.2       24.4
17 1990   Santa Barbara County CA    883        4.2        0.0        7.9        3.4       68.1       16.4
21 1990          Sonoma County CA    808        3.2        0.0        3.2        2.5       70.2       20.9
34 1990      Stanislaus County CA    435        0.0        0.0        9.0        0.0       52.4       38.6
22 1990          Placer County CA    475        3.2        0.0        5.5        0.0       87.6        3.8
9  1990      Santa Cruz County CA    884        7.4        0.0        0.0        1.2       70.8       20.6
25 1990                      (NA)    538        1.5        0.0        3.3        0.0       57.4       37.7
27 1990          Fresno County CA    469        0.0        0.0        0.0        3.8       70.1       26.0
29 1990            Kern County CA    793        0.0        0.0        0.0        2.3       63.1       34.7
33 1990 San Luis Obispo County CA    310        0.0        0.0        0.0        0.0       58.7       41.3

URL parameters (short)=
?minyear=1990&maxyear=1990&geo=COUNTY&occ=Computer%20software%20developers%20(229)&group=CTZNSHP|SEX_M_F&sortn=4&mincount=0

Percent of Computer Software Developers in California, grouped by CITIZENSHIP and EDUCATION, sorted by Non.citizen_Bachelor, 2017

Computer software developers (229): 2017, grouped by CTZNSHP and EDUC, 1000 or more workers (percent)

   Year                    COUNTY  Count Non.ctzn_Bac- Non.ctzn_Mast Non.ctzn_Phd+ Naturlzd_Bac- Naturlzd_Mast Naturlzd_Phd+ U.S._Brn_Bac- U.S._Brn_Mast U.S._Brn_Phd+
1  2017       El Dorado County CA  1,205          49.8           0.0           0.0           0.0           0.0           0.0          36.6          13.6           0.0
2  2017  San Bernardino County CA  4,067          21.6          11.8           0.0           9.8           4.0           9.0          34.1           8.1           1.6
3  2017         Alameda County CA 39,393          17.8          25.6           4.6          11.6           9.1           1.5          23.7           5.0           1.3
4  2017       San Mateo County CA 19,108          16.0          25.1           1.2          10.6          10.2           2.7          26.8           5.5           1.9
5  2017     Santa Clara County CA 90,412          15.5          29.0           4.9           8.4          12.5           2.7          18.5           6.7           1.7
6  2017   San Francisco County CA 25,559          13.8           9.2           1.3           6.4           3.4           0.8          51.3          10.1           3.7
7  2017       Riverside County CA  5,659          13.6           4.1           0.0           9.9           3.2           1.5          66.3           1.4           0.0
8  2017          Orange County CA 29,277          13.4           9.6           1.2          16.3           7.8           2.7          40.0           8.6           0.3
9  2017     Los Angeles County CA 46,009          13.4           8.0           1.5          13.6           4.9           0.6          46.4           9.9           1.6
10 2017            Yolo County CA  1,016          11.1          18.2           0.0           9.2           0.0           0.0          53.6           7.9           0.0
11 2017       San Diego County CA 27,569           9.8          13.9           1.1          13.1           9.1           1.5          41.0           9.6           0.9
12 2017      Sacramento County CA  9,603           9.1          14.5           0.0          10.3           2.0           1.4          53.4           7.2           2.1
13 2017     San Joaquin County CA  2,148           8.6          21.9           0.0          10.5           2.4           2.4          39.7          14.6           0.0
14 2017         Ventura County CA  3,917           8.2          10.8           1.4          17.6           1.4           0.0          55.0           3.5           2.0
15 2017          Sonoma County CA  2,689           7.9           0.0           0.0          12.3           0.0           0.0          73.9           5.9           0.0
16 2017    Contra Costa County CA 13,197           7.9          17.4           0.0          19.0          12.1           4.0          29.9           8.6           1.2
17 2017      Stanislaus County CA  1,075           7.8           0.0           0.0           8.9           0.0           0.0          38.2          34.8          10.2
18 2017          Placer County CA  2,372           6.6           0.0           0.0          12.2           2.7           1.7          70.2           6.6           0.0
19 2017                      (NA)  2,529           5.3           0.0           0.0          10.2           9.0           2.5          66.7           6.3           0.0
20 2017   Santa Barbara County CA  2,208           5.0           0.0           5.9           0.0           0.0           0.0          66.9          13.9           8.3
21 2017          Fresno County CA  1,481           0.0          11.3           0.0          17.4           0.0           0.0          69.3           2.0           0.0
22 2017            Kern County CA  1,011           0.0           0.0           0.0           0.0           0.0           0.0         100.0           0.0           0.0
23 2017           Marin County CA  1,579           0.0          20.3           0.0          10.6           4.1           0.0          57.1           7.9           0.0
24 2017 San Luis Obispo County CA  2,394           0.0           0.0           0.0           1.9           0.0           0.0          74.6          23.6           0.0
25 2017      Santa Cruz County CA  2,342           0.0          10.5           0.0          10.5           0.0           0.0          36.4          23.0          19.6

Key: Bac- = Bachelor's Degree or less, Mast = Master's Degree, Phd+ = PhD Degree or more

URL parameters (short)=
?geo=COUNTY&occ=Computer%20software%20developers%20(229)&group=CTZNSHP|EDUC&sortn=4&mincount=1000

Percent of Workers Who Are Non-citizens by Occupation in California in 2017, sorted by percent

                                                                        Non-
N                                              Occupation      Total   citizen Percent  Occ1990
-- ------------------------------------------------------ ---------- --------- ------- --------
1                   Farming, Forestry, Fishing, Gardening    576,289   301,375    52.3  Farming
2                            Computer software developers    340,950   114,620    33.6  SWDevel
3                    Operators, Fabricators, and Laborers    623,627   194,662    31.2 Operator
4                                     Construction Trades    603,923   172,706    28.6 Constrct
5          Transportation and Material Moving Occupations  1,422,206   383,528    27.0 Transprt
6                Service Occupations, including Household  3,213,746   689,383    21.5  Service
7                                      Natural Scientists    102,895    19,320    18.8   NatSci
8                        Precision Production Occupations    345,534    64,840    18.8 Productn
9                                 Mechanics and Repairers    494,318    79,906    16.2 Mechanic
10                   Engineers, Architects, and Surveyors    329,152    46,378    14.1 Engineer
11                                      Sales Occupations  1,944,387   218,876    11.3    Sales
12                   Mathematical and Computer Scientists    333,695    37,008    11.1 MathComp
13              Executive, Administrative, and Managerial  2,828,106   248,601     8.8  Manager
14 Administrative Support Occupations, including Clerical  2,366,489   204,460     8.6 AdminSup
15           Social Scientists, Urban Planners, Religious    316,077    24,344     7.7   SocSci
16                          Technologists and Technicians    468,429    35,964     7.7  Technol
17         Teachers, Librarians, Archivists, and Curators  1,132,610    69,518     6.1  Teacher
18               Health Assessment & Treating, Therapists    480,353    26,253     5.5 HlthCare
19                          Health Diagnosing Occupations    163,897     8,804     5.4 HlthDiag
20                                     Lawyers and Judges    160,111     4,406     2.8   Lawyer
21                                   Military Occupations    128,061       557     0.4 Military
-- ------------------------------------------------------ ---------- --------- ------- --------
                                           Total Employed 18,867,615 2,998,858    15.9    Total

Source for Census Data

U.S. Census Data available at IPUMS USA - using the following default sample from each year:

Most Recent Trade Adjustment Assistance (TAA) Data for California

        TAW                                   Company              Location    Decision  Workers  Reasons why you believe that separations that have occurred
0     94381                Qualcomm Technolgies, Inc.         San Diego, CA         NaN     1800  Production of snapdragon chipset which was produced at Qualcomm has been redeployed to India. (snapdragon chipset)
1     94368               Global Cash Card, Inc (ADP)            Irvine, CA         NaN       70  Company notified employees that the company was going to be outsourced to Colombia. (Process pre-paid paid cards)
2     94361                                    Retech             Ukiah, CA         NaN       15  production is being shipped to Poland. (furnaces for metallurgy)
3     94356                           TE Connectivity         Oceanside, CA         NaN      370  Production is being relocated to Mexico facility (Connectors)
4     94339                         TIDI Products LLC           Arcadia, CA         NaN      100  Company established manufacturing facilities in Tijuana, Mexico & has been moving production. Supervisor & our client were asked to go there and train employees.
5     94336                  Caliber Home Loans, Inc.         San Diego, CA         NaN        6  (+24 in TX) The quality assurance department was shifted to India, which reduced the number of remote workers needed in the US.
6     94334              QSC, LLC (Ultra-Stereo Labs)   San Luis Obispo, CA         NaN       12  Workers advised that the production department was moving to Costa Mesa. But some workers heard rumor that production was moving to another country, possibly Mexico.
7     94313                            Insight Global         San Diego, CA         NaN       13  INFO/COMPUTER TECH WORK OUTSOURCED TO FOREIGN THIRD PARTY
8     94310                             Varex Imaging       Santa Clara, CA         NaN       42  Part of the production process for the X-Ray detector that she manufactures will be outsourced to a vendor and that vendor makes the product in China.
9     94305                         HG Communications      Laguna Hills, CA         NaN        3  Dispatch positions were outsourced to India. Company is still in place and get dispatch orders from India.
10    94285                        American Media LLC        Pleasanton, CA         NaN        3  Call center closed and work was transferred to Guatemala.
11    94280                             Paysafe Group  Westlake Village, CA         NaN      105  Over 40 of the positions are positions based in a call center. These positions are being relocated by Paysafe to employees based in Kingston, Jamaica.
12    94270                                 Medtronic       Culver City, CA         NaN       70  Production will be transferred to Vietnam therefore, all employees in the Culver City facility will be laid-off
13    94266                       Ossur North America          Camarilo, CA         NaN       25  Location shifted to Mexico
14    94255                Musco Family Olive Company             Tracy, CA         NaN  (blank)  ITC Investigation Numbers 701-TA-582 and 731-TA-1377 involving Ripe Olives from Spain. The determination was published in the Federal Register on 7/31/2018. 
15    94254         McWane also known as AB&I Foundry           Oakland, CA         NaN  (blank)  ITC Investigation Numbers 701-TA-583 and 731-TA-1381 involving Cast Iron Soil Pipe Fittings from China. Published in the Federal Register on 10/17/2018.
16    94250                    Bell-Carter Foods Inc.           Corning, CA         NaN  (blank)  ITC Investigation Numbers 701-TA-582 and 731-TA-1377 involving Ripe Olives from Spain. The determination was published in the Federal Register on 7/31/2018.
17    94246                                   CWD LLC            Carson, CA   11/1/2018        3  Company closing & plant production & warehouse distribution moving to Juarez, Mexico. In near future, Carson plant will close & all 500 workers will be laid off.
18    94240          Finastra Merchant Services, Inc.     San Francisco, CA  11/30/2018      100  (also in FL) Former employee contacted the DOL requesting assistance due to the claim the jobs were outsourced to the Philippines.
19    94234                              GBG USA Inc.            Vernon, CA         NaN      492  (also in NY) Manufacture of upscale clothing. Additional information or supporting documents attached.
20   94228A                        Volt and Eastridge             Vista, CA   11/1/2018       50  PRODUCTION OUTSOURCED TO MEXICO
21    94228                   Zodiac Pool Systems LLC             Vista, CA   11/1/2018       50  "
22    94226                       The Outsource Group            Irvine, CA         NaN       3+  Production has been shifted to a foreign country
23    94221                      Peak Sports USA Inc.       Los Angeles, CA         NaN        7  The marketing unit of a sporting good distribution center is closed and moved to Quanzhou, China.
24    94212                             Qualcomm Inc.         San Diego, CA         NaN       16  Positions being replaced by employees in multiple locations in India and China. I mentored and trained several new employees in India and China.
25    94211                                       IBM         San Ramon, CA         NaN       75  (also in NY) Services have been outsourced to a foreign country. (Provide sales support of telecom products & servic)
26    94209    Computerized Management Services, Inc.       Simi Valley, CA  10/18/2018       17  Work is being outsourced to ACN in India. Calls are being outsourced to Panama. At least 50 employees have been hired in India.
27    94206                           Sonoco Products         Hollister, CA  10/18/2018      156  Product lines will shift to various Sonoco facilities and also shift to the Sonoco in Mexico City, Mexico. (Consumer product packaging service)
28    94169                    Pioneer Magnetics Inc.      Santa Monica, CA         NaN      100  (blank) manufacture computer mother boards
29    94159              Trinity River Lumber Company       Weaverville, CA         NaN  (blank)  (blank)
30    94158                  Siskiyou Forest Products          Anderson, CA         NaN  (blank)  (blank)
31    94157                 Sierra Pacific Industries            Burney, CA         NaN  (blank)  (blank)
32    94156                 Sierra Pacific Industries            Arcata, CA         NaN  (blank)  (blank)
33    94155                    Sierra Forest Products       Terra Bella, CA         NaN  (blank)  (blank)
34    94154                   Schmidbauer Lumber Inc.            Eureka, CA         NaN  (blank)  (blank)
35    94142                Hewlett Packard Enterprise         Palo Alto, CA   11/1/2018       30  (blank) (also in CO) (support for storage devices)
36    94140                                  Xero INC     San Francisco, CA         NaN        6  (Accounting Software)
37    94124                           Byer California       Los Angeles, CA         NaN        7  Design Department work was outsourced to China. All workers dislocated lay off.
38    94115   ITT Inc. Connect & Control Technologies            Irvine, CA   10/9/2018       10  worker stated she was laid off due to reduction in force - previous layoffs were due to sending the work to China or Nogales, Mexico
39    94114                          Famma Group Inc.       Los Angeles, CA         NaN        6  (blank) (Design patters for clothing)
40    94102                                   HP Inc.         Palo Alto, CA   11/1/2018        1  (possibly 2 more) (R&D moved to Taiwan and Houston)
41    94093                         Kaiam Corporation            Newark, CA   9/12/2018       10  As of 03/30/18, all 10 employees were laid off due to the production line moved to UK.
42    94068                DIRECTV Latin America, LLC        El Segundo, CA   9/12/2018        5  Video Programming tasks were outsourced to Argentina, standard operational procedure training manuals were created and provided to the department in Angentina
43    94067                       Pacific Coast Title            Orange, CA  11/26/2018       10  Please see attached (Trustee Sales Guarantee Policies (TSG)
44    94056     International Business Machines (IBM)          San Jose, CA   9/28/2018        3  Work was being transferred to Mexico and China
45    94049                        C & D Zodiac, Inc.       Santa Maria, CA   11/1/2018        7  Production for cabin interiors may have shifted to Mexico
46    94034                                    Boeing        El Segundo, CA         NaN      300  Production was outsourced to other countries (satellite service)
47    94031                      iQor Holdings US LLC       Simi Valley, CA   9/28/2018      129  (also in FL) per the WARN notice # 20170402and per speaking with 3 employees, the employees stated trained workers from the Philippines to do their jobs.
48   94028A                     Biosense Webster Inc.      Baldwin Park, CA   9/21/2018      100  Production was moved to Mexico (Medical Device inspection)
49    94028                     Biosense Webster Inc.         Irwindale, CA   9/21/2018      150  Production was moved to Mexico (Production of catheters)
50    93993                     Mellanox Technologies     Monterey Park, CA         NaN       50  Company moved to China. Employees were told taxes were too high in the United States. Client stated the company stated they were moving out of the country.
51    93991                           Bank of America          Westlake, CA   9/28/2018        3  Services were outsourced to India. Client tried to become certified but was denied and told to file a new petition at BofA, 31303 Agoura Road Westlake CA 91361.
52    93988                     Kraco Enterprises LLC           Compton, CA    9/4/2018      100  Entire Compton Production was closed and moved to China. Compton facility left as a storage/warehouse location which was eventually disbanded and sold.
53    93980                         Deluxe Media Inc.           Burbank, CA   9/24/2018  (blank)  Company already started moving the jobs in our group (authoring) to Bangalore, India by sending someone to train Bangalore team.
54    93965               Aryzta La Brea Bakery, Inc.            Vernon, CA         NaN      100  The bakery production reduced, and closed distribution center. The production of bread and distribution continues with other employees.
55    93949                       The Collected Group            Vernon, CA    9/6/2018       20  The sample production workers were dislocated because the sample production department work was outsourced to China.
56   93925C        Dimension Data North America, Inc.    Rancho Cordova, CA   8/16/2018        4  THE "TIER 2 TEAM" IS MOVING OUTSIDE OF THE U.S TO INDIA. (IT Managed Services)
57   93925D        Dimension Data North America, Inc.          Valencia, CA   8/16/2018        4  "
58    93912                 Mackie International Inc.         Riverside, CA    7/2/2018       30  The manufacture and production of liquid used for ice popsicles was sent to the Philippines.
59    93907                  Transamerican Auto Parts           Compton, CA   6/26/2018       20  Accounts Payable & accounts receivable have been outsourced to India.
60    93900                  Honeywell Santa Ana Site         Santa Ana, CA    7/5/2018        3  THE WORKER TRAVELED TO MEXICO TO TRAIN THE CUSTOMER SERVICE REPLACEMENTS.
61    93892         Cascade Steel Rolling Mills, Inc.  City of Industry, CA   7/20/2018  (blank)  ITC Investigation involving carbon and certain alloy steel wire rod from Belarus, Italy, Korea, Russe, South Africa, Spain, Turkey, Ukraine, UAE & the UK.
62    93877                     Pavilion Data Systems          San Jose, CA   7/10/2018        9  Entire QA team from US location has been removed. QA team moved to India to do the job.
63    93876                Frank and Adam Apparel LLC  City of Industry, CA   6/26/2018      100  Dress production moved to China
64    93874             Zodiac Electrical Inserts USA  Huntington Beach, CA   6/21/2018       10  Company is moving production line and related services to Thailand. All other supporting functions will be transferred from the US to Thailand and Germany.
65    93866                         LogMeIn USA, Inc.            Goleta, CA   6/14/2018      200  Jobs were outsourced to Teleperformance in Costa Rica.
66    93864                                 Deluxe 3D       Los Angeles, CA         NaN       60  (also in Burbank) The company closed and relocated to Canada (animation, stereo, 3D)
67    93858              Grass Valley, a Belden Brand      Grass Valley, CA    6/8/2018       13  The employees' jobs are being transferred to Canada.
68    93854                            Kiko USA, Inc.       Los Angeles, CA   6/21/2018        6 (+125 in NY) Services are being outsourced and has been shifted to Milano, Italy.
69    93843            Jacobs Engineering Group, Inc.        Long Beach, CA   6/21/2018        3  The supply management department administrative staff work has been outsourced to India.
70    93840                             Ericsson Inc.       Santa Clara, CA    6/6/2018       68  Research and development provided by the groups is being moved to other Ericsson companies outside the United States.
71    93836                       Pacific Coast Title            Orange, CA   6/21/2018        6  Position outsourced to Philippines, company name Savant. (Title research)
72    93835                     New Leaf Biofuel, LLC         San Diego, CA   6/21/2018  (blank)  ITC Investigation Numbers 701-TA-571-572 and 731-TA-1347-1348 involving biodiesel from Argentina and Indonesia. (biodiesel)
73    93834           Imperial Western Products, Inc.         Coachella, CA   6/21/2018  (blank)  "
74    93831            Crimson Renewable Energy, L.P.       Bakersfield, CA   6/21/2018  (blank)  "
75    93830  American Biodiesel, Inc., doing business          Stockton, CA   6/19/2018  (blank)  "
76    93829                  WIE-AGRON Bioenergy, LLC       Watsonville, CA   6/19/2018  (blank)  "
77    93811                    RF Digital Corporation     Hermosa Beach, CA   6/14/2018        8  They hired a new group in China and moved some existing positions to Austria. (Designed and sold wireless modules)
78    93810                           ReviewBuzz Inc.         Oceanside, CA   6/22/2018        5  EMPLOYER SHIFTED WORK TO THE PHILIPPINES (ON LINE REVIEWS)
79    93789                          C&D Zodiac, Inc.      Garden Grove, CA   5/29/2018       13  Company has decided to outsource production line and related services to different foreign countries. (aircraft interiors)
80    93783                           Westhaven, Inc.         Yuba City, CA   6/21/2018       20  Engineering services are being outsourced to India. (solar installation)
81    93772                                     TAMCO  Rancho Cucamonga, CA   5/24/2018  (blank)  ITC Investigation Numbers 701-TA-564 and 731-TA-1338 and 1340 involving steel concrete reinforcing bar from Japan and Turkey.
82    93771         Cascade Steel Rolling Mills, Inc.  City of Industry, CA   5/18/2018  (blank)  "
83    93762                              VMware, Inc.         Palo Alto, CA   5/24/2018      100  Development partner support for several products moved to India. (Computer Software)
84   93742A                            East Bay Times           Antioch, CA   6/12/2018        1  parts of the companies call center ad design functions were outsourced out of the U.S.
85    93742                       Digital First Media          San Jose, CA   6/12/2018       27  "
86   93730A      Allianz Global Corporate & Specialty            Fresno, CA    5/9/2018      40+  U.S. workers were engaged in training workers in India to assume their duties overseas. 
87   93728A            Technicolor Connected Home USA        El Segundo, CA    6/7/2018        4  (+100 in IN) All manufacturing and testing has been outsourced to China. (Manufacture and tested TV cable boxes)
88    93728            Technicolor Connected Home USA        El Segundo, CA    6/7/2018        4  "
89    93721                      Toyo Tire Mexico LLC       Chula Vista, CA   5/18/2018        4  CORPORATE DECIDED TO LAYOFF STAFF AND REHIRE NEW STAFF IN MEXICO CITY. (Sales Operations)
90    93716                             Deco Lighting          Commerce, CA    5/1/2018       80  Manufacture and assembly departments have moved to Mexico. (lighting fixtures)
91    93691                  Johanson Technology Inc.         Camarillo, CA   5/10/2018       25  Certain Departments will be transferred to Tijuana, Mexico (Electronic Capasitors)
92    93690                 Johanson Dielectrics Inc.            Sylmar, CA   5/10/2018      179  Layoffs for this facility have started as of 5/20/2018 till the end of 2018. Facility closing down and moving operations to Tijuana, Mexico
93    93680                               Vixlet, LLC       Los Angeles, CA   5/10/2018       75  The investors were all from other countries and they were unable to continue to invest financially in the company. (Social Media Company)
94    93678                  North Coast Medical Inc.       Morgan Hill, CA    5/3/2018        3  Customer Service Dept. outsourced to Belize (Medical Products)
95    93677                            Semblant, Inc.     Scotts Valley, CA   5/25/2018        3  Scotts Valley and UK offices are being shut down. Production still in process in new location in Shenzhen China. (Nano coding)
96    93673  Qualified Billing and Collections RMC, L       Los Angeles, CA   5/29/2018        6  The lien department services have been outsourced to the Philippines. (Workers compensation)
97    93672                     OSI Electronics, Inc.         Hawthorne, CA         NaN       50  Electronics assembly workers were laid off and all work was outsourced to Mexico and Malaysia.
98    93668          Chemring Energetic Devices, Inc.          Torrance, CA   5/22/2018       30  Work facility will be closed and remaining company work production will be relocated to England and Chicago. (Defense product items)
99    93664                  Transamerican Auto Parts           Compton, CA   4/13/2018       17  The financial accounting department has been transferred to India. All the workers in the financial accounting department have been laid off.
100   93649                                   Genesys         Daly City, CA    5/3/2018      50+  Genesys letter says "due to a change in business operations ...". Techical Writer positions were moved to Chennai, India.
101   93648             Boston Scientific Corporation          Valencia, CA   5/18/2018      289  UI CLAIMANTS REPORTED THAT DEPARTMENT MOVED TO PUERTO RICO (MEDICAL DEVICES-NEUROMODULATION)
102  93647A     Republic Fastener Manufacturing, Inc.      Newbury Park, CA    6/5/2018       18  (also in PA) Arconic Employees were sent to Mexico to train new employees on how to operate the machines and manufacture volts 
103   93647                              Arconic Inc.      Newbury Park, CA    6/5/2018        "  (continued) for the aerospace industry and then were laid off in September 2017. (Manufacture Bolts for Aerospace Industry)
104   93632            Confluent Medical Technologies         Sunnyvale, CA   4/15/2018       64  The majority of production will be moved to Costa Rica. (Medical Device Contract Manufacturer)
105   93611               Parker Hannifin Corporation            Irvine, CA  11/29/2018       20  Production is being shifted to Malaysia. (Aerospace)
106   93590                      Optoplex Corporation           Fremont, CA   4/13/2018       10  Manufacture moved to China, the whole production line was closed down. (Fiber Optics) 
107   93588                           Tridien Medical            Corona, CA   4/17/2018       70  A large portion of the manufacturing processes will be shifted to an existing site in a foreign country. (Medical surfaces)
108   93572          Smurfit Kappa North America, LLC  City of Industry, CA    4/2/2018       65  The company and its production line is being impacted by the foreign trade, and was shifted to Baja Mexico in Tijuana. (Printing company)
109   93557                          Zodiac Aerospace      Garden Grove, CA   3/29/2018       17  Production of airplane parts is being moved to factories belonging to the company in Mexico, Europe and India. (aircraft parts)
110   93540                 CareFusion Resources, LLC         San Diego, CA   3/16/2018        8  Jobs, at least in software quality engineering, are being lost to technical employment agencies in India, Mexico, and maybe elsewhere.
111   93536                            Medtronic, Plc        Santa Rosa, CA   3/15/2018        3  The Santa Rosa Aortic Peripheral Vascular complaint handling in-take work will be consolidated to the CVG site in Galway, Ireland.
112   93532  StandardAero Business Aviation Services,       Los Angeles, CA   8/31/2018       70  Severe & unexpected reductions in services worldwide as the TFE731 engine market declined in the U.S. Operations & equipment is being shipped to U.K. facility.
113  93499A               Zodiac Seats California LLC  Rancho Cucamonga, CA    3/8/2018      150  FINANCE, HR, OPERATIONS, ENGINEERING, SUPPLY CHAIN, PROGRAM MANAGEMENT, QUALITY, MAINTENANCE IS BEING SHIFTED TO CHIHUAHUA MEXICO,
114   93499               Zodiac Seats California LLC  Rancho Cucamonga, CA    3/8/2018        "  (cont) THAT IS A PARTY TO A FREE TRADE AGREEMENT WITH THE UNITED STATES. (AIRPLANE SEATS)
115   93473                           Prolifics, Inc.         Calabasas, CA    3/9/2018       14  Jobs were offshored to India. (IT Servicecs & Solutions)
116   93472           PDM Steel Service Centers, Inc.          Stockton, CA   3/22/2018  (blank)  ITC Investigation Numbers 701-TA-560-561 and 731-TA-1317-1328 involving carbon and alloy steel cut-to-length from Brazil, South Africa, and Turkey.
117   93463          California Psychology Associates    Valley Village, CA   5/17/2018        4  Due to budgetary concerns for in house Medical Transcription Services, company shifted the services and the reporting to the Philippines starting in 2015.
118   93462                           Bank of America       Simi Valley, CA    3/5/2018       10  My department was shifted to country of India (foreclosures, bankruptcies, check issuance, data)
119   93456             Joseph T. Ryerson & Son, Inc.            Vernon, CA   4/20/2018  (blank)  ITC Investigation Numbers 701-TA-560-561 and 731-TA-1317-1328 involving carbon and alloy steel cut-to-length from Brazil, South Africa, and Turkey.

Source: U.S. Department of Labor, Trade Adjustment Assistance (TAA) data

Other Related Data for California

2018-2019 WARN Report (PDF): WARN notices processed from July 1, 2018 through June 10, 2019.
Listing of WARN Notices from previous years

H-1B and Related Data by State
H-1B Data
OPT Data