H-1B and Related Data for Illinois


Certified Labor Condition Application (LCA) Data for Illinois, FY 2019

Top 50 Worksite EMPLOYER_NAMEs and WORKSITE_CITYs, sorted by WORKERS, All Worksites

                              EMPLOYER_NAME2     WORKSITE_CITY WORKERS APPLICATIONS
1                        DELOITTE CONSULTING           CHICAGO    4751          383
2                            UNITED AIRLINES           CHICAGO     487          349
3                             NORTHERN TRUST           CHICAGO     456          411
4                                   DISCOVER        RIVERWOODS     395          395
5                          ERNST & YOUNG U.S           CHICAGO     380          378
6                                     KFORCE      VERNON HILLS     360            6
7                                     KFORCE       BLOOMINGTON     360            6
8                           SKYWEST AIRLINES           CHICAGO     320           32
9                                   WALGREEN         DEERFIELD     311          264
10    STATE FARM MUTUAL AUTOMOBILE INSURANCE       BLOOMINGTON     308          235
11                          UCHICAGO ARGONNE            LEMONT     306           62
12                               CATERPILLAR         MOSSVILLE     293          261
13                         COLLINS AEROSPACE          ROCKFORD     286           56
14                      STATE FARM INSURANCE       BLOOMINGTON     249          217
15                                       DFS        RIVERWOODS     237          192
16                        ALLSTATE INSURANCE        NORTHBROOK     228          224
17      MCKINSEY & COMPANY INC UNITED STATES           CHICAGO     216           28
18                       HEALTH CARE SERVICE           CHICAGO     208          180
19                                    ABBVIE     NORTH CHICAGO     204          187
20                         DISCOVER PRODUCTS        RIVERWOODS     204          186
21                                 WALGREENS         DEERFIELD     202          202
22                               CAPITAL ONE   ROLLING MEADOWS     189          122
23                                STATE FARM       BLOOMINGTON     168          149
24                         DELOITTE & TOUCHE           CHICAGO     161           49
25                     UNIVERSITY OF CHICAGO           CHICAGO     157          157
26                                TRANSUNION           CHICAGO     147          132
27                               CATERPILLAR            PEORIA     147          145
28                                MCDONALD'S           CHICAGO     133          133
29                               CATERPILLAR       EAST PEORIA     126          126
30                                SERVICENOW           CHICAGO     120            6
31                              DELOITTE TAX           CHICAGO     119           35
32                               MORNINGSTAR           CHICAGO     119           67
33                                   EXPEDIA           CHICAGO     118           46
34                     TRIESTEN TECHNOLOGIES   ROLLING MEADOWS     118          118
35           TRANSFORM SR HOLDING MANAGEMENT   HOFFMAN ESTATES     115          115
36                                     DEERE            MOLINE     112          112
37                                 ACCENTURE           CHICAGO     109           78
38                       DELOITTE CONSULTING       SPRINGFIELD     108            8
39                                   EGENCIA           CHICAGO     107            9
40                                  NAVISTAR             LISLE     101          101
41                            ORACLE AMERICA         DEERFIELD     100           10
42                                  US FOODS          ROSEMONT      99           57
43                         DELOITTE & TOUCHE           CHICAGO      97           30
44                         CAPGEMINI AMERICA           CHICAGO      97           62
45           PRICEWATERHOUSECOOPERS ADVISORY           CHICAGO      97           97
46                         HSBC TECHNOLOGY & ARLINGTON HEIGHTS      97           97
47                       DELOITTE CONSULTING            PEORIA      96            9
48         COGNIZANT TECHNOLOGY SOLUTIONS US           CHICAGO      94           94
49                         KRAFT FOODS GROUP           CHICAGO      91           91
50                    UNIVERSITY OF ILLINOIS            URBANA      89           89

Top 50 Worksite EMPLOYER_NAMEs and WORKSITE_CITYs, sorted by WORKERS, Local Worksites Only

                              EMPLOYER_NAME2     WORKSITE_CITY WORKERS APPLICATIONS
1                        DELOITTE CONSULTING           CHICAGO    4749          381
2                          ERNST & YOUNG U.S           CHICAGO     380          378
3                                     KFORCE      VERNON HILLS     360            6
4                                     KFORCE       BLOOMINGTON     360            6
5                           SKYWEST AIRLINES           CHICAGO     320           32
6                           UCHICAGO ARGONNE            LEMONT     306           62
7                                        DFS        RIVERWOODS     231          186
8       MCKINSEY & COMPANY INC UNITED STATES           CHICAGO     216           28
9                          DISCOVER PRODUCTS        RIVERWOODS     204          186
10                         DELOITTE & TOUCHE           CHICAGO     161           49
11                     UNIVERSITY OF CHICAGO           CHICAGO     155          155
12                                SERVICENOW           CHICAGO     120            6
13                              DELOITTE TAX           CHICAGO     119           35
14                               MORNINGSTAR           CHICAGO     119           67
15           TRANSFORM SR HOLDING MANAGEMENT   HOFFMAN ESTATES     113          113
16                                   EXPEDIA           CHICAGO     109           37
17                       DELOITTE CONSULTING       SPRINGFIELD     108            8
18                                   EGENCIA           CHICAGO     107            9
19                                TRANSUNION           CHICAGO     105          105
20                            ORACLE AMERICA         DEERFIELD     100           10
21                                 ACCENTURE           CHICAGO      99           68
22                         DELOITTE & TOUCHE           CHICAGO      97           30
23           PRICEWATERHOUSECOOPERS ADVISORY           CHICAGO      97           97
24                       DELOITTE CONSULTING            PEORIA      96            9
25         COGNIZANT TECHNOLOGY SOLUTIONS US           CHICAGO      94           94
26                         CAPGEMINI AMERICA           CHICAGO      93           58
27                    UNIVERSITY OF ILLINOIS            URBANA      89           89
28                            ORACLE AMERICA           CHICAGO      85            8
29                        DYNAMICS RESOURCES      VERNON HILLS      84           22
30                             CISCO SYSTEMS           CHICAGO      82            9
31         UNIVERSITY OF ILLINOIS AT CHICAGO           CHICAGO      80           80
32                               HCL AMERICA          ROCKFORD      80            4
33                                   BITWISE        SCHAUMBURG      77           77
34                             OATH HOLDINGS         CHAMPAIGN      76           19
35                             AKUNA CAPITAL           CHICAGO      73           51
36                           CCC INFORMATION           CHICAGO      69           69
37                   NORTHWESTERN UNIVERSITY          EVANSTON      68           68
38                         YASH TECHNOLOGIES       EAST MOLINE      68           68
39                                    ABBVIE     NORTH CHICAGO      66           66
40                   NORTHWESTERN UNIVERSITY           CHICAGO      64           64
41                     TRIESTEN TECHNOLOGIES   ROLLING MEADOWS      63           63
42                       DELOITTE CONSULTING        BRIDGEVIEW      60            4
43                       DELOITTE CONSULTING        LAKE BLUFF      59            7
44                   BOSTON CONSULTING GROUP           CHICAGO      57           57
45            RUSH UNIVERSITY MEDICAL CENTER           CHICAGO      57           57
46     COOK COUNTY HEALTH & HOSPITAL SYSTEMS           CHICAGO      57           57
47                        MEDLINE INDUSTRIES        NORTHFIELD      55           54
48                               CATERPILLAR         MOSSVILLE      54           54
49                        HERE NORTH AMERICA           CHICAGO      54           54
50                             ZS ASSOCIATES          EVANSTON      54           54

Top 50 Worksite EMPLOYER_NAMEs and WORKSITE_CITYs, sorted by WORKERS, Remote Worksites Only

                              EMPLOYER_NAME2     WORKSITE_CITY WORKERS APPLICATIONS
1                            UNITED AIRLINES           CHICAGO     474          336
2                             NORTHERN TRUST           CHICAGO     427          382
3                                   DISCOVER        RIVERWOODS     395          395
4                                   WALGREEN         DEERFIELD     309          262
5     STATE FARM MUTUAL AUTOMOBILE INSURANCE       BLOOMINGTON     295          225
6                          COLLINS AEROSPACE          ROCKFORD     286           56
7                       STATE FARM INSURANCE       BLOOMINGTON     249          217
8                                CATERPILLAR         MOSSVILLE     239          207
9                         ALLSTATE INSURANCE        NORTHBROOK     219          215
10                                 WALGREENS         DEERFIELD     202          202
11                       HEALTH CARE SERVICE           CHICAGO     187          159
12                                STATE FARM       BLOOMINGTON     168          149
13                               CAPITAL ONE   ROLLING MEADOWS     155           88
14                                    ABBVIE     NORTH CHICAGO     138          121
15                               CATERPILLAR            PEORIA     133          131
16                                MCDONALD'S           CHICAGO     128          128
17                               CATERPILLAR       EAST PEORIA     125          125
18                                     DEERE            MOLINE     100          100
19                                  US FOODS          ROSEMONT      99           57
20                         HSBC TECHNOLOGY & ARLINGTON HEIGHTS      97           97
21                         KRAFT FOODS GROUP           CHICAGO      91           91
22                                  NAVISTAR             LISLE      82           82
23                               WELLS FARGO           CHICAGO      82            7
24                             CNA FINANCIAL           CHICAGO      81           81
25                                       TTX           CHICAGO      79           41
26                       SYNCHRONY FINANCIAL           CHICAGO      73           34
27                                    ABBVIE      VERNON HILLS      69           61
28                            XPO ENTERPRISE           CHICAGO      69           69
29                                     MOLEX             LISLE      67           11
30                                       BGE             NILES      65            2
31           ULTA SALON COSMETICS& FRAGRANCE       BOLINGBROOK      64           64
32                                CVS HEALTH     BUFFALO GROVE      64           64
33                         DISCOVER FINANCAL        RIVERWOODS      62           62
34                                    EXELON           CHICAGO      58           16
35                     TRIESTEN TECHNOLOGIES   ROLLING MEADOWS      55           55
36                                JOHN DEERE            MOLINE      54           54
37                       NORTHERN TRUST BANK           CHICAGO      52           47
38                       ABBOTT LABORATORIES       ABBOTT PARK      51           28
39                       ABBOTT LABORATORIES          WAUKEGAN      48           48
40                          WORKING REMOTELY        SCHAUMBURG      48           48
41                 ZURICH AMERICAN INSURANCE        SCHAUMBURG      47           47
42                                   KELLOGG         OAK BROOK      46           23
43                               CATERPILLAR           DECATUR      45           45
44                                    ABBVIE           METTAWA      45           45
45                           AKSHAR PLASTICS       BLOOMINGTON      45           45
46                  INNOVIZANT DBA R DIGITAL     DOWNERS GROVE      45            4
47                      WELLS FARGO BANK N.A           CHICAGO      45            3
48                                   ANIXTER          GLENVIEW      44           10
49                        ZEBRA TECHNOLOGIES      LINCOLNSHIRE      44           40
50                           PEKIN INSURANCE             PEKIN      43           20
Note: Remote Worksites denote when workers will be placed at a secondary location.
      In this case, field SECONDARY ENTITY is set to Y as explained in this File Structure file and
      EMPLOYER_NAME2 above will be set to the contents of field SECONDARY ENTITY BUSINESS NAME.
      Local Worksites denote when workers will NOT be placed at a secondary location.
Source: OFLC Performance Data (click Disclosure Data tab and go to section
        "Latest Quarterly Updates"), 2019

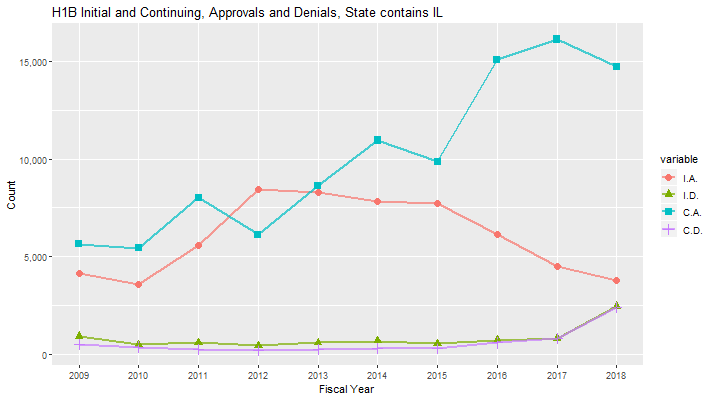
Labor Condition Application (LCA) Data for Illinois, FY 2015-2018

YEAR CASE_STATUS WORKERS APPLICATIONS
2015   CERTIFIED   66813        29529
2016   CERTIFIED   69104        31270
2017   CERTIFIED   52915        28461
2018   CERTIFIED   55191        28393

Labor Condition Application (LCA) Data for Illinois, FY 2018

Grouped by CASE_STATUS

  CASE_STATUS WORKERS APPLICATIONS
1   CERTIFIED   55191        28393
2 CERT-WITHDR    2472         2258
3   WITHDRAWN    1195          955
4      DENIED     600          353

Grouped by VISA_CLASS

       VISA_CLASS WORKERS APPLICATIONS
1            H-1B   58880        31506
2  E-3 Australian     463          374
3 H-1B1 Singapore     100           64
4     H-1B1 Chile      15           15

Top 50 EMPLOYER_NAMEs, sorted by WORKERS

                               EMPLOYER_NAME WORKERS APPLICATIONS
1                     ERNST & YOUNG U.S. LLP    8742          437
2                    DELOITTE CONSULTING LLP    5444         1093
3                      CAPGEMINI AMERICA INC    2143         1124
4   COGNIZANT TECHNOLOGY SOLUTIONS U.S. CORP    1915          113
5                          HCL AMERICA, INC.    1665           99
6          TATA CONSULTANCY SERVICES LIMITED    1545          933
7     COGNIZANT TECHNOLOGY SOLUTIONS US CORP     909          793
8                                KFORCE INC.     850           55
9                            INFOSYS LIMITED     773          773
10                             ACCENTURE LLP     651          530
11                        A.T. KEARNEY, INC.     602           14
12                       MPHASIS CORPORATION     567           28
13  PRICEWATERHOUSECOOPERS ADVISORY SERVICES     476          263
14                             BIRLASOFT INC     455           25
15                              CYIENT, INC.     451           43
16                     DELOITTE & TOUCHE LLP     426          142
17                             WIPRO LIMITED     327          241
18                               EGENCIA LLC     321           13
19                     UCHICAGO ARGONNE, LLC     310           62
20                  CSC COVANSYS CORPORATION     300           30
21                PRICEWATERHOUSECOOPERS LLP     288           96
22               HEXAWARE TECHNOLOGIES, INC.     265          151
23  MASTECH DIGITAL TECHNOLOGIES, INC., A MA     264           44
24                          DELOITTE TAX LLP     255           85
25                 THE UNIVERSITY OF CHICAGO     251          251
26             COMPUTER SCIENCES CORPORATION     240           24
27                   NORTHWESTERN UNIVERSITY     239          239
28                                  KPMG LLP     232          100
29                    DISCOVER PRODUCTS INC.     227          227
30         TELECOM TECHNOLOGY SERVICES, INC.     225            9
31                           IBM CORPORATION     223          223
32                   YASH TECHNOLOGIES, INC.     222          222
33                          GLOBALLOGIC,INC.     217          217
34    MCKINSEY & COMPANY, INC. UNITED STATES     201           31
35                              BITWISE INC.     190          155
36                    UNIVERSITY OF ILLINOIS     187          186
37                             EXPEDIA, INC.     186           39
38                               AIM BIG INC     185           93
39                       ORACLE AMERICA, INC     184           22
40                               CYIENT, INC     181           13
41                  GEOMETRIC AMERICAS, INC.     180            9
42                   RAISER TECHNOLOGIES INC     177          177
43           L&T TECHNOLOGY SERVICES LIMITED     174          174
44                  HTC GLOBAL SERVICES INC.     172          172
45     SEARS HOLDINGS MANAGEMENT CORPORATION     160          145
46         UNIVERSITY OF ILLINOIS AT CHICAGO     156          156
47                         DAZ SYSTEMS, INC.     150            3
48            COMPUNNEL SOFTWARE GROUP, INC.     143          139
49                  DYNAMICS RESOURCES, INC.     141           17
50                DFS CORPORATE SERVICES LLC     137          137

Top 30 SOC_NAMEs, sorted by WORKERS

                                    SOC_NAME WORKERS APPLICATIONS
1          SOFTWARE DEVELOPERS, APPLICATIONS   13298         9424
2                  COMPUTER SYSTEMS ANALYSTS    7691         3320
3            COMPUTER OCCUPATIONS, ALL OTHER    5218         2790
4                       COMPUTER PROGRAMMERS    3463         1989
5                        MANAGEMENT ANALYSTS    3384          924
6               OPERATIONS RESEARCH ANALYSTS    2996          890
7                   ACCOUNTANTS AND AUDITORS    2585          584
8      SOFTWARE DEVELOPERS, SYSTEMS SOFTWARE    1862         1067
9                   COMPUTER SYSTEMS ANALYST    1810          939
10                        FINANCIAL ANALYSTS    1167          494
11          FINANCIAL SPECIALISTS, ALL OTHER    1026          178
12                   DATABASE ADMINISTRATORS     916          541
13                      MECHANICAL ENGINEERS     856          567
14                             STATISTICIANS     802          469
15  COMPUTER AND INFORMATION SYSTEMS MANAGER     762          388
16  NETWORK AND COMPUTER SYSTEMS ADMINISTRAT     671          484
17             INFORMATION SECURITY ANALYSTS     583          207
18                      ELECTRICAL ENGINEERS     579          328
19  MARKET RESEARCH ANALYSTS AND MARKETING S     569          356
20                                 ACTUARIES     468           74
21    ELECTRONICS ENGINEERS, EXCEPT COMPUTER     460          108
22                      INDUSTRIAL ENGINEERS     406          279
23                       PHYSICAL THERAPISTS     389          162
24                              LOGISTICIANS     368           95
25        PHYSICIANS AND SURGEONS, ALL OTHER     339          309
26               COMPUTER NETWORK ARCHITECTS     324          125
27                            WEB DEVELOPERS     255          184
28                      ENGINEERS, ALL OTHER     253          222
29                           SALES ENGINEERS     194          105
30                   COMPUTER SYSTEM ANALYST     190           19

Note: SOC_NAME is the occupational name associated with the SOC_CODE.
      SOC_CODE is the occupational code associated with the job being
      requested for temporary labor condition, as classified by the
      Standard Occupational Classification (SOC) System.

Top 30 WORKSITE_CITYs, sorted by WORKERS

             WORKSITE_CITY WORKERS APPLICATIONS
1                  CHICAGO   32445        12898
2                DEERFIELD    1735         1291
3              BLOOMINGTON    1697         1123
4               SCHAUMBURG    1594         1198
5               RIVERWOODS    1394         1005
6                MOSSVILLE    1125          360
7               NAPERVILLE    1068          777
8                OAK BROOK     919          631
9               NORTHBROOK     720          633
10                   LISLE     643          457
11            LINCOLNSHIRE     632          331
12           DOWNERS GROVE     625          337
13         HOFFMAN ESTATES     579          508
14                  PEORIA     575          404
15         ROLLING MEADOWS     525          388
16            VERNON HILLS     506          234
17                ROSEMONT     499          269
18       ARLINGTON HEIGHTS     476          392
19             LAKE FOREST     466          358
20                EVANSTON     409          304
21             SPRINGFIELD     388          259
22                  AURORA     363          337
23           NORTH CHICAGO     338          303
24                  MOLINE     326          207
25           BUFFALO GROVE     323          310
26                  LEMONT     321           73
27                ROCKFORD     312          164
28               CHAMPAIGN     297          228
29                 LOMBARD     281          205
30             EAST PEORIA     272          197
Source: OFLC Performance Data (click Disclosure Data tab and go to section
        "LCA Programs (H-1B, H-1B1, E-3)"), 2015, 2016, 2017, and 2018

H1B Approval data for Illinois, 2009-2018

H-1B Approval Data for Illinois, FY 2009-2018

   FYear Records I.A. I.D.  C.A. C.D. Workers I.A.R C.A.R T.A.R
1   2009    2940 4149  911  5644  487    9793  82.0  92.1  87.5
2   2010    2523 3576  471  5438  363    9014  88.4  93.7  91.5
3   2011    2846 5576  570  8012  242   13588  90.7  97.1  94.4
4   2012    2449 8457  426  6107  194   14564  95.2  96.9  95.9
5   2013    2680 8275  572  8625  254   16900  93.5  97.1  95.3
6   2014    2550 7823  661 10955  287   18778  92.2  97.4  95.2
7   2015    2255 7705  535  9852  281   17557  93.5  97.2  95.6
8   2016    2591 6156  704 15098  569   21254  89.7  96.4  94.3
9   2017    2428 4466  813 16132  788   20598  84.6  95.3  92.8
10  2018    2535 3779 2442 14738 2391   18517  60.7  86.0  79.3

Key: I.A. = Initial Approval, I.D. = Initial Denial, C.A. = Continuing Approval, C.D. = Continuing Denial,
     I.A.R. = Initial Approval Rate, C.A.R. = Continuing Approval Rate, T.A.R. = Total Approval Rate

H-1B Approval Data for Illinois, FY 2018

Top 50 Employers, sorted by Workers (Initial Approvals plus Continuing Approvals)

  FYear Records I.A. I.D.  C.A. C.D. Workers I.A.R C.A.R T.A.R
1  2018    2535 3779 2442 14738 2391   18517  60.7    86  79.3

                              Employer Records I.A. I.D. C.A. C.D. Workers I.A.R C.A.R T.A.R
1                        ACCENTURE LLP      17  366  162 2694  452    3060  69.3  85.6  83.3
2                CAPGEMINI AMERICA INC      20  273 1067 2676  920    2949  20.4  74.4  59.7
3                  JPMORGAN CHASE & CO       6  324    8 1879   54    2203  97.6  97.2  97.3
4                    ZS ASSOCIATES INC       3   23   79  187   33     210  22.5  85.0  65.2
5     UNIV OF CHICAGO BOOTH SCHOOL BUS       1  120    2   61    1     181  98.4  98.4  98.4
6                DISCOVER PRODUCTS INC       6   39    1  133    1     172  97.5  99.3  98.9
7              ZENSAR TECHNOLOGIES INC       3    7    2  151   18     158  77.8  89.3  88.8
8                         SYNAPSIS INC       2    9   14  134   30     143  39.1  81.7  76.5
9                YASH TECHNOLOGIES INC       1   12   36  125   74     137  25.0  62.8  55.5
10             NORTHWESTERN UNIVERSITY       3   73    0   62    0     135 100.0 100.0 100.0
11                     CATERPILLAR INC       3   41    3   92    0     133  93.2 100.0  97.8
12                      TRANSUNION LLC       2   14    0  117    2     131 100.0  98.3  98.5
13  UNIV OF ILLINOIS AT URBANA CHAMPAI       1   61    1   65    1     126  98.4  98.5  98.4
14                          ABBVIE INC       2   45    3   76    6     121  93.8  92.7  93.1
15                         GROUPON INC       2   29    1   92    0     121  96.7 100.0  99.2
16         UNIV OF ILLINOIS AT CHICAGO       1   57    0   60    1     117 100.0  98.4  99.2
17                 LEAD IT CORPORATION       1    9    2   83   24      92  81.8  77.6  78.0
18        DFS CORPORATION SERVICES LLC       1    5    0   85    1      90 100.0  98.8  98.9
19      SEARS HOLDINGS MANAGEMENT CORP       2    7    0   69    1      76 100.0  98.6  98.7
20                         BITWISE INC       3    4   51   69   18      73   7.3  79.3  51.4
21                  EGEN SOLUTIONS INC       2   29    3   43    7      72  90.6  86.0  87.8
22              HERE NORTH AMERICA LLC       2   18    0   51    0      69 100.0 100.0 100.0
23                 ABBOTT LABORATORIES       5   17    0   51    4      68 100.0  92.7  94.4
24                  ASPIRE SYSTEMS INC       2    5   12   63    6      68  29.4  91.3  79.1
25                         BDO USA LLP       1    9    0   56    4      65 100.0  93.3  94.2
26                       AXISCADES INC       1   15    1   48    0      63  93.8 100.0  98.4
27                         CITADEL LLC       2   17    2   46    1      63  89.5  97.9  95.5
28           FRONTIER TECHNOLOGIES LLC       1    2    0   60   13      62 100.0  82.2  82.7
29                     MORNINGSTAR INC       1   26    0   34    0      60 100.0 100.0 100.0
30                UCHICAGO ARGONNE LLC       1   27    0   33    1      60 100.0  97.1  98.4
31        CCC INFORMATION SERVICES INC       1   21    0   38    2      59 100.0  95.0  96.7
32  AIM BIG INC DBA AXIOM TECH GRP INC       1    1    4   54    8      55  20.0  87.1  82.1
33                           MOLEX LLC       2    9    0   46    0      55 100.0 100.0 100.0
34                  GRANT THORNTON LLP       2   10    0   41    5      51 100.0  89.1  91.1
35                          RSM US LLP       2    7    0   41    0      48 100.0 100.0 100.0
36     CHICAGO MERCANTILE EXCHANGE INC       1    5    0   41    1      46 100.0  97.6  97.9
37                       DEERE COMPANY       1    6    0   36    1      42 100.0  97.3  97.7
38                        MU SIGMA INC       1    4    2   38    5      42  66.7  88.4  85.7
39                ALIGHT SOLUTIONS LLC       1    6    0   34    1      40 100.0  97.1  97.6
40  JOHN H STROGER JR HOSP OF COOK COU       1   24    0   16    0      40 100.0 100.0 100.0
41      ST JUDE MEDICAL CARDIOLOGY DIV       2    8    0   32    0      40 100.0 100.0 100.0
42                         INDSOFT INC       1    3    0   36    5      39 100.0  87.8  88.6
43                         SIRITEK INC       1    3    2   36    7      39  60.0  83.7  81.2
44       HURON CONSULTING SERVICES LLC       1    2    0   36    3      38 100.0  92.3  92.7
45           SELECT REHABILITATION INC       1    7    1   31    1      38  87.5  96.9  95.0
46     CITADEL SECURITIES AMERICAS LLC       1   14    0   22    0      36 100.0 100.0 100.0
47  PRESENCE CHICAGO HOSPITALS NETWORK       4   24    0   12    0      36 100.0 100.0 100.0
48  AKORN INC DBA AKORN PHARMACEUTICAL       1    9    0   25    0      34 100.0 100.0 100.0
49      APPLICATIONS SOFTWARE TECH LLC       1    1    1   33    3      34  50.0  91.7  89.5
50                          APTUDE INC       1    3    2   31    3      34  60.0  91.2  87.2

Key: I.A. = Initial Approval, I.D. = Initial Denial, C.A. = Continuing Approval, C.D. = Continuing Denial,
     I.A.R. = Initial Approval Rate, C.A.R. = Continuing Approval Rate, T.A.R. = Total Approval Rate
Source: H-1B Employer Data Hub Files, U.S. Citizenship and Immigration Services

Illinois Schools Among the Top 100 by Total Number of Students Participating in Optional Practical Training (OPT), 2017

Illinois Schools Among the Top 100 by Total Number of Students Participating in Optional Practical Training (OPT), 2017

N                            School Name State Students
-- ------------------------------------- ----- --------
12                University of Illinois    IL     3063
17      Illinois Institute of Technology    IL     2678
42     University of Illinois at Chicago    IL     1751
45               Northwestern University    IL     1712
61 University of Illinois at Springfield    IL     1337
78             The University of Chicago    IL     1061
-- ------------------------------------- ----- --------
                          Total Students    IL    11602

Sources: U.S. Immigration and Customs Enforcement,
         2017 Top 100 Schools by Total Number of Students Participating in OPT

Illinois Schools Among Top 427 Employers for Optional Practical Training (OPT) Students, 2017

Illinois Schools Among Top 427 Employers for Optional Practical Training (OPT) plus Curricular Practical Training (CPT) Students, 2017

N                            Employer Pre&Post  STEM   CPT Total
--- --------------------------------- -------- ----- ----- -----
44            Northwestern University      192   147    58   397
79  University of Illinois at Chicago      221    40     0   261
177  Illinois Institute of Technology      122     0     0   122
--- --------------------------------- -------- ----- ----- -----
                       Total Students      535   187    58   780

Sources: U.S. Immigration and Customs Enforcement,
         2017 Top 200 Employers for Pre- and Post-Completion OPT Students,
         2017 Top 200 Employers for STEM OPT Students,
         2017 Top 200 Employers for CPT Students

Non-citizen Software Developers in Illinois, 2017

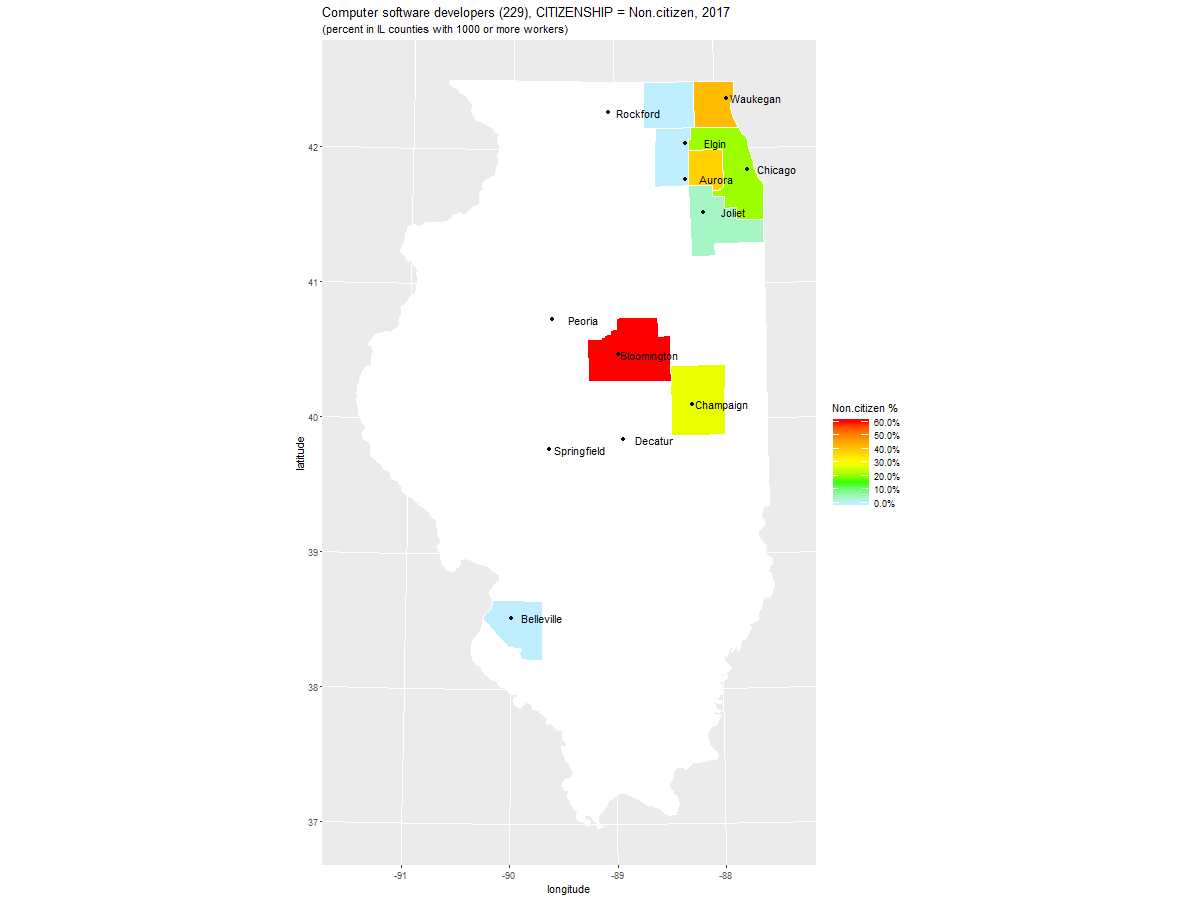
Census Data for Computer Software Developers in Illinois in 1980-2017

Percent of Computer Software Developers in Illinois, grouped by BIRTHPLACE and SEX: 1980-2017

Computer software developers (229): 1980-2017, grouped by BIRTHPLACE_TECH and SEX_M_F, STATE=IL (percent)

  Year  Count U.S._Born_M U.S._Born_F India_M India_F China_M China_F Other_M Other_F
1 1980 17,840        61.3        28.9     0.9     0.4     1.0     0.8     5.2     1.5
2 1990 33,789        59.3        28.3     1.7     0.3     0.8     1.0     6.2     2.5
3 2000 66,212        53.2        19.1     7.3     2.0     2.5     2.4     9.5     4.0
4 2010 50,545        53.2        12.4    11.8     4.9     3.2     2.8     9.5     2.3
5 2017 66,867        50.7         9.5    19.4     4.5     4.1     1.0     8.9     2.0

URL parameters (short)=
?minyear=1980&STATE=IL&geo=NATION&occ=Computer%20software%20developers%20(229)&group=BIRTHPLACE_TECH|SEX_M_F

Percent of Computer Software Developers in Illinois, grouped by CITIZENSHIP and SEX: 1980-2017

Computer software developers (229): 1980-2017, grouped by CTZNSHP and SEX_M_F, STATE=IL (percent)

  Year  Count Non.ctzn_M Non.ctzn_F Naturlzd_M Naturlzd_F U.S._Brn_M U.S._Brn_F
1 1980 17,840        3.3        1.1        3.1        1.5       62.0       29.0
2 1990 33,789        3.5        1.4        4.5        2.1       59.9       28.6
3 2000 66,212       12.7        4.5        6.4        3.8       53.5       19.2
4 2010 50,545       12.5        5.4       10.9        4.6       54.3       12.4
5 2017 66,867       20.4        3.3       11.9        3.9       50.8        9.8

URL parameters (short)=
?minyear=1980&STATE=IL&geo=NATION&occ=Computer%20software%20developers%20(229)&group=CTZNSHP|SEX_M_F

Percent of Computer Software Developers in Illinois, grouped by RACE: 1980-2017

Computer software developers (229): 1980-2017, grouped by RACE, STATE=IL (percent)

  Year  Count White Black AmIndian Chinese Japanese OthAsian OthRace TwoRace X3.Races
1 1980 17,840  86.5   8.4      0.1     2.1      0.2      2.2     0.3      NA       NA
2 1990 33,789  84.4   7.4      0.1     2.5      0.3      3.9     1.3      NA       NA
3 2000 66,212  73.0   5.9      0.1     5.5      0.3     12.7     1.4     1.3       NA
4 2010 50,545  62.7   4.5      0.1     7.4       NA     21.0     1.4     2.7      0.3
5 2017 66,867  61.4   2.3       NA     5.4      0.1     26.5     0.6     3.6      0.1

URL parameters (short)=
?minyear=1980&STATE=IL&geo=NATION&occ=Computer%20software%20developers%20(229)&group=RACE

Percent of All Workers in Illinois, grouped by RACE: 1980-2017

All (0-999): 1980-2017, grouped by RACE, STATE=IL (percent)

  Year     Count White Black AmIndian Chinese Japanese OthAsian OthRace TwoRace X3.Races
1 1980 2,745,020  88.1   9.5      0.1     0.3      0.2      1.5     0.2      NA       NA
2 1990 3,233,286  84.7  10.4      0.2     0.5      0.3      2.2     1.8      NA       NA
3 2000 3,568,454  80.9  10.6      0.2     0.8      0.2      3.3     2.6     1.3      0.1
4 2010 5,925,231  76.9  11.0      0.2     1.0      0.1      3.9     5.7     1.1      0.1
5 2017 6,268,573  74.1  11.6      0.2     1.0      0.1      4.7     6.3     1.8      0.2

URL parameters (short)=
?minyear=1980&STATE=IL&geo=NATION&occ=All%20(0-999)&group=RACE

Percent of Computer Software Developers in Illinois, grouped by HISPAN: 1980-2017

Computer software developers (229): 1980-2017, grouped by HISPAN, STATE=IL (percent)

  Year  Count NotHisp Mexican PuertoRico Cuban Other
1 1980 17,840    97.9     1.2        0.3   0.1   0.4
2 1990 33,789    96.6     1.5        0.5   0.5   0.9
3 2000 66,212    97.1     1.5        0.5   0.1   0.8
4 2010 50,545    94.4     3.2        0.5   0.3   1.6
5 2017 66,867    94.2     3.7        0.9   0.1   1.0

URL parameters (short)=
?minyear=1980&STATE=IL&geo=NATION&occ=Computer%20software%20developers%20(229)&group=HISPAN

Percent of All Workers in Colorado, grouped by HISPAN: 1980-2017

All (0-999): 1980-2017, grouped by HISPAN, STATE=IL (percent)

  Year     Count NotHisp Mexican PuertoRico Cuban Other
1 1980 2,745,020    97.3     1.4        0.5   0.2   0.5
2 1990 3,233,286    96.0     2.3        0.8   0.2   0.8
3 2000 3,568,454    93.9     4.0        0.9   0.2   1.0
4 2010 5,925,231    85.6    11.6        1.3   0.2   1.4
5 2017 6,268,573    83.3    13.2        1.4   0.2   1.8

URL parameters (short)=
?minyear=1980&STATE=IL&geo=NATION&occ=All%20(0-999)&group=HISPAN

Percent of Computer Software Developers in Illinois, grouped by CITIZENSHIP and SEX: 1990-2017

Computer software developers (229): 1990-2017, grouped by CTZNSHP and EDUC, STATE=IL (percent)

  Year  Count Non.ctzn_Bac. Non.ctzn_Mast Non.ctzn_Phd. Naturlzd_Bac. Naturlzd_Mast Naturlzd_Phd. U.S._Brn_Bac. U.S._Brn_Mast U.S._Brn_Phd.
1 1990 33,789           2.9           1.9           0.1           5.5           0.9           0.2          80.1           7.8           0.6
2 2000 66,212           8.9           7.3           0.9           6.2           3.4           0.6          62.0           9.5           1.2
3 2010 50,545           8.3           8.9           0.6           8.4           6.5           0.6          54.0          10.4           2.3
4 2017 66,867          11.3          11.1           1.2           9.3           5.3           1.2          48.8           9.9           1.9

URL parameters (short)=
?minyear=1990&STATE=IL&geo=NATION&occ=Computer%20software%20developers%20(229)&group=CTZNSHP|EDUC

Census Data for Computer Software Developers in Illinois in 2017

Percent of Computer Software Developers in Illinois, grouped by BIRTHPLACE and SEX, sorted by India_Male, 2017

Computer software developers (229): 2017, grouped by BIRTHPLACE_TECH and SEX_M_F, 1000 or more workers (percent)

   Year              COUNTY  Count U.S._Born_M U.S._Born_F India_M India_F China_M China_F Other_M Other_F
1  2017    McLean County IL  2,872        25.9         8.8    55.3    10.0     0.0     0.0     0.0     0.0
2  2017      Lake County IL  6,757        30.9         4.5    35.9     4.6     5.8     0.0    12.6     5.8
3  2017    DuPage County IL  9,767        38.6         5.4    31.4     6.9     2.7     1.5    11.3     2.2
4  2017      Will County IL  3,733        31.4        12.9    20.0    14.0     9.5     2.7     5.2     4.3
5  2017      Cook County IL 28,419        52.8        10.0    14.9     3.9     3.6     1.1    12.1     1.5
6  2017   McHenry County IL  1,590        53.6        23.6    10.6     0.0     0.0     0.0     7.9     4.4
7  2017                (NA)  3,781        78.0        12.8     9.2     0.0     0.0     0.0     0.0     0.0
8  2017      Kane County IL  2,657        90.6         3.9     2.8     0.0     0.0     0.0     2.7     0.0
9  2017 Champaign County IL  2,428        72.0         0.0     2.7     0.0    20.6     0.0     4.7     0.0
10 2017 St. Clair County IL  1,372        79.7        20.3     0.0     0.0     0.0     0.0     0.0     0.0

URL parameters (short)=
?STATE=IL&geo=COUNTY&occ=Computer%20software%20developers%20(229)&group=BIRTHPLACE_TECH|SEX_M_F&sortn=6&mincount=1000

Percent of Computer Software Developers in Illinois, grouped by CITIZENSHIP and SEX, sorted by Non.citizen_Male, 2017

Computer software developers (229): 2017, grouped by CTZNSHP and SEX_M_F, 1000 or more workers (percent)

   Year              COUNTY  Count Non.ctzn_M Non.ctzn_F Naturlzd_M Naturlzd_F U.S._Brn_M U.S._Brn_F
1  2017    McLean County IL  2,872       50.7       10.0        4.6        0.0       25.9        8.8
2  2017      Lake County IL  6,757       37.4        4.6       17.0        5.8       30.9        4.5
3  2017    DuPage County IL  9,767       31.5        6.6       13.9        4.0       38.6        5.4
4  2017 Champaign County IL  2,428       28.0        0.0        0.0        0.0       72.0        0.0
5  2017      Cook County IL 28,419       18.6        2.9       11.9        2.9       53.0       10.7
6  2017      Will County IL  3,733        4.6        0.0       30.2       21.0       31.4       12.9
7  2017                (NA)  3,781        0.6        0.0        8.6        0.0       78.0       12.8
8  2017      Kane County IL  2,657        0.0        0.0        5.5        0.0       90.6        3.9
9  2017   McHenry County IL  1,590        0.0        0.0       18.4        4.4       53.6       23.6
10 2017 St. Clair County IL  1,372        0.0        0.0        0.0        0.0       79.7       20.3

URL parameters (short)=
?STATE=IL&geo=COUNTY&occ=Computer%20software%20developers%20(229)&group=CTZNSHP|SEX_M_F&sortn=4&mincount=1000

Percent of Computer Software Developers in Illinois, grouped by CITIZENSHIP and SEX, sorted as above, 1990

Computer software developers (229): 1990, grouped by CTZNSHP and SEX_M_F (percent)

   Year                COUNTY  Count Non.ctzn_M Non.ctzn_F Naturlzd_M Naturlzd_F U.S._Brn_M U.S._Brn_F
5  1990      McLean County IL    930        4.2        0.0        0.0        0.0       61.3       34.5
9  1990        Lake County IL  1,398        0.0        0.0        2.6        0.9       60.1       36.5
2  1990      DuPage County IL  5,121        5.8        1.2        2.3        1.9       59.5       29.2
4  1990   Champaign County IL  1,227        5.1        0.0        4.4        1.7       74.1       14.7
6  1990        Cook County IL 16,026        4.0        2.5        7.3        3.0       56.9       26.4
   1990        Will County IL  (missing)
7  1990                  (NA)  3,660        0.6        0.4        2.2        0.9       62.5       33.4
1  1990        Kane County IL  1,023        6.2        0.0        0.0        1.5       63.9       28.4
12 1990     McHenry County IL    672        0.0        0.0        0.0        0.0       63.8       36.2
15 1990   St. Clair County IL    633        0.0        0.0        4.3        3.3       64.0       28.4

URL parameters (short)=
?minyear=1990&maxyear=1990&STATE=IL&geo=COUNTY&occ=Computer%20software%20developers%20(229)&group=CTZNSHP|SEX_M_F&sortn=4&mincount=0

Percent of Computer Software Developers in Illinois, grouped by CITIZENSHIP and EDUCATION, sorted by Non.citizen_Bachelor, 2017

Computer software developers (229): 2017, grouped by CTZNSHP and EDUC, 1000 or more workers (percent)

   Year              COUNTY  Count Non.ctzn_Bac. Non.ctzn_Mast Non.ctzn_Phd. Naturlzd_Bac. Naturlzd_Mast Naturlzd_Phd. U.S._Brn_Bac. U.S._Brn_Mast U.S._Brn_Phd.
1  2017    McLean County IL  2,872          52.0           8.7           0.0           0.0           4.6           0.0          34.7           0.0           0.0
2  2017      Lake County IL  6,757          21.1          19.5           1.4          15.7           4.3           2.8          29.1           2.9           3.3
3  2017 Champaign County IL  2,428          19.2           0.0           8.8           0.0           0.0           0.0          50.8          21.2           0.0
4  2017    DuPage County IL  9,767          14.2          22.8           1.1           8.1           5.4           4.3          35.3           7.3           1.4
5  2017      Cook County IL 28,419           9.3          11.4           0.7           9.5           4.7           0.6          50.3          11.3           2.1
6  2017      Will County IL  3,733           2.0           2.5           0.0          34.7          16.4           0.0          35.7           8.6           0.0
7  2017                (NA)  3,781           0.6           0.0           0.0           0.0           8.6           0.0          77.4          13.4           0.0
8  2017      Kane County IL  2,657           0.0           0.0           0.0           2.7           2.8           0.0          87.2           4.4           2.9
9  2017   McHenry County IL  1,590           0.0           0.0           0.0          12.3          10.6           0.0          64.1           0.0          13.1
10 2017 St. Clair County IL  1,372           0.0           0.0           0.0           0.0           0.0           0.0          53.1          46.9           0.0

URL parameters (short)=
?STATE=IL&geo=COUNTY&occ=Computer%20software%20developers%20(229)&group=CTZNSHP|EDUC&sortn=4&mincount=1000

Percent of Workers Who Are Non-citizens by Occupation in Illinois in 2017, sorted by percent

                                                                     Non-
N                                              Occupation     Total citizen Percent  Occ1990
-- ------------------------------------------------------ --------- ------- ------- --------
1                            Computer software developers    66,867  15,811    23.6  SWDevel
2                    Operators, Fabricators, and Laborers   287,011  59,588    20.8 Operator
3                                      Natural Scientists    21,715   4,024    18.5   NatSci
4                                     Construction Trades   185,113  30,331    16.4 Constrct
5          Transportation and Material Moving Occupations   544,307  76,795    14.1 Transprt
6                        Precision Production Occupations   146,003  20,529    14.1 Productn
7                   Farming, Forestry, Fishing, Gardening    97,748  13,127    13.4  Farming
8                Service Occupations, including Household 1,022,291 133,546    13.1  Service
9                                 Mechanics and Repairers   168,081  18,388    10.9 Mechanic
10                   Mathematical and Computer Scientists   141,515  13,377     9.5 MathComp
11                   Engineers, Architects, and Surveyors    74,956   6,345     8.5 Engineer
12                          Health Diagnosing Occupations    55,689   4,338     7.8 HlthDiag
13           Social Scientists, Urban Planners, Religious   111,364   5,444     4.9   SocSci
14         Teachers, Librarians, Archivists, and Curators   408,769  19,872     4.9  Teacher
15 Administrative Support Occupations, including Clerical   839,629  38,541     4.6 AdminSup
16                                      Sales Occupations   648,987  29,571     4.6    Sales
17              Executive, Administrative, and Managerial   909,272  40,445     4.4  Manager
18                          Technologists and Technicians   155,218   4,658     3.0  Technol
19               Health Assessment & Treating, Therapists   202,920   6,062     3.0 HlthCare
20                                     Lawyers and Judges    53,590     828     1.5   Lawyer
21                                   Military Occupations    15,872       0     0.0 Military
-- ------------------------------------------------------ --------- ------- ------- --------
                                           Total Employed 6,268,573 546,665     8.7    Total

Source for Census Data

U.S. Census Data available at IPUMS USA - using the following default sample from each year:

Most Recent Trade Adjustment Assistance (TAA) Data for Illinois

        TAW                                   Company               Location    Decision  Workers  Reasons why you believe that separations that have occurred
0     94985                    Sphera Solutions, Inc.            Chicago, IL         NaN      +15  Tier one workers, located in Bangalore, India, arc now doing tier two work. (Computer Program Solutions)
1     94933                       Jernberg Industries            Chicago, IL         NaN      166  Increase imports and/or tariffs for steel industry. (Automotive Supplier (metal parts)
2     94860                             AT&T Services    Hoffman Estates, IL   7/25/2019       24  Workers reported that positions were outsourced to Tech Mahindra in India. (IP Voice - Call Center Operations)
3     94836  Eagle Test Systems Inc., a Teradyne Comp      Buffalo Grove, IL   6/21/2019       16  Teradyne is moving production of some Eagle Test products to a contract manufacturer in Penang, Malaysia causing end of employment. (Automatic testing equipment)
4     94818                   Interplex Daystar, Inc.      Franklin Park, IL    7/5/2019       75  Production is being shifted to a customer owned plant in China plus company owned plants in Mexico and the USA. (Plastic injection molded parts)
5     94796            Hubbell Lighting, Inc. - Elgin              Elgin, IL   6/11/2019       84  Production is being shifted to Mexico. (manufacturing employees)
6     94788              Honeywell International Inc.             Galena, IL   5/28/2019       56  Assembly line is moving to Mexico. The rest of the lines are moving to other U.S. locations. This is a complete plant closure. (Electronic Component Switches)
7    94777A  Aerotek Professional Services, Beacon Hi       Granite City, IL   6/11/2019     ~200  (~160) Workers at the facility were laid off in March, 2019 (approx. 160). (cast steel - railroad steel parts)
8     94777                 Amsted Rail Company, Inc.       Granite City, IL   6/11/2019        "  "
9     94751            AMETEK Instrumentation Systems        Warrenville, IL   7/23/2019        5  Market conditions force looking for cost cutting initiatives including shifting work to lower labor cost countries like Maxico & India. (electronic components)
10    94734                                   Anixter           Glenview, IL   6/12/2019       76  The Data Center and other parts of IT were outsourced to India. (cable & wire)
11    94724        Continental Tire the Americas, LLC         Mt. Vernon, IL    5/6/2019  (blank)  This worker group is subject to injury based on notification from USDOL/ITC Investigation 701TA556 & 731TA1311 involving Truck and Bus Tires from China.
12    94718             HSBC Technology Services, USA  Arlington Heights, IL         NaN        3  Entire Global Risk Analytics decisional unit is laid off. Line Managers told the impacted employees their jobs are moving to London, Poland & or India. (IT)
13    94708    Alexian Brothers - AHS Midwest Regions              Lisle, IL   6/14/2019       30  Amita outsourced the collections dept to R1, a company that uses workers from India, to perform the jobs that were done by laid off U.S. workers.
14    94705                                  Syncreon          Belvidere, IL         NaN      180  Company is a direct supplier for FCA in Belvidere. Petition has already been filed for FCA #TA-W-94,957. (Sequence parts)
15    94695                             Grupo Antolin          Belvidere, IL         NaN       17  "                     "                     "                     "                     "                (Various module assemblies)
16    94691                                   Android          Belvidere, IL         NaN      100  "                     "                     "                     "                     "                (Engine assembly)
17    94662                                    Aleris       Lincolnshire, IL   6/25/2019  unknown  This worker group is subject to injury based on notification from USDOL/ITC Investigation 701TA591 & 731TA1399 involving Common Alloy Aluminum Sheet from China.
18    94597                                FCA US LLC          Belvidere, IL         NaN     1371  Previously built Jeep Compass now being produced in Mexico. China now producing Jeep Cherokee which is only vehicle currently being assembled in Belvidere.
19    94575                  Nucor Skyline Steel, LLC             Newton, IL   5/16/2019
20    94569                                Atlas Tube            Chicago, IL   5/24/2019
21    94547                                       IBM            Chicago, IL   2/26/2019       50  (+250 in NY) Services have been offshored to foreign country, the Philippines. (telecom products and services)
22    94544                              Ardagh Group            Lincoln, IL         NaN
23    94528  HSBC Technology and Services, USA (HTSU)  Arlington Heights, IL   4/12/2019
24   94468B                        MOL (America) Inc.            Lombard, IL   6/25/2019
25    94426                    Excelitas Technologies           Wheeling, IL   1/28/2019
26    94407                  Core Pipe Products, Inc.       Carol Stream, IL   7/18/2019
27    94406           ZF Chassis Systems Chicago, LLC            Chicago, IL    5/3/2019
28    94403                Allscripts Healthcare, LLC            Chicago, IL  12/28/2018
29    94389             Huron Consulting Services LLC            Chicago, IL  12/31/2018
30    94382                      ADC Die Casting, LLC  Elk Grove Village, IL    2/3/2019
31    94365          Callen Manufacturing Corporation          Northlake, IL    1/8/2019
32    94321                      Siemens Healthineers    Hoffman Estates, IL  12/17/2018
33    94315                                Trigo-SCSI             Joliet, IL  12/11/2018
34    94297                         Block Steel Corp.             Skokie, IL   2/10/2019
35    94281                          Caterpillar Inc.         Montgomery, IL   3/28/2019
36    94273             MBI (Metal Box International)      Franklin Park, IL  12/27/2018
37    94188              Nokia of America Corporation         Naperville, IL  10/23/2018
38    94181              Jet Aviation St. Louis, Inc.            Cahokia, IL   2/21/2019
39    94161                            Alpha Guardian           Wauconda, IL  11/30/2018
40    94147                    Handi-Foil Corporation           Wheeling, IL  12/11/2018
41    94137              Acuity Brands Lighting, Inc.        Des Plaines, IL   10/9/2018
42   94112A         On-Site Leased Workers From APTIM             Joliet, IL   10/5/2018
43    94112                          Caterpillar Inc.             Joliet, IL   10/5/2018
44   94096A                            Alpha Guardian           Wauconda, IL   9/12/2018
45    94096                         Stack-On Products           Wauconda, IL   9/12/2018
46    94082    Health Care Service Corporation (HCSC)            Chicago, IL   9/24/2018
47    94032      Nu-World Amaranth dba Nu-World Foods         Naperville, IL   9/21/2018
48    93997                  PTC Tubular Products LLC           Fairbury, IL    8/9/2018
49    93996                         Mid-West Mfg. LLC    Chicago Heights, IL    8/9/2018
50    93964   REG Seneca Renewable Energy Group, Inc.             Seneca, IL   9/30/2018
51    93962                     Plymouth Tube Company        Warrenville, IL   7/13/2018
52    93956                          Caterpillar Inc.             Joliet, IL   7/20/2018
53    93954              Two Rivers Conferencing, LLC  Elk Grove Village, IL  12/26/2018
54    93931             Baxter Healthcare Corporation         Round Lake, IL    7/5/2018
55    93906               Sterling Steel Company, LLC           Sterling, IL   6/29/2018
56    93898                  Cardinal Health, 200 LLC           Waukegan, IL    8/2/2018
57    93897                                     Xerox           Rosemont, IL   6/26/2018
58    93895    Keystone Consolidated Industries, Inc.             Peoria, IL   9/28/2018
59    93852                         REG Danville, LLC           Danville, IL   6/21/2018
60    93847                 Incobrasa Industries, LTD             Gilman, IL   6/21/2018
61    93844                              PERQ/HCI LLC           Rosemont, IL   7/31/2018
62    93776                Nucor Steel Kankakee, Inc.        Bourbonnais, IL   5/24/2018
63    93775    Keystone Consolidated Industries, Inc.             Peoria, IL   6/19/2018
64    93774               Keystone Bar Products, Inc.    Chicago Heights, IL   7/12/2018
65   93740A                The Northern Trust Company            Chicago, IL   5/29/2018
66    93740                The Northern Trust Company         Naperville, IL   5/29/2018
67   93708B                        MOL (America) Inc.            Lombard, IL  12/11/2018
68    93671            Midway Airport Concessionaires            Chicago, IL   5/18/2018
69   93658A                                       SDI            Chicago, IL   4/24/2018
70    93658                     Motorola Mobility LLC            Chicago, IL   4/24/2018
71   93637D  Optum Operations/Population Health Manag              Lisle, IL   4/16/2018
72    93603                  North American Stainless            Minooka, IL    4/8/2018
73    93583           Health Care Service Corporation         Naperville, IL   4/12/2018
74    93579  APTIM and Securitas Critical Infrastruct         Metropolis, IL    4/5/2018
75    93570          Steel Warehouse Quad Cities, LLC        Rock Island, IL    4/9/2018
76    93542                                  Weldbend       Bedford Park, IL   4/13/2018
77    93541                      Weldbend Corporation               Argo, IL   3/26/2018
78    93530                          HCL America Inc.         Naperville, IL    3/8/2018
79    93522                     Siemens Industry Inc.       West Chicago, IL   2/28/2018
80    93520                           Dentsply Sirona        Des Plaines, IL   3/15/2018
81    93492              Outokumpu Stainless USA, LLC        Bannockburn, IL   3/27/2018
82    93488                           H. Kramer & Co.            Chicago, IL   5/18/2018
83    93486        Continental Tire The Americas, LLC         Mt. Vernon, IL   4/20/2018
84    93441                 Allstate Investments, LLC         Northbrook, IL    3/1/2018
85    93392                 Turner Specialty Services         Metropolis, IL   1/30/2018
86    93382             Honeywell International, Inc.         Metropolis, IL   1/23/2018
87    93355  Philips Medical Systems (Cleveland) Inc.             Aurora, IL   2/12/2018
88    93342       Bridgestone Americas Tire Operation             Normal, IL    2/7/2018
89    93307      Archer-Daniels-Midland Company (ADM)            Decatur, IL  12/12/2017
90   93285A                     StaffManagement, Inc.            Chicago, IL  12/17/2017
91    93273                  Henry Technologies, Inc.            Chatham, IL  11/15/2017
92    93271                       Airtex Products, LP          Fairfield, IL  11/18/2017
93   93262H                       Boyd Coffee Company      Downers Grove, IL  12/14/2017
94    93255                   Capgemini America, Inc.            Chicago, IL   1/30/2018
95    93249                              Vesuvius USA         Charleston, IL   11/8/2017
96    93236                  RotaDyne Molded Products            Chicago, IL  11/18/2017
97    93230            BP Products North America Inc.         Naperville, IL  11/20/2017
98    93222                   Alcatel-Lucent USA Inc.         Naperville, IL    2/1/2018
99    93219              Dura Automotive Systems, LLC           Stockton, IL  11/13/2017
100   93204                               Plews, Inc.              Dixon, IL   3/23/2018
101  93197K                          Country Curtains         Naperville, IL   5/17/2018
102  93192A                        Oracle Corporation             Itasca, IL   2/27/2018
103   93192                        Oracle Corporation            Chicago, IL   2/27/2018
104   93154           United States Steel Corporation       Granite City, IL    5/4/2018
105   93152               ArcelorMittal Riverdale LLC          Riverdale, IL  10/10/2017
106  93139C                            CDM Smith Inc.            Chicago, IL    1/4/2018
107  93139L                            CDM Smith Inc.              Lisle, IL    1/4/2018
108  93137A                                  Experian         Schaumburg, IL  10/27/2017
109   93137                                  Experian        Springfield, IL  10/27/2017
110   93128                                  Motorola            Chicago, IL   9/20/2017
111   93116                     DeVry Education Group      Downers Grove, IL   3/23/2018
112   93111                   Corpak Medsystems, Inc.      Buffalo Grove, IL   9/14/2017
113   93110                  Encap Technologies, Inc.           Palatine, IL  10/10/2017
114   93094           Health Care Service Corporation             Marion, IL   9/14/2017
115   93088                                BorgWarner           Bellwood, IL   1/29/2018
116   93087                Hewlett Packard Enterprise            Chicago, IL   9/19/2017
117  93078A           Health Care Service Corporation            Lombard, IL   9/14/2017
118   93078           Health Care Service Corporation      Downers Grove, IL   9/14/2017
119   93074  Philips Medical Systems (Cleveland) Inc.             Aurora, IL  10/24/2017
Source: U.S. Department of Labor, Trade Adjustment Assistance (TAA) data

Other Related Data for Illinois

Notices of Layoffs and Closures (WARN)
Are H-1B Workers Getting Bilked? - Bloomberg, January 30, 2008 - By 2004, Goel was in Bloomington, Ill., working for Patni at State Farm Mutual Automobile Insurance, the largest car insurer in the country.
B-N residents, natives of India, caught in immigration debate - Pantagraph, Feb 19, 2018 - He moved to Bloomington in 2004 on a work visa and has been living here ever since, working as a contract employee at State Farm.
State Farm cutting nearly 900 analyst jobs in B-N, some moving to hubs - Pantagraph, March 7, 2018 - About 890 non-management analyst positions are being cut in Bloomington as part of State Farm's ongoing realignment of its information technology divisions.

H-1B and Related Data by State
H-1B Data
OPT Data