H-1B and Related Data for New York


Certified Labor Condition Application (LCA) Data for New York, FY 2019

Top 50 Worksite EMPLOYER_NAMEs and WORKSITE_CITYs, sorted by WORKERS, All Worksites

                              EMPLOYER_NAME2    WORKSITE_CITY WORKERS APPLICATIONS
1                        DELOITTE CONSULTING         NEW YORK    3309          265
2      NEW YORK CITY DEPARTMENT OF EDUCATION         BROOKLYN    1255           60
3                          ERNST & YOUNG U.S         NEW YORK    1057         1055
4                               BLOOMBERG LP         NEW YORK     925          320
5                              GOLDMAN SACHS         NEW YORK     879          779
6                                     GOOGLE         NEW YORK     828          822
7                          FRACTAL ANALYTICS         NEW YORK     777           19
8                             MORGAN STANLEY         NEW YORK     763          719
9                          UBER TECHNOLOGIES         NEW YORK     759          117
10             MORGAN STANLEY SERVICES GROUP         NEW YORK     452          451
11                                  FACEBOOK         NEW YORK     416          211
12                         DELOITTE & TOUCHE         NEW YORK     411          133
13                            JPMORGAN CHASE         NEW YORK     405          405
14      MCKINSEY & COMPANY INC UNITED STATES         NEW YORK     370           82
15                            UBS SECURITIES         NEW YORK     360           79
16                           BOFA SECURITIES         NEW YORK     327          327
17            BLACKROCK FINANCIAL MANAGEMENT         NEW YORK     320          262
18                          AMERICAN EXPRESS         NEW YORK     303          270
19              VERITAS HEALTHCARE SOLUTIONS         NEW YORK     260           26
20                              DELOITTE TAX         NEW YORK     254           80
21                         DELOITTE & TOUCHE         NEW YORK     253           82
22                                BILINGUALS     FOREST HILLS     250           10
23                    PRICEWATERHOUSECOOPERS         NEW YORK     248          248
24                          GENERAL ELECTRIC      SCHENECTADY     238           51
25                                      KPMG         NEW YORK     223          150
26           PRICEWATERHOUSECOOPERS ADVISORY         NEW YORK     217          217
27                             MERRILL LYNCH         NEW YORK     212          212
28                                     XEROX          WEBSTER     203           74
29                  CITIGROUP GLOBAL MARKETS         NEW YORK     195           51
30                       COLUMBIA UNIVERSITY         NEW YORK     188          188
31                                AMAZON.COM         NEW YORK     185          139
32                 MONTEFIORE MEDICAL CENTER            BRONX     183           87
33            CREDIT SUISSE SECURITIES (USA)         NEW YORK     174          166
34                       BANK OF AMERICA N.A         NEW YORK     174          174
35                         CAPGEMINI AMERICA         NEW YORK     168           75
36   ICAHN SCHOOL OF MEDICINE AT MOUNT SINAI         NEW YORK     166          166
37                       GLOBALFOUNDRIES U.S            MALTA     165          161
38                            ORACLE AMERICA         NEW YORK     165           14
39                          BARCLAYS CAPITAL         NEW YORK     163          140
40    MEMORIAL SLOAN-KETTERING CANCER CENTER         NEW YORK     158          158
41                            UBS SECURITIES    NEW YORK CITY     151            4
42                                    CYIENT LONG ISLAND CITY     150            6
43                          VERIZON WIRELESS LONG ISLAND CITY     150            6
44                       NEW YORK UNIVERSITY         NEW YORK     148          130
45                     PALANTIR TECHNOLOGIES         NEW YORK     140           23
46               MORGAN STANLEY SMITH BARNEY         NEW YORK     137          135
47  DELOITTE TRANSACTIONS & BUSINESS ANALYTI         NEW YORK     136           40
48                   BRONXCARE HEALTH SYSTEM            BRONX     133           45
49                              ALLURE GROUP         BROOKLYN     125            5
50                        WE WORK MANAGEMENT         NEW YORK     124          124

Top 50 Worksite EMPLOYER_NAMEs and WORKSITE_CITYs, sorted by WORKERS, Local Worksites Only

                              EMPLOYER_NAME2    WORKSITE_CITY WORKERS APPLICATIONS
1                        DELOITTE CONSULTING         NEW YORK    3309          265
2      NEW YORK CITY DEPARTMENT OF EDUCATION         BROOKLYN    1231           47
3                          ERNST & YOUNG U.S         NEW YORK    1057         1055
4                               BLOOMBERG LP         NEW YORK     920          315
5                              GOLDMAN SACHS         NEW YORK     840          745
6                          FRACTAL ANALYTICS         NEW YORK     777           19
7                                     GOOGLE         NEW YORK     776          776
8                          UBER TECHNOLOGIES         NEW YORK     759          117
9              MORGAN STANLEY SERVICES GROUP         NEW YORK     440          440
10                                  FACEBOOK         NEW YORK     412          207
11                         DELOITTE & TOUCHE         NEW YORK     411          133
12                            JPMORGAN CHASE         NEW YORK     399          399
13      MCKINSEY & COMPANY INC UNITED STATES         NEW YORK     370           82
14                            UBS SECURITIES         NEW YORK     360           79
15                           BOFA SECURITIES         NEW YORK     327          327
16            BLACKROCK FINANCIAL MANAGEMENT         NEW YORK     320          262
17              VERITAS HEALTHCARE SOLUTIONS         NEW YORK     260           26
18                              DELOITTE TAX         NEW YORK     254           80
19                         DELOITTE & TOUCHE         NEW YORK     253           82
20                                BILINGUALS     FOREST HILLS     250           10
21                    PRICEWATERHOUSECOOPERS         NEW YORK     246          246
22                                      KPMG         NEW YORK     219          146
23           PRICEWATERHOUSECOOPERS ADVISORY         NEW YORK     217          217
24                             MERRILL LYNCH         NEW YORK     212          212
25                  CITIGROUP GLOBAL MARKETS         NEW YORK     195           51
26                          AMERICAN EXPRESS         NEW YORK     187          170
27                       COLUMBIA UNIVERSITY         NEW YORK     186          186
28                                AMAZON.COM         NEW YORK     185          139
29                            MORGAN STANLEY         NEW YORK     185          185
30                 MONTEFIORE MEDICAL CENTER            BRONX     182           86
31   ICAHN SCHOOL OF MEDICINE AT MOUNT SINAI         NEW YORK     166          166
32                         CAPGEMINI AMERICA         NEW YORK     166           73
33                       BANK OF AMERICA N.A         NEW YORK     165          165
34                            ORACLE AMERICA         NEW YORK     165           14
35    MEMORIAL SLOAN-KETTERING CANCER CENTER         NEW YORK     158          158
36            CREDIT SUISSE SECURITIES (USA)         NEW YORK     154          154
37                       GLOBALFOUNDRIES U.S            MALTA     153          153
38                            UBS SECURITIES    NEW YORK CITY     151            4
39                                    CYIENT LONG ISLAND CITY     150            6
40                     PALANTIR TECHNOLOGIES         NEW YORK     140           23
41  DELOITTE TRANSACTIONS & BUSINESS ANALYTI         NEW YORK     136           40
42                   BRONXCARE HEALTH SYSTEM            BRONX     127           39
43                        WE WORK MANAGEMENT         NEW YORK     124          124
44                       NEW YORK UNIVERSITY         NEW YORK     123          123
45                                DIONA (US)           ALBANY     120            3
46                              CITIBANK N.A         NEW YORK     118           96
47                 MOODY'S INVESTORS SERVICE         NEW YORK     117           44
48                    GOLDMAN SACHS BANK USA         NEW YORK     113           75
49                           FUJITSU AMERICA         NEW YORK     112           15
50                              CITIBANK N.A LONG ISLAND CITY     108           72

Top 50 Worksite EMPLOYER_NAMEs and WORKSITE_CITYs, sorted by WORKERS, Remote Worksites Only

                              EMPLOYER_NAME2    WORKSITE_CITY WORKERS APPLICATIONS
1                             MORGAN STANLEY         NEW YORK     578          534
2                           GENERAL ELECTRIC      SCHENECTADY     231           44
3                                      XEROX          WEBSTER     199           70
4                           VERIZON WIRELESS LONG ISLAND CITY     150            6
5                               ALLURE GROUP         BROOKLYN     125            5
6                                     VIACOM         NEW YORK     121           82
7                           AMERICAN EXPRESS         NEW YORK     116          100
8                MORGAN STANLEY SMITH BARNEY         NEW YORK     116          114
9                                    MOODY'S         NEW YORK     105           78
10     NEW YORK CITY DEPARTMENT OF EDUCATION LONG ISLAND CITY     104            5
11                ORTHO CLINICAL DIAGNOSTICS        ROCHESTER     102            6
12                             EMBLEM HEALTH         NEW YORK      99           99
13            THERADYNAMICS REHAB MANAGEMENT         NEW YORK      95            3
14                           JP MORGAN CHASE         NEW YORK      91           43
15                           BANK OF AMERICA         NEW YORK      88           86
16                              NBCUNIVERSAL         NEW YORK      87           10
17                          DEUTSCHE BANK AG         NEW YORK      86           49
18                                   CORNING     PAINTED POST      70           35
19                              CSC HOLDINGS         BETHPAGE      69           65
20                                  M&T BANK          BUFFALO      68           49
21                              HENRY SCHEIN         MELVILLE      63            6
22                              EMBLEMHEALTH         NEW YORK      60           60
23  BORO PARK CENTER FOR REHABILITATION & HE         BROOKLYN      60            6
24                          BARCLAYS CAPITAL         NEW YORK      59           59
25                                       MNT          BUFFALO      59           59
26                          CITY OF NEW YORK         NEW YORK      57           21
27                           JETBLUE AIRWAYS LONG ISLAND CITY      55           41
28                                    GOOGLE         NEW YORK      52           46
29                             DEUTSCHE BANK         NEW YORK      52           52
30                              EMBLEMHEALTH    NEW YORK CITY      51           51
31                                   PAYCHEX          WEBSTER      50           50
32                          VERIZON WIRELESS      LONG ISLAND      50            2
33                               QBE AMERICA         NEW YORK      50            2
34                             CREDIT SUISSE         NEW YORK      49           38
35                                S&P GLOBAL         NEW YORK      48           20
36                                    PFIZER         NEW YORK      46           40
37         MORGAN STANLEY & CO INTERNATIONAL         NEW YORK      46           25
38                            JPMORGAN CHASE         BROOKLYN      45            9
39                                 ENDURANCE         PURCHASE      45            7
40      UNITED NATIONS DEVELOPMENT PROGRAMME         NEW YORK      45           45
41                             NBC UNIVERSAL         NEW YORK      44           25
42                          CITY OF NEW YORK         BROOKLYN      43           16
43                   BANK OF NEW YORK MELLON         NEW YORK      43           39
44                                  M&T BANK      CHEEKTOWAGA      42           14
45                          NORTHWELL HEALTH         MELVILLE      42           10
46                                      DTCC         NEW YORK      41            3
47                             TMP WORLDWIDE         NEW YORK      41            3
48                        NYU LANGONE HEALTH         NEW YORK      41           10
49                    MN DEPARTMENT OF HUMAN           ALBANY      41            2
50                                   PAYCHEX        ROCHESTER      40           40
Note: Remote Worksites denote when workers will be placed at a secondary location.
      In this case, field SECONDARY ENTITY is set to Y as explained in this File Structure file and
      EMPLOYER_NAME2 above will be set to the contents of field SECONDARY ENTITY BUSINESS NAME.
      Local Worksites denote when workers will NOT be placed at a secondary location.
Source: OFLC Performance Data (click Disclosure Data tab and go to section
        "Latest Quarterly Updates"), 2019

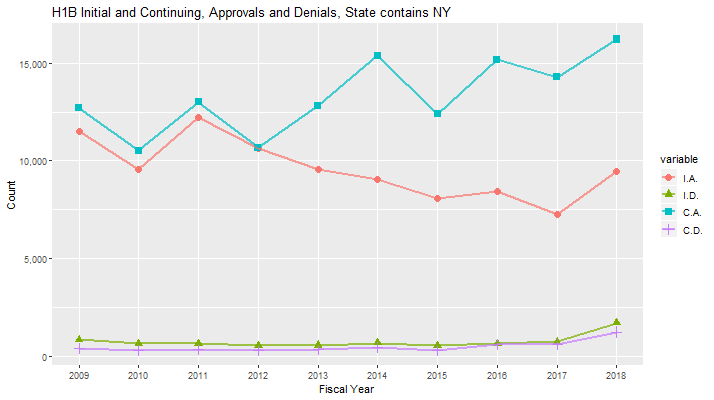
Labor Condition Application (LCA) Data for New York, FY 2015-2018

YEAR CASE_STATUS WORKERS APPLICATIONS
2015   CERTIFIED   94939        47703
2016   CERTIFIED  101603        51293
2017   CERTIFIED   83307        48193
2018   CERTIFIED   93595        51251

Labor Condition Application (LCA) Data for New York, FY 2018

Grouped by CASE_STATUS

  CASE_STATUS WORKERS APPLICATIONS
1   CERTIFIED   93595        51251
2 CERT-WITHDR    4458         3830
3   WITHDRAWN    2565         2110
4      DENIED    1751         1105

Grouped by VISA_CLASS

       VISA_CLASS WORKERS APPLICATIONS
1            H-1B   97646        53911
2  E-3 Australian    4217         3954
3 H-1B1 Singapore     370          318
4     H-1B1 Chile     136          113

Top 50 EMPLOYER_NAMEs, sorted by WORKERS

                               EMPLOYER_NAME WORKERS APPLICATIONS
1                     ERNST & YOUNG U.S. LLP   17959          867
2                    DELOITTE CONSULTING LLP    5558         1033
3                          HCL AMERICA, INC.    1655          103
4                        MPHASIS CORPORATION    1282           59
5                              BLOOMBERG, LP    1205          498
6                              BIRLASOFT INC    1120           48
7                                KFORCE INC.    1060           46
8                 PRICEWATERHOUSECOOPERS LLP     989          301
9   COGNIZANT TECHNOLOGY SOLUTIONS U.S. CORP     988           52
10                     CAPGEMINI AMERICA INC     878          471
11         TATA CONSULTANCY SERVICES LIMITED     857          663
12                   GOLDMAN SACHS & CO. LLC     853          663
13                GRANDISON MANAGEMENT, INC.     830           83
14     NEW YORK CITY DEPARTMENT OF EDUCATION     818           35
15                     DELOITTE & TOUCHE LLP     803          269
16                    RCM TECHNOLOGIES, INC.     744           18
17                        EPAM SYSTEMS, INC.     635           55
18                      JPMORGAN CHASE & CO.     628          622
19  PRICEWATERHOUSECOOPERS ADVISORY SERVICES     619          332
20                        A.T. KEARNEY, INC.     601           13
21    COGNIZANT TECHNOLOGY SOLUTIONS US CORP     594          536
22                                  KPMG LLP     566          242
23                           IBM CORPORATION     530          530
24      BLACKROCK FINANCIAL MANAGEMENT, INC.     489          373
25                                GOOGLE LLC     468          468
26             CITIGROUP GLOBAL MARKETS INC.     442          123
27                       VIRTUSA CORPORATION     433          254
28                      BANK OF AMERICA N.A.     369          294
29                    ERNST & YOUNG U.S. LLP     368           18
30                       COLUMBIA UNIVERSITY     366          360
31          LARSEN & TOUBRO INFOTECH LIMITED     347          252
32                            FACEBOOK, INC.     347          200
33                   BOFAML SECURITIES, INC.     343          267
34                             WIPRO LIMITED     339          232
35    MCKINSEY & COMPANY, INC. UNITED STATES     335          103
36        MORGAN STANLEY SERVICES GROUP INC.     314          314
37                           BILINGUALS INC.     309           26
38                THE EXECU|SEARCH GROUP LLC     308           24
39                            CITIBANK, N.A.     300          232
40                           INFOSYS LIMITED     291          291
41        CREDIT SUISSE SECURITIES (USA) LLC     286          286
42                 MONTEFIORE MEDICAL CENTER     279          182
43                   BARCLAYS SERVICES CORP.     275          233
44                          DELOITTE TAX LLP     273           91
45                                SYNTEL INC     273          273
46                     NYU WINTHROP HOSPITAL     266           50
47                      RCM TECHNOLOGIES INC     262           11
48            BROOKHAVEN NATIONAL LABORATORY     257          257
49       CGI TECHNOLOGIES AND SOLUTIONS INC.     250           28
50         MORGAN STANLEY SERVICES GROUP INC     243          243

Top 30 SOC_NAMEs, sorted by WORKERS

                                    SOC_NAME WORKERS APPLICATIONS
1          SOFTWARE DEVELOPERS, APPLICATIONS   16661        11101
2                  COMPUTER SYSTEMS ANALYSTS    8292         3369
3            COMPUTER OCCUPATIONS, ALL OTHER    7819         3986
4                   ACCOUNTANTS AND AUDITORS    6750         1976
5                         FINANCIAL ANALYSTS    6722         4589
6                        MANAGEMENT ANALYSTS    5450         1916
7               OPERATIONS RESEARCH ANALYSTS    4668         1963
8           FINANCIAL SPECIALISTS, ALL OTHER    4632         1269
9                       COMPUTER PROGRAMMERS    2688         1213
10  MARKET RESEARCH ANALYSTS AND MARKETING S    2127         1713
11     SOFTWARE DEVELOPERS, SYSTEMS SOFTWARE    2079         1429
12                             STATISTICIANS    1606          969
13                       PHYSICAL THERAPISTS    1410          387
14        PHYSICIANS AND SURGEONS, ALL OTHER    1355          882
15                   DATABASE ADMINISTRATORS    1216          588
16                                   LAWYERS    1196          940
17                   OCCUPATIONAL THERAPISTS    1045           57
18  COMPUTER AND INFORMATION SYSTEMS MANAGER    1015          669
19             INFORMATION SECURITY ANALYSTS     948          262
20                                 ACTUARIES     831          183
21                  COMPUTER SYSTEMS ANALYST     790          380
22  MEDICAL SCIENTISTS, EXCEPT EPIDEMIOLOGIS     672          570
23          BIOLOGICAL SCIENTISTS, ALL OTHER     655          649
24                        FINANCIAL MANAGERS     615          593
25                           CIVIL ENGINEERS     611          577
26    ARCHITECTS, EXCEPT LANDSCAPE AND NAVAL     572          519
27  NETWORK AND COMPUTER SYSTEMS ADMINISTRAT     565          438
28                        MARKETING MANAGERS     560          509
29                         GRAPHIC DESIGNERS     559          529
30    ELECTRONICS ENGINEERS, EXCEPT COMPUTER     552          244

Note: SOC_NAME is the occupational name associated with the SOC_CODE.
      SOC_CODE is the occupational code associated with the job being
      requested for temporary labor condition, as classified by the
      Standard Occupational Classification (SOC) System.

Top 30 WORKSITE_CITYs, sorted by WORKERS

          WORKSITE_CITY WORKERS APPLICATIONS
1              NEW YORK   73990        40432
2              BROOKLYN    4461         2237
3                 BRONX    1421          896
4                ALBANY    1315          950
5               BUFFALO    1244          779
6             ROCHESTER    1170          597
7              MELVILLE    1130          414
8      LONG ISLAND CITY    1027          761
9          WHITE PLAINS     661          387
10             SYRACUSE     621          387
11             FLUSHING     580          462
12        NEW YORK CITY     501          414
13              WEBSTER     501          206
14             PURCHASE     462          205
15          LONG ISLAND     447           26
16                MALTA     443          391
17          SCHENECTADY     307          177
18         FOREST HILLS     280           47
19            TARRYTOWN     270          167
20            HAUPPAUGE     269          224
21                UPTON     263          263
22               VICTOR     247           84
23          CHEEKTOWAGA     246           60
24           HICKSVILLE     231          177
25           RENSSELAER     219          209
26         NEW HARTFORD     206           63
27               ITHACA     204          204
28              MINEOLA     202           67
29        NEW HYDE PARK     201          151
30              JAMAICA     191          109
Source: OFLC Performance Data (click Disclosure Data tab and go to section
        "LCA Programs (H-1B, H-1B1, E-3)"), 2015, 2016, 2017, and 2018

H1B Approval data for New York, 2009-2018

H-1B Approval Data for New York, FY 2009-2018

   FYear Records  I.A. I.D.  C.A. C.D. Workers I.A.R C.A.R T.A.R
1   2009    8965 11521  839 12699  370   24220  93.2  97.2  95.2
2   2010    7284  9543  625 10529  296   20072  93.9  97.3  95.6
3   2011    8318 12206  628 13017  326   25223  95.1  97.6  96.4
4   2012    7421 10661  529 10673  298   21334  95.3  97.3  96.3
5   2013    7114  9555  549 12830  320   22385  94.6  97.6  96.3
6   2014    7575  9042  670 15381  455   24423  93.1  97.1  95.6
7   2015    6102  8089  519 12394  300   20483  94.0  97.6  96.2
8   2016    6450  8432  632 15191  586   23623  93.0  96.3  95.1
9   2017    5782  7262  741 14302  604   21564  90.7  95.9  94.1
10  2018    6952  9442 1690 16224 1234   25666  84.8  92.9  89.8

Key: I.A. = Initial Approval, I.D. = Initial Denial, C.A. = Continuing Approval, C.D. = Continuing Denial,
     I.A.R. = Initial Approval Rate, C.A.R. = Continuing Approval Rate, T.A.R. = Total Approval Rate

H-1B Approval Data for New York, FY 2018

Top 50 Employers, sorted by Workers (Initial Approvals plus Continuing Approvals)

  FYear Records I.A. I.D.  C.A. C.D. Workers I.A.R C.A.R T.A.R
1  2018    6952 9442 1690 16224 1234   25666  84.8  92.9  89.8

                              Employer Records I.A. I.D. C.A. C.D. Workers I.A.R C.A.R T.A.R
1                  MPHASIS CORPORATION       8  176   60  918  140    1094  74.6  86.8  84.5
2                         BLOOMBERG LP       5  225    4  473   20     698  98.3  95.9  96.7
3   AMERICAN EXPRESS TRAVEL RELATED SE       3   56    2  511    6     567  96.6  98.8  98.6
4                        SYNECHRON INC       3  122    2  347   10     469  98.4  97.2  97.5
5                  BANK OF AMERICA N A       1  105    5  331    2     436  95.5  99.4  98.4
6    MORGAN STANLEY SERVICES GROUP INC       4  124   19  310    5     434  86.7  98.4  94.8
7                          CITIBANK NA       1   76    8  308   22     384  90.5  93.3  92.8
8      MCKINSEY & CO INC UNITED STATES       1  190   52  176   28     366  78.5  86.3  82.1
9               BARCLAYS SERVICES CORP       3   60    2  211    6     271  96.8  97.2  97.1
10        MASTERCARD INTL INCORPORATED       1   29    2  198    4     227  93.5  98.0  97.4
11               BARCLAYS SERVICES LLC       3   18    0  194   10     212 100.0  95.1  95.5
12                 COLUMBIA UNIVERSITY       2  129    1   81    0     210  99.2 100.0  99.5
13    CREDIT SUISSE SECURITIES USA LLC       1   69    2  136    3     205  97.2  97.8  97.6
14             DB USA CORE CORPORATION       1    7    2  184    5     191  77.8  97.4  96.5
15  MEMORIAL SLOAN KETTERING CANCER CT       1   73    2  106    7     179  97.3  93.8  95.2
16                  EXLSERVICE.COM LLC       1   57   19  118    8     175  75.0  93.7  86.6
17        CITIGROUP GLOBAL MARKETS INC       3   83    6   88    5     171  93.3  94.6  94.0
18                 MUFG UNION BANK N A       2   23    0  143    7     166 100.0  95.3  96.0
19   ICAHN SCHOOL OF MEDICINE AT MOUNT       1   86    3   74    3     160  96.6  96.1  96.4
20           AIG EMPLOYEE SERVICES INC       1   36    4  122    4     158  90.0  96.8  95.2
21            GRANDISON MANAGEMENT INC       2   62    1   81    1     143  98.4  98.8  98.6
22                    HSBC BANK USA NA       1   33    3  102    4     135  91.7  96.2  95.1
23         FIS MANAGEMENT SERVICES LLC       1   27    3  106    7     133  90.0  93.8  93.0
24             MORGAN STANLEY & CO LLC       1   63    2   68    1     131  96.9  98.6  97.8
25          THE NIELSEN COMPANY US LLC       1   17    0   96    2     113 100.0  98.0  98.3
26                MOODYS ANALYTICS INC       3   39    1   71    1     110  97.5  98.6  98.2
27    CITICORP CREDIT SERVICES INC USA       1   23    0   85    4     108 100.0  95.5  96.4
28                       MERRILL LYNCH       1   12    5   94    3     106  70.6  96.9  93.0
29    NEW YORK UNIV SCHOOL OF MEDICINE       1   48    1   57    0     105  98.0 100.0  99.1
30        DEUTSCHE BANK SECURITIES INC       2   34    6   69    1     103  85.0  98.6  93.6
31            CITIGROUP TECHNOLOGY INC       2   11    0   90    1     101 100.0  98.9  99.0
32          AIG PC GLOBAL SERVICES INC       2    9    1   90    9      99  90.0  90.9  90.8
33       WEILL CORNELL MEDICAL COLLEGE       4   43    0   54    0      97 100.0 100.0 100.0
34       DEUTSCHE BANK NEW YORK BRANCH       3   21    6   75    4      96  77.8  94.9  90.6
35                   METLIFE GROUP INC       2   22    1   68    2      90  95.7  97.1  96.8
36                BARCLAYS CAPITAL INC       1   39    3   48    2      87  92.9  96.0  94.6
37                 NEW YORK UNIVERSITY       1   55    1   30    2      85  98.2  93.8  96.6
38            TWO SIGMA INVESTMENTS LP       2   36    0   48    1      84 100.0  98.0  98.8
39                   CORNELL UNIV ISSO       1   46    0   37    1      83 100.0  97.4  98.8
40           MONTEFIORE MEDICAL CENTER       1   36    0   47    0      83 100.0 100.0 100.0
41      MARKIT NA INC D/B/A IHS MARKIT       1   24    0   58    2      82 100.0  96.7  97.6
42            AMERICAN EXPRESS COMPANY       2   26    0   55    0      81 100.0 100.0 100.0
43       SKIDMORE OWINGS & MERRILL LLP       1   42    2   36    0      78  95.5 100.0  97.5
44  INCANDESCENT TECHS INC DBA ITI DAT       1   23    0   54    1      77 100.0  98.2  98.7
45            PARSONS BRINCKERHOFF INC       1   33    1   43    0      76  97.1 100.0  98.7
46      AVANI TECHNOLOGY SOLUTIONS INC       5    4    5   70   39      74  44.4  64.2  62.7
47      CREDIT SUISSE SERVICES USA LLC       2   22    0   52    2      74 100.0  96.3  97.4
48             UNIVERSITY OF ROCHESTER       1   52    1   20    0      72  98.1 100.0  98.6
49              SVAM INTERNATIONAL INC       1   27   15   44   10      71  64.3  81.5  74.0
50                   GCOM SOFTWARE INC       1   15    0   52    2      67 100.0  96.3  97.1

Key: I.A. = Initial Approval, I.D. = Initial Denial, C.A. = Continuing Approval, C.D. = Continuing Denial,
     I.A.R. = Initial Approval Rate, C.A.R. = Continuing Approval Rate, T.A.R. = Total Approval Rate
Source: H-1B Employer Data Hub Files, U.S. Citizenship and Immigration Services

New York Schools Among the Top 100 by Total Number of Students Participating in Optional Practical Training (OPT), 2017

New York Schools Among the Top 100 by Total Number of Students Participating in Optional Practical Training (OPT), 2017

N                                   School Name State Students
--- ------------------------------------------- ----- --------
1                           New York University    NY     6199
4   Columbia University in the City of New York    NY     5590
20      State University of New York at Buffalo    NY     2450
23              The City University of New York    NY     2345
25                           Cornell University    NY     2241
38                          Syracuse University    NY     1820
46             New York Institute of Technology    NY     1695
54  State University of New York at Stony Brook    NY     1435
55                               The New School    NY     1434
69                           Fordham University    NY     1219
76            Rochester Institute of Technology    NY     1072
79   State University of New York at Binghamton    NY     1058
93                        New York Film Academy    NY      856
100                     University of Rochester    NY      811
--- ------------------------------------------- ----- --------
                                 Total Students    NY    30225

Sources: U.S. Immigration and Customs Enforcement,
         2017 Top 100 Schools by Total Number of Students Participating in OPT

New York Schools Among Top 427 Employers for Optional Practical Training (OPT) Students, 2017

New York Schools Among Top 427 Employers for Optional Practical Training (OPT) plus Curricular Practical Training (CPT) Students, 2017

N                Employer Pre&Post  STEM   CPT Total
--- --------------------- -------- ----- ----- -----
39    Columbia University      263   135    34   432
56     Cornell University      234    89     0   323
158   New York University      134     0     0   134
185 Binghamton University      112     0     0   112
--- --------------------- -------- ----- ----- -----
           Total Students      743   224    34  1001

Sources: U.S. Immigration and Customs Enforcement,
         2017 Top 200 Employers for Pre- and Post-Completion OPT Students,
         2017 Top 200 Employers for STEM OPT Students,
         2017 Top 200 Employers for CPT Students

Census Data for Computer Software Developers in New York in 1980-2017

Percent of Computer Software Developers in New York, grouped by BIRTHPLACE and SEX: 1980-2017

Computer software developers (229): 1980-2017, grouped by BIRTHPLACE_TECH and SEX_M_F, STATE=NY (percent)

  Year  Count U.S._Born_M U.S._Born_F India_M India_F China_M China_F Other_M Other_F
1 1980 29,020        59.9        25.2     0.3     0.3     1.4     1.2     8.2     3.4
2 1990 54,932        53.3        25.5     1.3     0.3     2.8     1.6     9.5     5.6
3 2000 83,640        48.8        16.2     3.5     0.9     3.7     2.3    17.9     6.8
4 2010 67,675        50.7        12.5     6.3     0.8     3.5     2.3    19.6     4.4
5 2017 92,198        52.9        11.2     6.6     1.7     4.8     1.2    18.1     3.5

URL parameters (short)=
?minyear=1980&STATE=NY&geo=NATION&occ=Computer%20software%20developers%20(229)&group=BIRTHPLACE_TECH|SEX_M_F

Percent of Computer Software Developers in New York, grouped by CITIZENSHIP and SEX: 1980-2017

Computer software developers (229): 1980-2017, grouped by CTZNSHP and SEX_M_F, STATE=NY (percent)

  Year  Count Non.ctzn_M Non.ctzn_F Naturlzd_M Naturlzd_F U.S._Brn_M U.S._Brn_F
1 1980 29,020        5.0        2.5        4.5        2.4       60.4       25.3
2 1990 54,932        6.8        2.9        5.8        4.5       54.2       25.6
3 2000 83,640       12.3        4.5       12.0        5.4       49.5       16.4
4 2010 67,675       13.1        1.3       14.8        5.8       52.2       12.8
5 2017 92,198       14.1        2.9       14.3        3.4       54.0       11.2

URL parameters (short)=
?minyear=1980&STATE=NY&geo=NATION&occ=Computer%20software%20developers%20(229)&group=CTZNSHP|SEX_M_F

Percent of Computer Software Developers in New York, grouped by RACE: 1980-2017

Computer software developers (229): 1980-2017, grouped by RACE, STATE=NY (percent)

  Year  Count White Black AmIndian Chinese Japanese OthAsian OthRace TwoRace X3.Races
1 1980 29,020  87.5   6.5      0.1     3.8      0.3      1.8     0.1      NA       NA
2 1990 54,932  80.3   8.1      0.0     6.2      0.5      3.5     1.4      NA       NA
3 2000 83,640  75.6   5.6      0.1     7.4      0.3      7.4     2.1     1.3      0.1
4 2010 67,675  77.1   2.7      0.3     7.3      0.4     10.0     0.7     1.4      0.2
5 2017 92,198  68.8   6.0       NA     9.1      0.6     12.1     1.8     1.2      0.4

URL parameters (short)=
?minyear=1980&STATE=NY&geo=NATION&occ=Computer%20software%20developers%20(229)&group=RACE

Percent of All Workers in New York, grouped by RACE: 1980-2017

All (0-999): 1980-2017, grouped by RACE, STATE=IL (percent)

  Year     Count White Black AmIndian Chinese Japanese OthAsian OthRace TwoRace X3.Races
1 1980 2,745,020  88.1   9.5      0.1     0.3      0.2      1.5     0.2      NA       NA
2 1990 3,233,286  84.7  10.4      0.2     0.5      0.3      2.2     1.8      NA       NA
3 2000 3,568,454  80.9  10.6      0.2     0.8      0.2      3.3     2.6     1.3      0.1
4 2010 5,925,231  76.9  11.0      0.2     1.0      0.1      3.9     5.7     1.1      0.1
5 2017 6,268,573  74.1  11.6      0.2     1.0      0.1      4.7     6.3     1.8      0.2

URL parameters (short)=
?minyear=1980&STATE=IL&geo=NATION&occ=All%20(0-999)&group=RACE

All (0-999): 1980-2017, grouped by RACE, STATE=NY (percent)

  Year     Count White Black AmIndian Chinese Japanese OthAsian OthRace TwoRace X3.Races
1 1980 4,382,960  87.4   9.9      0.1     0.8      0.2      1.2     0.3      NA       NA
2 1990 5,291,655  80.7  12.1      0.2     1.5      0.3      2.4     2.8      NA       NA
3 2000 5,339,864  76.0  11.7      0.3     2.2      0.3      3.5     3.8     2.1      0.1
4 2010 8,917,687  68.5  13.8      0.4     3.1      0.3      4.4     7.7     1.8      0.2
5 2017 9,659,896  65.2  14.4      0.3     3.8      0.2      5.1     8.3     2.3      0.3

Percent of Computer Software Developers in New York, grouped by HISPAN: 1980-2017

Computer software developers (229): 1980-2017, grouped by HISPAN, STATE=NY (percent)

  Year  Count NotHisp Mexican PuertoRico Cuban Other
1 1980 29,020    95.7      NA        2.1   0.6   1.7
2 1990 54,932    95.8     0.2        1.6   0.6   1.8
3 2000 83,640    95.5     0.4        1.4   0.3   2.4
4 2010 67,675    97.6      NA        1.0   0.0   1.3
5 2017 92,198    93.2     1.0        1.6   0.4   3.9

URL parameters (short)=
?minyear=1980&STATE=NY&geo=NATION&occ=Computer%20software%20developers%20(229)&group=HISPAN

Percent of All Workers in Colorado, grouped by HISPAN: 1980-2017

All (0-999): 1980-2017, grouped by HISPAN, STATE=NY (percent)

  Year     Count NotHisp Mexican PuertoRico Cuban Other
1 1980 4,382,960    94.7     0.1        2.7   0.5   1.9
2 1990 5,291,655    92.9     0.3        3.4   0.4   3.0
3 2000 5,339,864    91.3     0.6        3.4   0.3   4.4
4 2010 8,917,687    83.7     2.4        4.2   0.3   9.4
5 2017 9,659,896    82.1     2.3        4.5   0.4  10.8

URL parameters (short)=
?minyear=1980&STATE=NY&geo=NATION&occ=All%20(0-999)&group=HISPAN

Percent of Computer Software Developers in New York, grouped by CITIZENSHIP and SEX: 1990-2017

Computer software developers (229): 1990-2017, grouped by CTZNSHP and EDUC, STATE=NY (percent)

  Year  Count Non.ctzn_Bac. Non.ctzn_Mast Non.ctzn_Phd. Naturlzd_Bac. Naturlzd_Mast Naturlzd_Phd. U.S._Brn_Bac. U.S._Brn_Mast U.S._Brn_Phd.
1 1990 54,932           6.8           2.6           0.3           7.3           2.6           0.5          69.0           9.7           1.2
2 2000 83,640           9.9           5.6           1.3          11.5           5.2           0.7          52.9          11.2           1.7
3 2010 67,675           8.0           5.6           0.8          12.6           6.5           1.6          49.9          14.2           0.8
4 2017 92,198           7.7           8.6           0.7          11.3           5.5           0.9          49.0          14.2           2.0

URL parameters (short)=
?minyear=1990&STATE=NY&geo=NATION&occ=Computer%20software%20developers%20(229)&group=CTZNSHP|EDUC

Census Data for Computer Software Developers in New York in 2017

Percent of Computer Software Developers in New York, grouped by BIRTHPLACE and SEX, sorted by India_Male, 2017

Computer software developers (229): 2017, grouped by BIRTHPLACE_TECH and SEX_M_F, 1000 or more workers (percent)

   Year               COUNTY  Count U.S._Born_M U.S._Born_F India_M India_F China_M China_F Other_M Other_F
1  2017     Albany County NY  2,301        50.3         5.6    30.0     6.1     0.0     0.0     6.4     1.7
2  2017       Erie County NY  3,574        69.2         9.2    15.3     0.0     0.0     0.0     6.3     0.0
3  2017     Queens County NY 12,032        44.9         4.2     9.0     1.5    12.3     0.5    20.5     7.1
4  2017   Dutchess County NY  1,552        59.1        16.9     8.5     6.8     0.0     3.3     2.5     2.9
5  2017     Nassau County NY  6,180        44.8        14.3     8.2     7.9     2.2     0.7    19.6     2.3
6  2017     Monroe County NY  6,009        51.9        20.4     7.8     5.5     1.2     0.0    13.3     0.0
7  2017   New York County NY 13,179        46.9         8.3     6.5     1.3     2.7     0.5    30.4     3.4
8  2017                 (NA) 17,874        67.5        12.0     5.9     0.0     2.3     1.7     9.6     1.1
9  2017    Suffolk County NY  6,851        39.4        14.6     4.3     1.2    14.3     0.0    22.6     3.6
10 2017      Kings County NY 14,519        51.1        15.0     1.9     0.4     5.4     2.3    17.2     6.6
11 2017 Rensselaer County NY  1,438        75.2         3.3     0.0     0.0     0.0     0.0    21.5     0.0
12 2017   Richmond County NY  1,966        31.5         1.9     0.0     0.0     7.9     5.6    42.6    10.4
13 2017   Saratoga County NY  1,000        49.1        23.3     0.0     0.0     0.0     0.0    27.6     0.0

URL parameters (short)=
?STATE=NY&geo=COUNTY&occ=Computer%20software%20developers%20(229)&group=BIRTHPLACE_TECH|SEX_M_F&sortn=6&mincount=1000

Percent of Computer Software Developers in New York, grouped by CITIZENSHIP and SEX, sorted by Non.citizen_Male, 2017

Computer software developers (229): 2017, grouped by CTZNSHP and SEX_M_F, 1000 or more workers (percent)

   Year               COUNTY  Count Non.ctzn_M Non.ctzn_F Naturlzd_M Naturlzd_F U.S._Brn_M U.S._Brn_F
1  2017     Albany County NY  2,301       34.6        6.1        1.8        1.7       50.3        5.6
2  2017   New York County NY 13,179       31.1        3.5        7.9        1.6       47.5        8.3
3  2017   Saratoga County NY  1,000       27.6        0.0        0.0        0.0       49.1       23.3
4  2017    Suffolk County NY  6,851       19.6        2.9       18.0        1.9       43.0       14.6
5  2017       Erie County NY  3,574       19.0        0.0        2.6        0.0       69.2        9.2
6  2017     Queens County NY 12,032       15.0        1.1       26.9        8.0       44.9        4.2
7  2017     Monroe County NY  6,009       14.5        3.3        4.3        2.2       55.3       20.4
8  2017                 (NA) 17,874        9.2        2.3        7.7        0.4       68.3       12.0
9  2017      Kings County NY 14,519        6.4        4.4       17.8        4.9       51.5       15.0
10 2017     Nassau County NY  6,180        6.3        4.6       21.4        6.3       47.2       14.3
11 2017 Rensselaer County NY  1,438        1.7        0.0       19.7        0.0       75.2        3.3
12 2017   Dutchess County NY  1,552        0.0        6.8       11.0        6.2       59.1       16.9
13 2017   Richmond County NY  1,966        0.0        0.0       50.5       16.0       31.5        1.9

URL parameters (short)=
?STATE=NY&geo=COUNTY&occ=Computer%20software%20developers%20(229)&group=CTZNSHP|SEX_M_F&sortn=4&mincount=1000

Percent of Computer Software Developers in New York, grouped by CITIZENSHIP and SEX, sorted as above, 1990

Computer software developers (229): 1990, grouped by CTZNSHP and SEX_M_F (percent)

   Year                COUNTY Count Non.ctzn_M Non.ctzn_F Naturlzd_M Naturlzd_F U.S._Brn_M U.S._Brn_F
16 1990      Albany County NY 1,463        0.0        1.7        1.6        1.7       55.2       39.8
5  1990    New York County NY 4,923       10.1        3.1        6.9        7.6       53.0       19.4
23 1990    Saratoga County NY   466        0.0        0.0        4.3        0.0       38.4       57.3
13 1990     Suffolk County NY 3,773        3.6        3.9        3.2        2.0       62.2       25.2
14 1990        Erie County NY 2,102        1.1        2.9        2.0        0.0       57.4       36.6
1  1990      Queens County NY 5,975       19.7        5.2       14.8        8.2       38.2       13.9
   1990      Monroe County NY  (missing)
15 1990                  (NA) 9,887        0.4        1.9        2.6        2.1       62.5       30.5
3  1990       Kings County NY 6,753       10.9        3.8       13.4        9.5       43.6       18.8
11 1990      Nassau County NY 4,267        4.6        1.3        4.4        5.7       57.6       26.3
22 1990  Rensselaer County NY   640        0.0        0.0        0.0        0.0       54.5       45.5
   1990    Dutchess County NY  (missing)
2  1990    Richmond County NY 1,782       13.5        2.5        7.5        7.0       44.1       25.4

URL parameters (short)=
?minyear=1990&maxyear=1990&STATE=NY&geo=COUNTY&occ=Computer%20software%20developers%20(229)&group=CTZNSHP|SEX_M_F&sortn=4&mincount=0

Percent of Computer Software Developers in New York, grouped by CITIZENSHIP and EDUCATION, sorted by Non.citizen_Bachelor, 2017

Computer software developers (229): 2017, grouped by CTZNSHP and EDUC, 1000 or more workers (percent)

   Year               COUNTY  Count Non.ctzn_Bac. Non.ctzn_Mast Non.ctzn_Phd. Naturlzd_Bac. Naturlzd_Mast Naturlzd_Phd. U.S._Brn_Bac. U.S._Brn_Mast U.S._Brn_Phd.
1  2017     Albany County NY  2,301          21.7          17.9           1.2           1.8           1.7           0.0          42.9           9.4           3.5
2  2017   New York County NY 13,179          16.8          16.8           1.0           4.0           5.5           0.0          33.8          19.3           2.7
3  2017    Suffolk County NY  6,851          15.6           5.9           0.9          12.0           6.9           1.0          47.1          10.4           0.0
4  2017     Queens County NY 12,032           8.7           6.7           0.6          24.1           7.6           3.1          38.7           8.8           1.5
5  2017       Erie County NY  3,574           7.2          11.8           0.0           2.6           0.0           0.0          67.7          10.7           0.0
6  2017   Dutchess County NY  1,552           6.8           0.0           0.0           2.5          11.4           3.3          54.8          21.3           0.0
7  2017     Nassau County NY  6,180           5.0           5.9           0.0          12.1          13.5           2.1          44.1          17.4           0.0
8  2017     Monroe County NY  6,009           4.8          13.0           0.0           4.8           1.7           0.0          64.2          10.4           1.0
9  2017      Kings County NY 14,519           4.7           6.1           0.0          15.4           6.8           0.6          51.0          12.4           3.1
10 2017                 (NA) 17,874           2.5           6.9           2.1           6.5           0.9           0.7          59.3          18.4           2.7
11 2017 Rensselaer County NY  1,438           1.7           0.0           0.0          12.6           7.2           0.0          69.1           9.5           0.0
12 2017   Richmond County NY  1,966           0.0           0.0           0.0          53.5          13.1           0.0          11.7          21.7           0.0
13 2017   Saratoga County NY  1,000           0.0          27.6           0.0           0.0           0.0           0.0          57.6           6.9           7.9

URL parameters (short)=
?STATE=NY&geo=COUNTY&occ=Computer%20software%20developers%20(229)&group=CTZNSHP|EDUC&sortn=4&mincount=1000

Percent of Workers Who Are Non-citizens by Occupation in New York in 2017, sorted by percent

                                                                       Non-
N                                              Occupation     Total   citizen Percent  Occ1990
-- ------------------------------------------------------ --------- --------- ------- --------
1          Transportation and Material Moving Occupations   698,383   158,850    22.7 Transprt
2                                     Construction Trades   285,604    61,219    21.4 Constrct
3                Service Occupations, including Household 1,859,703   380,041    20.4  Service
4                   Farming, Forestry, Fishing, Gardening   114,899    23,002    20.0  Farming
5                                      Natural Scientists    38,634     7,448    19.3   NatSci
6                    Operators, Fabricators, and Laborers   215,216    36,879    17.1 Operator
7                            Computer software developers    92,198    15,688    17.0  SWDevel
8                        Precision Production Occupations   147,666    18,122    12.3 Productn
9                                 Mechanics and Repairers   229,031    25,991    11.3 Mechanic
10                                      Sales Occupations   960,387    95,816    10.0    Sales
11                   Mathematical and Computer Scientists   159,591    15,329     9.6 MathComp
12                          Health Diagnosing Occupations   100,025     9,283     9.3 HlthDiag
13              Executive, Administrative, and Managerial 1,434,329   116,510     8.1  Manager
14                   Engineers, Architects, and Surveyors   113,722     8,396     7.4 Engineer
15                          Technologists and Technicians   253,576    16,654     6.6  Technol
16 Administrative Support Occupations, including Clerical 1,246,361    81,560     6.5 AdminSup
17         Teachers, Librarians, Archivists, and Curators   766,555    44,581     5.8  Teacher
18               Health Assessment & Treating, Therapists   311,987    15,747     5.0 HlthCare
19           Social Scientists, Urban Planners, Religious   203,941    10,087     4.9   SocSci
20                                     Lawyers and Judges   120,411     4,045     3.4   Lawyer
21                                   Military Occupations    25,825         0     0.0 Military
-- ------------------------------------------------------ --------- --------- ------- --------
                                           Total Employed 9,659,896 1,172,582    12.1    Total

Source for Census Data

U.S. Census Data available at IPUMS USA - using the following default sample from each year:

Most Recent Trade Adjustment Assistance (TAA) Data for New York

        TAW                                   Company                Location    Decision  Workers  Reasons why you believe that separations that have occurred
0     95014            Delphi Powertrain Technologies      West Henrietta, NY         NaN       25  Product design engineering and engineering support of global manufacturing transferred to the EU (France, Romania), China & Mexico. (global automotive components)
1     95012                   Frontier Communications             Norwich, NY         NaN        5  Positions contracted to Nokia. Nokia has a global presence. (Mid-Management - telecommunications)
2     95009              The Worth Collection Limited            New York, NY         NaN        7  We were told our jobs are now being outsourced to another country. (clothing company)
3     95001  Shop-Vac dba Felchar Manufacturing Corpo          Binghamton, NY         NaN      394  Worker indicates he was pulling parts for shipping out to Vietnam and China. Worker's Title: Asia Shipper. (Electric Motors, Power Cords, Custom Stamped Parts) 
4     94995                          John Hassell LLC            Westbury, NY         NaN       39
5     94963                                Altice USA            Bethpage, NY         NaN        3  (+90 in Jericho, NY) Call centers that perform technical support, billing, & field service. The work has been sent to the Dominican Republic & South Africa.
6     94944                                       AIG            New York, NY   7/28/2019      600  Workers positions are outsourced to India and Philippines. (Corporate and Investments IT)
7     94924                                  WestRock           Amsterdam, NY         NaN       57
8     94848                      David's Bridal, Inc.            New York, NY   7/22/2019      ~24  Sample Making was Transferred Overseas. (Bridal Dresses)
9     94839                         Xerox Corporation             Webster, NY    8/5/2019       10  Services have been / are being shifted to a foreign country. (Creative Services - collaterals)
10    94835          Citizens Telecom Services Co LLC           Rochester, NY    7/5/2019      268  Some of the work will be taken over by a vendor called IBEX. IBEX utilizes international call centers. (internet service call center)
11    94834                             Emblem Health            New York, NY         NaN       35  Services performed by the work group have been outsourced to India. (Computer Operators - Health Insurance)
12    94824               AIG Employee Services, Inc.            New York, NY         NaN      400  (+200 in NJ) Workers positions are outsourced to India and Philippines. (AIG Corporate Function and IT Tech)
13    94812    Premier Aviation Overhaul Center, Ltd.                Rome, NY         NaN      127  Production has been shifted to a foreign country-Canada. (Aircraft Manufacturer and Repair)
14    94794         American Technical Ceramics Corp.  Huntington Station, NY   5/30/2019       20  Most production has already moved to Mexico. A small amount will move to SC. The rest, professional & office staff in NY will be laid off.
15    94776                           Thomson Reuters           Rochester, NY   5/24/2019      317  Most of the positions, including most of the technology titles and all of the non-attorney publishing titles, will be moving to Bangalore and Hyderabad, India.
16    94767                              Health First            New York, NY         NaN        3  Business Analyst work supported the call center operations and has been outsourced. Quality Assurance work has been transferred to workers in India.
17   94748A               The Bank of New York Mellon            New York, NY   5/22/2019       12  The work that we provided can be done in Pune, India for approx 20 percent of our salaries. (Credit Underwriting)
18    94747                         Xerox Corporation             Webster, NY   5/22/2019       30  Centralized Business Services non-exempt positions were outsourced to Guatemala City, Guatemala. We trained Guatemala employees thru web-x and/or in person.
19    94740  Associated Spring, a Business of Barnes             Syracuse, NY    5/6/2019       75  Company supplies components to GM, Ford, & NASCAR. Plant closed on 06/29/18 due to foreign competition. Some jobs went to Mexico, Singapore & elsewhere in US.
20    94711                  Helmut Lang New York LLC            New York, NY   5/30/2019       30  Services are being outsourced to China and Cambodia. (Clothing Design & production)
21    94710        Claims Recovery Financial Services              Albion, NY         NaN       23  A contract was lost to an overseas company resulting in 23 layoffs. (claims recovery specialists)
22    94666                                Tahari ASL            New York, NY   5/24/2019      150  Sample Making was Transferred Overseas. (Sewinq and sample of Fashion Design)
23    94605                            Ingersoll Rand         Cheektowaga, NY   4/14/2019        ?  (190 crossed out) Substantial production is shifting to Italy & China. (hourly members of International Assoc of Machinists & Aerospace Workers)
24    94595           The Travelers Indemnity Company              Elmira, NY   3/20/2019       18  Workers supported offshore vendor partners, including answering questions about policy, training new associates, & quality checking offshore work.
25   94578C                       AT&T Services, Inc.            Syracuse, NY    7/1/2019       50  Over 40 call centers closed in past 7 years. AT&T is looking to expand Mexico center from 1,000 to 5,000 workers. Also has centers in Philippines & Caribbean.
26    94574                         Hanesbrands, Inc.            New York, NY   3/18/2019      ~28  (Sample Maker of Fashion Design)
27    94568                         Xerox Corporation             Webster, NY   4/14/2019       30  Centralized Business Services non-exempt positions were outsourced to Guatemala City, Guatemala. We trained Guatemala employees thru web-x and/or in person.
28   94555A           MACOM Technology Solutions Inc.              Ithaca, NY   6/26/2019       75  Company layoff to a lack of sales and economy in a competitive global market.
29    94555           MACOM Technology Solutions Inc.              Ithaca, NY   6/26/2019        "  "
30    94546                                  Gunlocke             Wayland, NY         NaN       98  "
31    94538                         ABC-I Corporation              Dexter, NY   3/21/2019       21  Production was moved to the Dominican Republic. (Swimwear)
32    94536                         CSC Holdings, LLC            Bethpage, NY   4/12/2019        5  Outsourcing described in TAW #94183 (below) may have impacted the discharge of about 5 Human Resources personnel.
33    94533                                Stream, NY           Watertown, NY    4/7/2019      117  The contract for the call center is being shifted to El Salvador.
34    94530                       Jabil Circuit, Inc.           Rochester, NY    3/8/2019        3  Petition 92639 for 183 jobs moved to Mexico expires 4/13/19. This is for 3 workers who were extended. (nypro inc, the fountain group, adecco workers)
35    94524  FullBeauty Brands Management Services, L            New York, NY   6/26/2019        7  Services were outsourced to the Philippines. ( Image Processing and Retouching)
36    94521                         Xerox Corporation             Webster, NY    4/7/2019        4  Project Managers. Duties include maintaining databases, coordination with other departments & the tracking of projects. These duties were sent to Guatemala.
37    94520                               Pfizer Inc.        Rouses Point, NY    5/7/2019     1200  Work related to site products will be transferred outside of the U.S. including to Canada & Ireland. Approved petitions 64489, 74961, 82502, 85859 & 94622.
38    94507                            Afgritech, LLC           Watertown, NY   2/14/2019        3  The current ongoing low milk price and the current trade war with China.
39    94488                                 IBM, Inc.            Endicott, NY    4/5/2019  (blank)  Trained replacement in India and laid off. (Project Management)
40    94483                         Xerox Corporation             Webster, NY   3/28/2019       94  Worker told by people who are still there that some of the jobs went to India. May also be contractors effected. (PDW2 Data Warehouse, Business Systems Analysts)
41    94482                         Xerox Corporation             Webster, NY   3/28/2019       30  Finance Department functions were sent to Philippines and Guatemala. Included monthly close out reports, financial planning & analysis & account payable.
42    94480                  Globe Metallurgical Inc.       Niagara Falls, NY   2/12/2019       97
43    94476      AXA Equitable Life Insurance Company            Syracuse, NY   3/12/2019       11  Workers who worked in the Customer Service Department that performed the group pension duties, those jobs were sent to India.
44    94464                   N.Y.C. Motorcycles Inc.    Long Island City, NY    5/9/2019        5
45    94461                               Aptos, Inc.            Newburgh, NY   1/28/2019      100  The functions of the call center were sent to the Philippines. The call center helped retailers troubleshoot software issues.
46    94458                                 IBM, Inc.              Armonk, NY    2/1/2019        6  CDI contractors laid off & their duties moved to IBM employees in India. CDI employees trained these workers prior to layoff. (Cloud Migration Factory PM)
47    94421  HSBC Technology and Services, USA (HTSU)               Depew, NY   2/11/2019
48    94416                   New Era Cap Corp., Inc.               Derby, NY   2/11/2019
49    94413                            Citibank, N.A.           Uniondale, NY   2/20/2019
50    94399                  Windstream Services, LLC            Fairport, NY   2/13/2019
51    94391                           CA Technologies            New York, NY   1/15/2019
52   94385A                    Openlink Financial LLC            New York, NY   2/15/2019
53    94385                    Openlink Financial LLC           Uniondale, NY   2/15/2019
54   94348A                   Carestream Health, Inc.           Rochester, NY   6/25/2019
55    94348                   Carestream Health, Inc.           Rochester, NY   6/25/2019
56    94337     Integrated Medical Professionals PLLC            Melville, NY   4/19/2019
57    94330                     Leuze electronic Inc.            Fairport, NY  12/12/2018
58    94324                Bak USA Technologies Corp.             Buffalo, NY   1/14/2019
59    94317                      Harden Furniture LLC     McConnellsville, NY    5/9/2019
60   94257A                    AIG Technologies, Inc.            New York, NY    1/8/2019
61    94183                         CSC Holdings, LLC            Bethpage, NY  10/25/2018       10  Services are being outsourced to a company called Qualfon in the Philippines. (Call Center Workforce Management/Traffic Team)
62    94151  HSBC Technology and Services, USA (HTSU)             Buffalo, NY   12/6/2018
63    94149                GlobalFoundries U.S., Inc.               Malta, NY         NaN
64    94139                         Kodak Alaris Inc.           Rochester, NY   12/6/2018
65    94128                                ELC Beauty            New York, NY   11/1/2018
66    94097                        Apollo Medical, PC            Brooklyn, NY   11/8/2018
67    94083                             Hologic, Inc.          Hicksville, NY   9/18/2018
68    94081                  Finastra USA Corporation            New York, NY   9/24/2018
69    94071          Prestolite Electric Incorporated              Arcade, NY   9/17/2018
70    94062                   Xerox Business Services             Webster, NY   9/18/2018
71    94052                  General Electric Company         Schenectady, NY   9/12/2018
72   94017A        Aspen Insurance U.S. Services Inc.            New York, NY   11/1/2018
73   94012A        Aspen Insurance U.S. Services Inc.            New York, NY   8/29/2018
74    94008                  Advanced Motors & Drives       East Syracuse, NY  10/31/2018
75    93992                     IMAX (Rochester) Inc.           Rochester, NY   10/3/2018
76    93983  Wells Fargo Home Lending Retail Fulfillm           Pittsford, NY  12/27/2018
77   93967B                                KeyBank NA             Buffalo, NY   8/24/2018
78   93967C                                KeyBank NA              Albany, NY   8/24/2018
79    93918                               Lexis Nexis              Albany, NY    1/9/2019
80    93908  Travel Impressions, Ltd./Apple Vacations         Farmingdale, NY   7/19/2018
81    93903                  Thermo Fisher Scientific           Rochester, NY   7/23/2018
82    93902      Sutherland Healthcare Solutions Inc.            Syracuse, NY    9/4/2018
83    93855                  Nucor Steel Auburn, Inc.              Auburn, NY   6/22/2018
84    93815                rag & bone Industries, LLC            New York, NY   6/21/2018
85    93809        NorthEast Provider Solutions, Inc.           Hawthorne, NY    8/5/2018
86    93784                         Eaton Corporation          Horseheads, NY   6/21/2018
87    93768                             Woolrich, Inc            New York, NY   6/14/2018
88    93767                    HEIDENHAIN Corporation           Jamestown, NY   6/14/2018
89    93755                           AVX Corporation               Olean, NY    5/1/2018
90    93749                  Traxys North America LLC            New York, NY   6/21/2018
91    93748                       Milward Alloys Inc.            Lockport, NY  10/25/2018
92    93745                                 CCMA, LLC             Amherst, NY   6/12/2018
93    93741                           Thomson Reuters            New York, NY   5/10/2018
94    93731                                    GE MDS           Rochester, NY    1/9/2019
95   93726D                        Lonza America Inc.           Rochester, NY   5/18/2018
96    93717                                Jabil Inc.        Poughkeepsie, NY   10/5/2018
97    93713               Hudson Technologies Company         Pearl River, NY   6/14/2018
98    93659                          Sykes Enterprise             Amherst, NY         NaN
99    93650                  Sumitomo Rubber USA, LLC           Tonawanda, NY   6/25/2018
100  93645A                   Telephonics Corporation         Farmingdale, NY    9/4/2018
101   93645                   Telephonics Corporation          Huntington, NY    9/4/2018
102   93644              Greenwich Associates US Inc.         Cheektowaga, NY   5/18/2018
103  93637B  Optum Operations/Population Health Manag           Tonawanda, NY   4/16/2018
104   93614                                     Xylem        Seneca Falls, NY   4/20/2018
105   93538                           Thomson Reuters            New York, NY   4/20/2018
106   93537          Sarder Inc., DBA NetCom Learning            New York, NY   3/16/2018
107   93510        Transact Technologies Incorporated              Ithaca, NY   4/26/2018
108   93506              AIG PC Global Services, Inc.            New York, NY   4/26/2018
109   93477               TitanX Engine Cooling, Inc.           Jamestown, NY    3/8/2018
110   93432                              Monofrax LLC            Falconer, NY   4/26/2018
111   93423                               GE MDS, LLC           Rochester, NY   3/22/2018
112   93410          Sutherland Global Services, Inc.            Syracuse, NY    4/6/2018
113   93408                       Sanmina Corporation               Owego, NY   4/25/2018
114   93396                           Thomson Reuters            New York, NY   3/30/2018
115   93385                         Xerox Corporation           Rochester, NY   2/15/2018
116   93362                                    Adecco       Hoosick Falls, NY  12/27/2017
117   93358  HSBC Bank Technology and Services, USA (            New York, NY   2/13/2018
118   93346                    Alstom Signaling, Inc.      West Henrietta, NY   2/12/2018
119   93328                Altice Media Solutions LLC            Woodbury, NY    2/4/2018
Source: U.S. Department of Labor, Trade Adjustment Assistance (TAA) data

Other Related Data for New York

Worker Adjustment and Retraining Notification

H-1B and Related Data by State
H-1B Data
OPT Data