On April 3, 2017, the job search company Glassdoor posted an article titled "Dispelling Myths: What H1B Visa Workers Are Really Paid". It was written by their Chief Economist, Dr. Andrew Chamberlain and mentions that a new study from the National Bureau of Economic Research and that "it was widely reported in media as showing H1B visas hurt wages for American workers." It goes on to describe its own study as follows:
To answer this, we looked at a large sample of salaries from H1B visa applications and compared them to similar U.S. salaries reported on Glassdoor. We looked at the most recent year available - federal fiscal year 2016 - and focused on 10 major U.S. cities, comparing pay for U.S. and foreign H1B workers for the same job titles.
The bottom line: Across the 10 cities and roughly 100 jobs we examined, salaries for foreign H1B workers are about 2.8 percent higher than comparable U.S. salaries on Glassdoor. While it may be true that an influx of H1B workers in the 1990s hurt computer science wages, there's no evidence in the data on Glassdoor that H1B workers today represent a source of "cheap" labor paid any lower than comparable U.S. workers.
Following are some problems with the Glassdoor study:
There is a brief description of a regression that Glassdoor did on the H1B and Glassdoor data. However, the only data that is supplied are the median salaries for 12 selected job titles in 10 cities. Even this data cannot be cut and paste into a spreadsheet. It is presented in png images and must be manually reentered. In any event, the Glassdoor data appears to be private data. Much of it may or may not be viewable on their site but there is no way to view or verify all of the data. The H1B data, however, does appear to come from this file of 2016 H-1B disclosure data on the Department of Labor website. It was, in fact, possible to reproduce many of the H-1B salary numbers. However, it was apparent that the numbers for the job categories were obtained by searching the field JOB_TITLE instead of the standardized field SOC_NAME. You can see a list of the 2018 Standard Occupational Classification (SOC) system at this link.
Because of the non-standard job titles, it was only possible to match up 5 of the 12 Glassdoor Job Titles with BLS Job Titles. However, the following table shows that this includes the two categories, Programmer Analyst and Software Engineer, that make up a majority of the jobs listed in the H-1B Labor Condition Applications (LCAs).
                                                         Total H1B   Total H1B
Glassdoor Job Title  BLS Job Title                            LCAs     Workers
-------------------  ---------------------------------  ----------  ----------
Project Manager      NA                                     10,890      19,162
Program Manager      NA                                      1,850       3,410
Professor            NA                                      7,657       7,742
Risk Manager         NA                                        110        141

Data Scientist       NA                                      1,321       1,555
Financial Analyst    Financial Analyst                       2,048       3,537
Programmer Analyst   Computer Systems Analyst               57,477      81,453
Software Engineer    Software Developers, Applications      47,176      83,946

Business Analyst     NA                                     11,884      20,048
Graphic Designer     Graphic Designer                          863       1,340
Java Developer       NA                                      3,112       3,377
Web Developer        Web Developer                           1,023       1,682

Note: NA denotes a Glassdoor Job Title that has no BLS Job Title equivalent
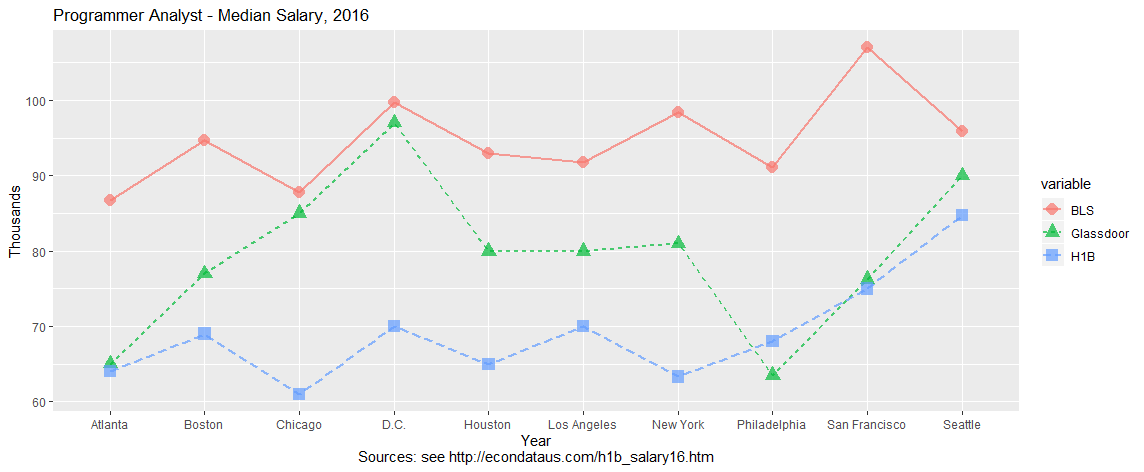
The following three graphs and tables show that the median salaries of the two major job categories (Programmer Analyst and Software Engineer) and Financial Analyst. They show H-1B workers making lower median salaries in all 10 cities. The difference between U.S. and H-1B median wages are less clear in the last two job categories (Graphic Designer and Web Developer) but the above table shows that these categories make up a much smaller percentage of the H-1B LCAs.
Programmer Analyst - Median Salary, 2016

          City     BLS Glassdoor    H1B
       Atlanta  86,694    65,000 64,043
        Boston  94,682    77,000 69,000
       Chicago  87,776    85,000 61,000
       Houston  92,934    80,000 65,000
   Los Angeles  91,832    80,000 70,000
      New York  98,426    81,000 63,300
  Philadelphia  91,166    63,500 68,037
 San Francisco 106,995    76,250 75,000
       Seattle  95,909    90,000 84,739
          D.C.  99,757    97,000 70,000
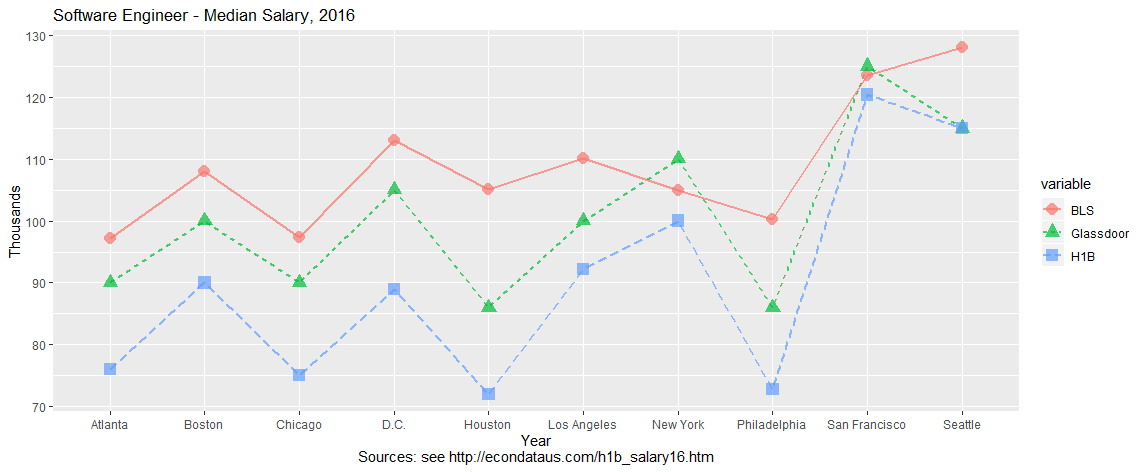
Software Engineer - Median Salary, 2016

          City     BLS Glassdoor     H1B
       Atlanta  97,178    90,000  76,000
        Boston 107,931   100,000  90,000
       Chicago  97,302    90,000  75,000
       Houston 105,165    86,000  72,000
   Los Angeles 110,053   100,000  92,153
      New York 104,936   110,000 100,000
  Philadelphia 100,214    86,000  72,800
 San Francisco 123,490   125,000 120,390
       Seattle 127,982   115,000 115,000
          D.C. 113,027   105,000  88,950
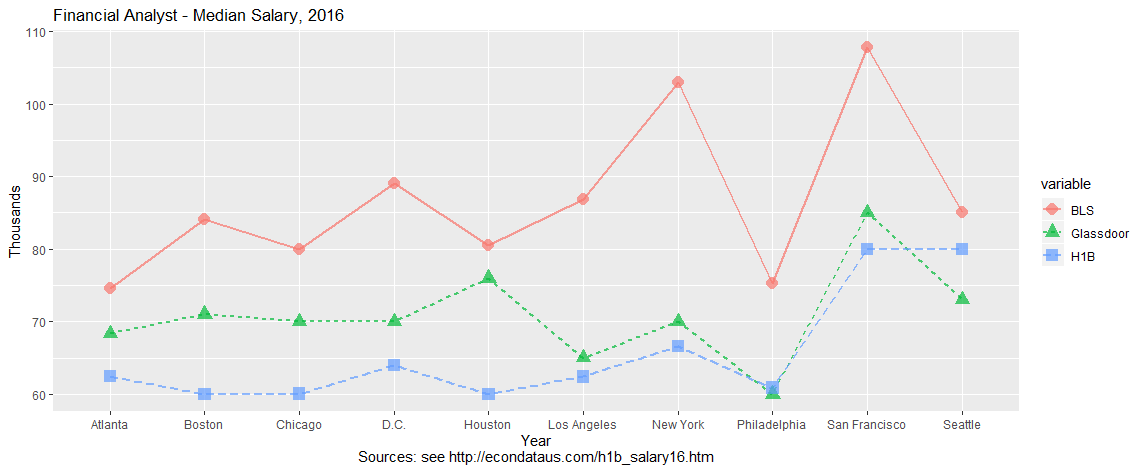
Financial Analyst - Median Salary, 2016

          City     BLS Glassdoor    H1B
       Atlanta  74,610    68,350 62,500
        Boston  84,094    71,000 60,000
       Chicago  79,893    70,000 60,042
       Houston  80,475    76,000 60,000
   Los Angeles  86,840    65,000 62,400
      New York 103,022    70,000 66,560
  Philadelphia  75,234    60,000 60,850
 San Francisco 107,744    85,000 80,000
       Seattle  85,114    73,000 80,000
          D.C.  89,024    70,000 64,000
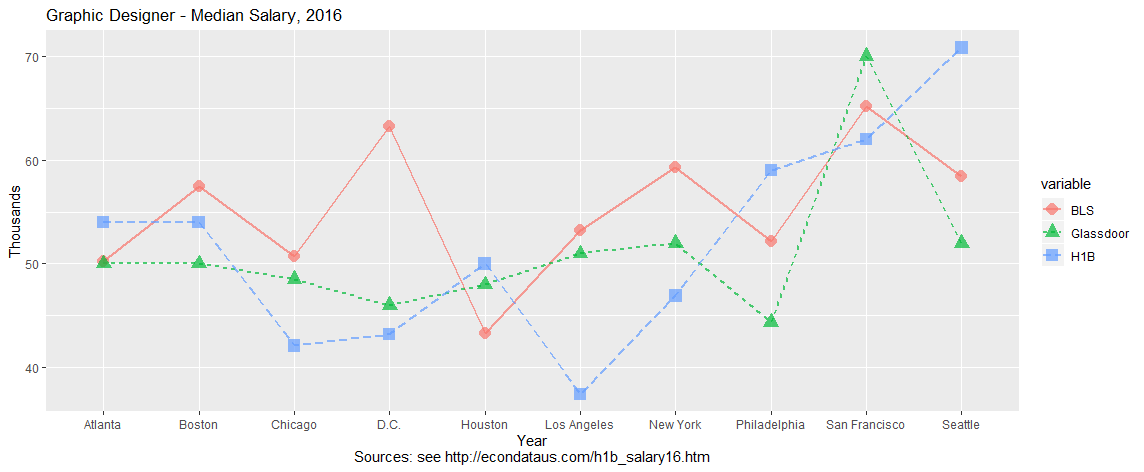
Graphic Designer - Median Salary, 2016

          City    BLS Glassdoor    H1B
       Atlanta 50,253    50,000 54,000
        Boston 57,470    50,000 54,000
       Chicago 50,690    48,500 42,099
       Houston 43,347    48,000 50,000
   Los Angeles 53,227    51,000 37,440
      New York 59,322    52,000 46,920
  Philadelphia 52,125    44,360 59,000
 San Francisco 65,208    70,000 62,000
       Seattle 58,386    52,000 70,824
          D.C. 63,253    46,000 43,175
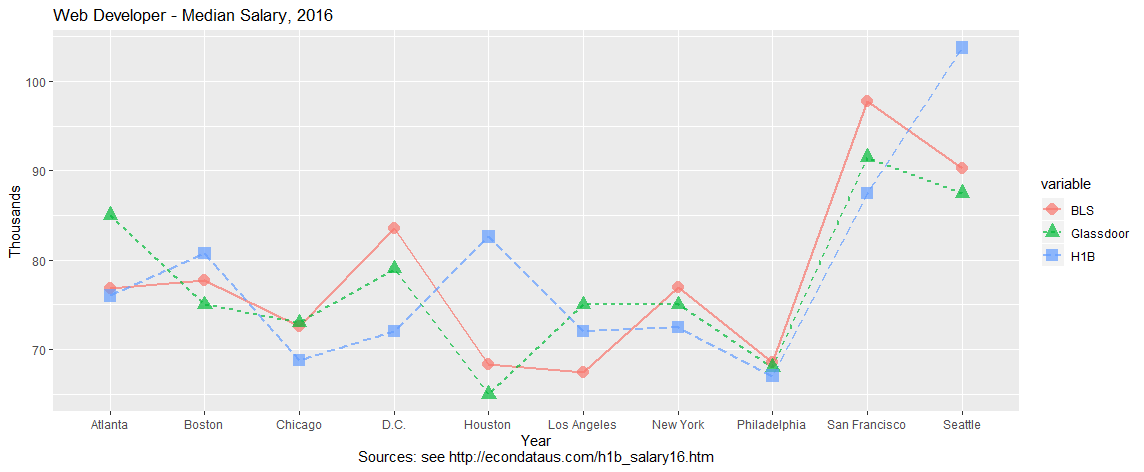
Web Developer - Median Salary, 2016

          City    BLS Glassdoor     H1B
       Atlanta 76,814    85,000  76,000
        Boston 77,750    75,000  80,766
       Chicago 72,550    73,000  68,800
       Houston 68,390    65,000  82,618
   Los Angeles 67,413    75,000  72,000
      New York 76,939    75,000  72,500
  Philadelphia 68,536    68,000  67,038
 San Francisco 97,739    91,500  87,495
       Seattle 90,272    87,500 103,755
          D.C. 83,512    79,000  72,000
Glassdoor and H1B numbers:
Dispelling Myths: What H1B Visa Workers Are Really Paid - Glassdoor Economic Research
BLS numbers for May 2016:
Atlanta-Sandy Springs-Roswell, GA
Boston-Cambridge-Nashua, MA-NH
Chicago-Naperville-Elgin, IL-IN-WI
Houston-The Woodlands-Sugar Land, TX
Los Angeles-Long Beach-Anaheim, CA
New York-Newark-Jersey City, NY-NJ-PA
Philadelphia-Camden-Wilmington, PA-NJ-DE-MD
San Francisco-Oakland-Hayward, CA
Seattle-Tacoma-Bellevue, WA
Washington-Arlington-Alexandria, DC-VA-MD-WV