On April 3, 2017, the job search company Glassdoor posted an article titled "Dispelling Myths: What H1B Visa Workers Are Really Paid". It was written by their Chief Economist, Dr. Andrew Chamberlain and mentioned that a then new study from the National Bureau of Economic Research and that "it was widely reported in media as showing H1B visas hurt wages for American workers." It went on to describe its own study as follows:
To answer this, we looked at a large sample of salaries from H1B visa applications and compared them to similar U.S. salaries reported on Glassdoor. We looked at the most recent year available - federal fiscal year 2016 - and focused on 10 major U.S. cities, comparing pay for U.S. and foreign H1B workers for the same job titles.
The bottom line: Across the 10 cities and roughly 100 jobs we examined, salaries for foreign H1B workers are about 2.8 percent higher than comparable U.S. salaries on Glassdoor. While it may be true that an influx of H1B workers in the 1990s hurt computer science wages, there's no evidence in the data on Glassdoor that H1B workers today represent a source of "cheap" labor paid any lower than comparable U.S. workers.
This page describes problems with the 2016 study. One problem was that it categorized the H-1B jobs using the JOB_TITLE field rather than the standarized SOC_NAME field. Also, the data is now 3 years older than the latest available data. The following uses the standardized SOC_NAME field to compare the H-1B salaries with Bureau of Labor Statistics (BLS) salaries for U.S. workers and uses the latest available data from 2019.
The following table shows the 15 job categories with the most Labor Condition Applications (LCAs) in 2019 and lists their names in the H-1B and BLS system, along with the number of H-1B Labor Condition Applications (LCAs) and total workers requested for each category:
Total H1B  Total H1B
  Workers       LCAs                                H1B SOC_NAME    Bureau of Labor Statistics
---------  ---------  ------------------------------------------    -----------------------------------------------------------------------
   640540     194060           SOFTWARE DEVELOPERS, APPLICATIONS    Software Developers and Software Quality Assurance Analysts and Testers
   422613      51200             COMPUTER OCCUPATIONS, ALL OTHER    Computer Occupations, All Other
    40593      40593                    COMPUTER SYSTEMS ANALYST    Computer Systems Analysts
   288982      28315       SOFTWARE DEVELOPERS, SYSTEMS SOFTWARE    NA
    53864      28097                   COMPUTER SYSTEMS ANALYSTS    (combined with Computer Systems Analysts above)
    23592      14799                        COMPUTER PROGRAMMERS    Computer Programmers
    26839      10799                OPERATIONS RESEARCH ANALYSTS    Operations Research Analysts
    26026      10337                        MECHANICAL ENGINEERS    Mechanical Engineers
    15210      10160                    ACCOUNTANTS AND AUDITORS    Accountants and Auditors
    19457       9328                         MANAGEMENT ANALYSTS    Management Analysts
    11975       8560                          FINANCIAL ANALYSTS    Financial and Investment Analysts, Financial Risk Specialists, and Financial Specialists, All Other
    43376       8544    COMPUTER AND INFORMATION SYSTEMS MANAGER    Computer and Information Systems Managers
    50493       8340                               STATISTICIANS    Statisticians
    11641       8107                     DATABASE ADMINISTRATORS    Database Administrators and Architects
    17423       7316                        ELECTRICAL ENGINEERS    Electrical Engineers

Note: NA denotes a Glassdoor Job Title that has no BLS Job Title equivalent
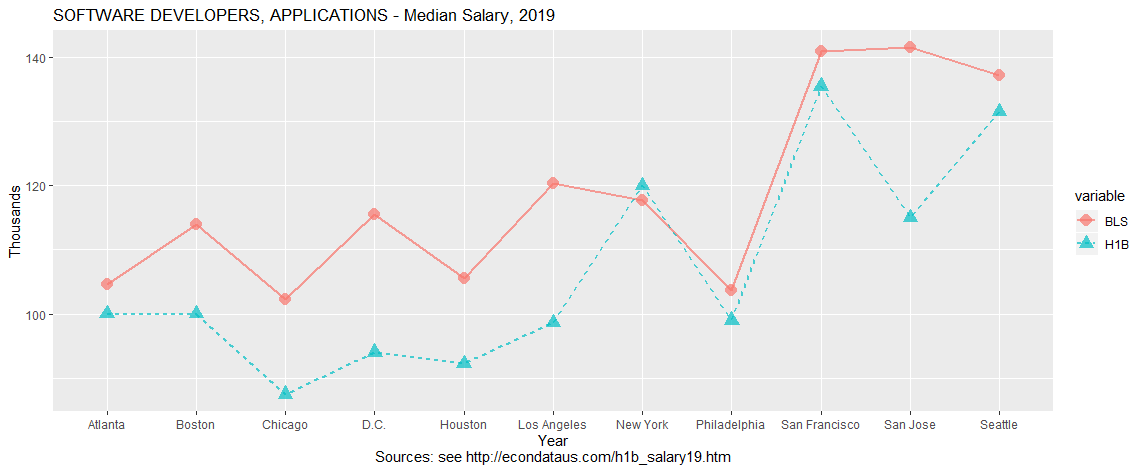
The following three graphs and tables show that the median salaries of three major specific job categories (Software Developers, Computer Systems Analysts, and Computer Programmers). For those and the following job category (Accountants and Auditors), H-1B workers appear to earn less in 40 out of 43 cases. In those three cases, they made about the same or slightly more. H-1B workers also appeared to generally make less for the last two job categories (computer & information systems manager and electrical engineer) though the difference is not quite so clear. In any case, there doesn't seem to be anything in the data that supports the conclusion of the 2016 Glassdoor report that "H1B Visa Workers Earn 2.8 Percent More than Comparable U.S. Workers". On the contrary, it seems that H1B Visa Workers generally make less, at least the median workers.
SOFTWARE DEVELOPERS, APPLICATIONS - Median Salary, 2019

            City     BLS     H1B  LCAs
1        Atlanta 104,562 100,000   368
2         Boston 113,963 100,000 1,865
3        Chicago 102,274  87,464 3,885
4        Houston 105,539  92,218   276
5    Los Angeles 120,432  98,654   779
6       New York 117,686 120,000   754
7   Philadelphia 103,730  99,000   166
8  San Francisco 140,962 135,550 5,842
9       San Jose 141,544 115,000 3,217
10       Seattle 137,280 131,600 5,019
11          D.C. 115,523  94,000   107
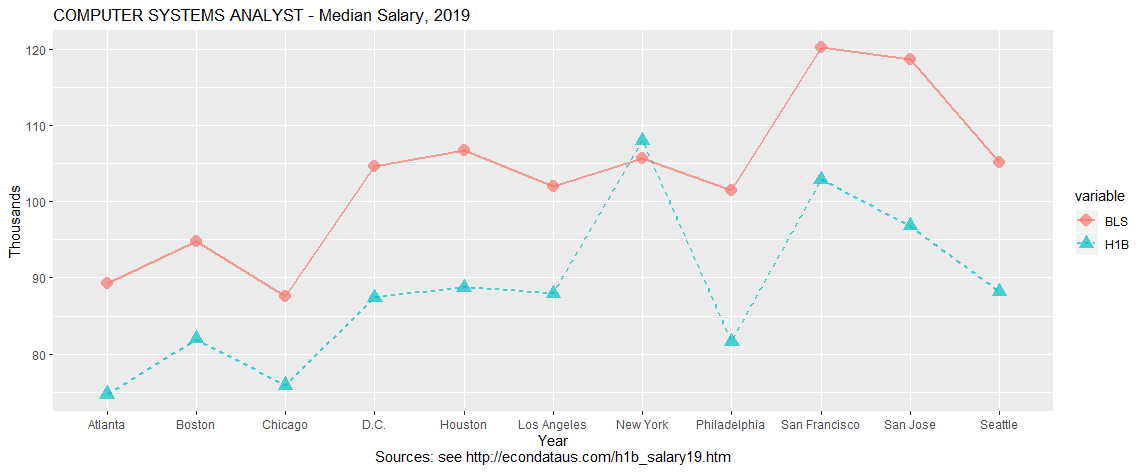
COMPUTER SYSTEMS ANALYST - Median Salary, 2019

            City     BLS     H1B  LCAs
12       Atlanta  89,274  74,734   175
13        Boston  94,765  81,980   553
14       Chicago  87,630  75,900 1,677
15       Houston 106,683  88,701    95
16   Los Angeles 101,941  87,901   366
17      New York 105,685 108,000   223
18  Philadelphia 101,442  81,598   155
19 San Francisco 120,182 102,898   953
20      San Jose 118,602  96,800   798
21       Seattle 105,102  88,192   377
22          D.C. 104,686  87,402    33
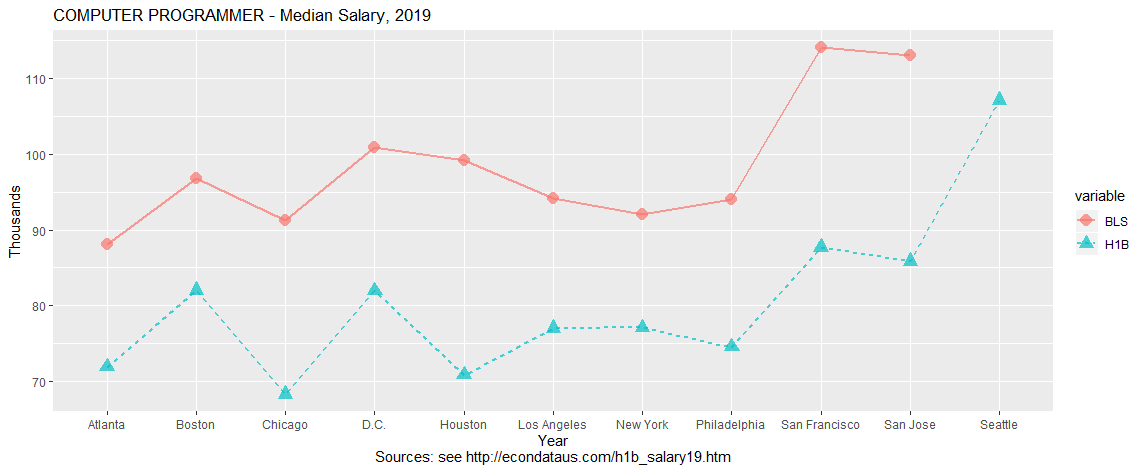
COMPUTER PROGRAMMER - Median Salary, 2019

            City     BLS     H1B LCAs
23       Atlanta  88,109  71,900   32
24        Boston  96,782  82,014   51
25       Chicago  91,291  68,300  285
26       Houston  99,216  70,845   31
27   Los Angeles  94,162  77,002   62
28      New York  92,102  77,100   30
29  Philadelphia  93,974  74,526    7
30 San Francisco 114,067  87,714  173
31      San Jose 113,006  85,883  312
32       Seattle      NA 107,141   13
33          D.C. 100,880  82,000    8
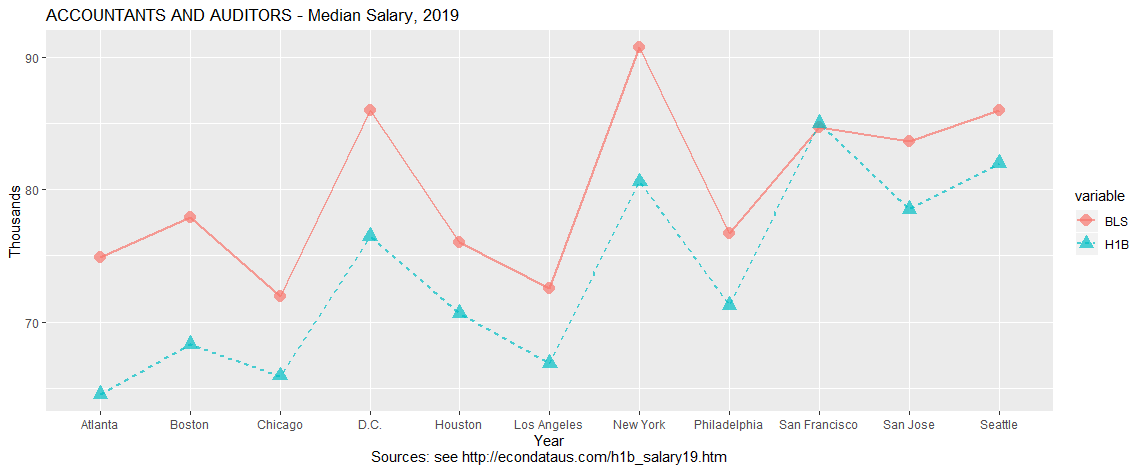
ACCOUNTANTS AND AUDITORS - Median Salary, 2019

            City    BLS    H1B LCAs
34       Atlanta 74,880 64,544   18
35        Boston 77,875 68,302  260
36       Chicago 71,968 65,915  376
37       Houston 76,045 70,658   22
38   Los Angeles 72,571 66,893  373
39      New York 90,709 80,600  113
40  Philadelphia 76,669 71,250   14
41 San Francisco 84,677 85,000  531
42      San Jose 83,678 78,499  345
43       Seattle 85,966 82,000  209
44          D.C. 85,966 76,482    7
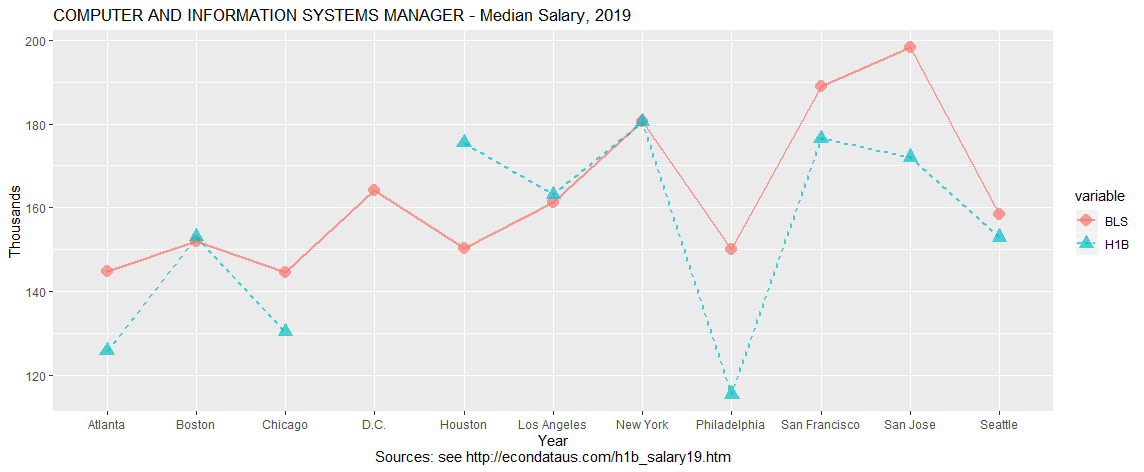
COMPUTER AND INFORMATION SYSTEMS MANAGER - Median Salary, 2019

            City     BLS     H1B LCAs
45       Atlanta 144,664 125,700   21
46        Boston 151,840 153,000  128
47       Chicago 144,414 130,246  224
48       Houston 150,197 175,453    4
49   Los Angeles 161,242 163,072   47
50      New York 180,669 180,500   72
51  Philadelphia 150,072 115,387   28
52 San Francisco 189,072 176,500  668
53      San Jose 198,224 172,000  238
54       Seattle 158,309 152,900  725
55          D.C. 164,195 186,500    2*
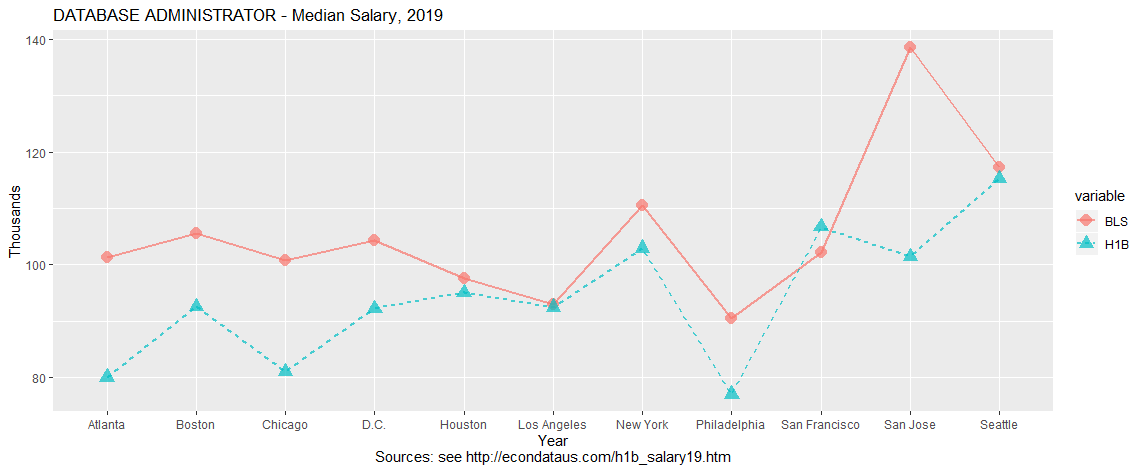
DATABASE ADMINISTRATOR - Median Salary, 2019

             City     BLS     H1B LCAs
111       Atlanta 101,213  80,000   15
112        Boston 105,477  92,518   70
113       Chicago 100,818  81,000  149
114       Houston  97,573  95,000   11
115   Los Angeles  92,893  92,445   56
116      New York 110,510 102,900   39
117  Philadelphia  90,459  77,000    4
118 San Francisco 102,128 106,683  170
119      San Jose 138,486 101,379  138
120       Seattle 117,333 115,250   66
121          D.C. 104,354  92,160    9
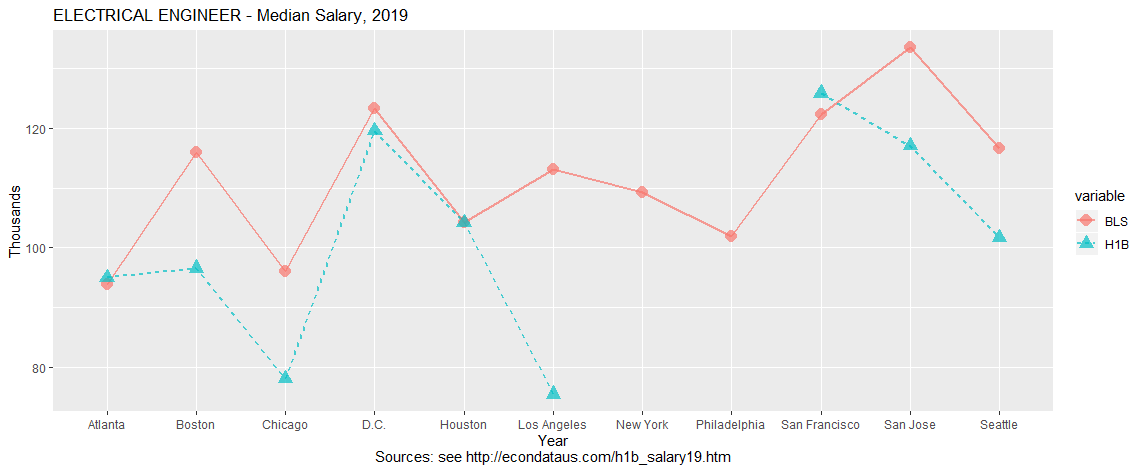
ELECTRICAL ENGINEER - Median Salary, 2019

            City     BLS     H1B LCAs
56       Atlanta  93,850  94,978    4
57        Boston 115,981  96,574   17
58       Chicago  96,034  78,104   39
59       Houston 104,208 104,187   15
60   Los Angeles 113,027  75,555   28
61      New York 109,283  80,507    2*
62  Philadelphia 101,920      NA    0*
63 San Francisco 122,346 125,795   50
64      San Jose 133,390 117,000  261
65       Seattle 116,563 101,667   21
66          D.C. 123,344 119,509    4
* H1B median salaries are not graphed when they come from less than 3 Labor Condition Applications (LCAs).
  BLS median salaries are equal to the median hourly wage multiplied by 2080 (40 hours/week * 52 weeks).
H1B numbers for 2019:
Disclosure File, Program Record Layout
BLS numbers for May 2019:
Atlanta-Sandy Springs-Roswell, GA
Boston-Cambridge-Nashua, MA-NH
Chicago-Naperville-Elgin, IL-IN-WI
Houston-The Woodlands-Sugar Land, TX
Los Angeles-Long Beach-Anaheim, CA
New York-Newark-Jersey City, NY-NJ-PA
Philadelphia-Camden-Wilmington, PA-NJ-DE-MD
San Francisco-Oakland-Hayward, CA
San Jose-Sunnyvale-Santa Clara, CA
Seattle-Tacoma-Bellevue, WA
Washington-Arlington-Alexandria, DC-VA-MD-WV