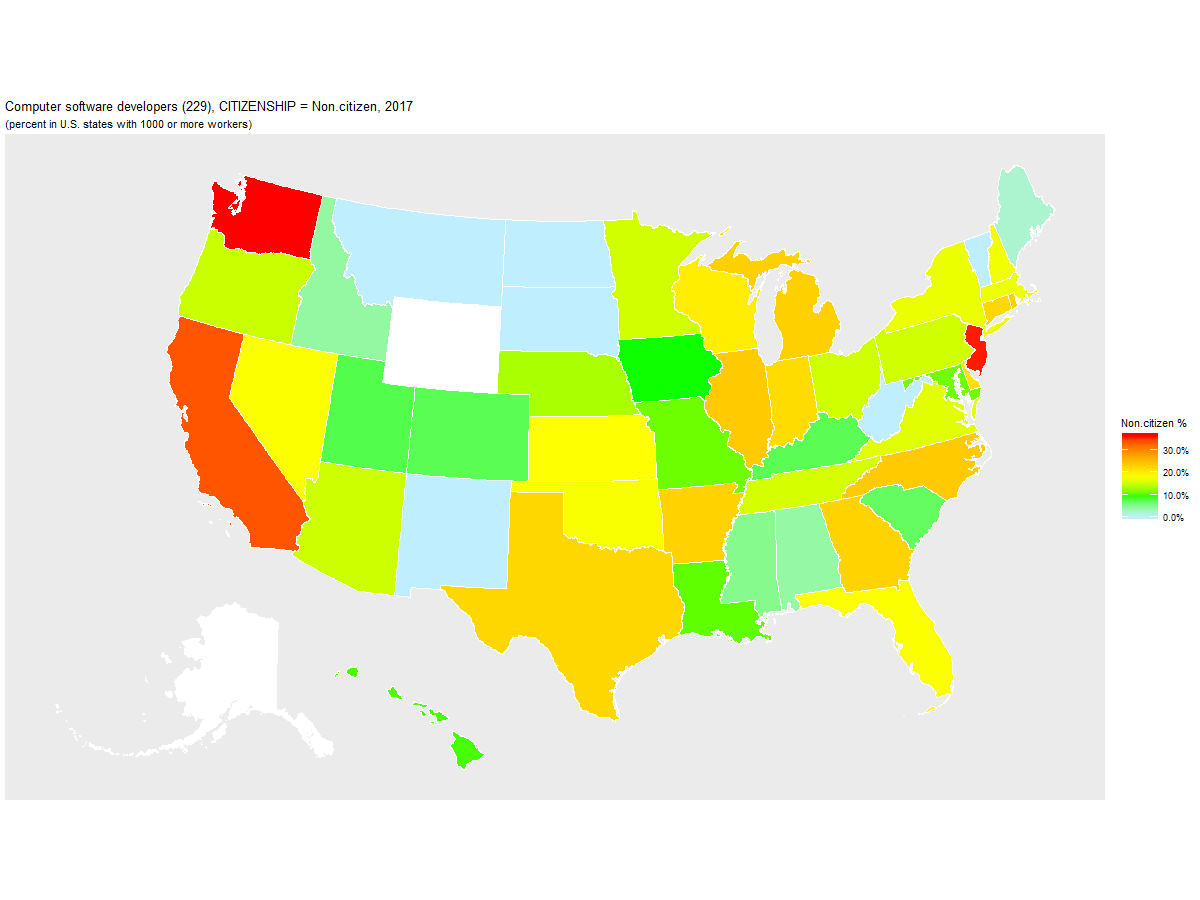
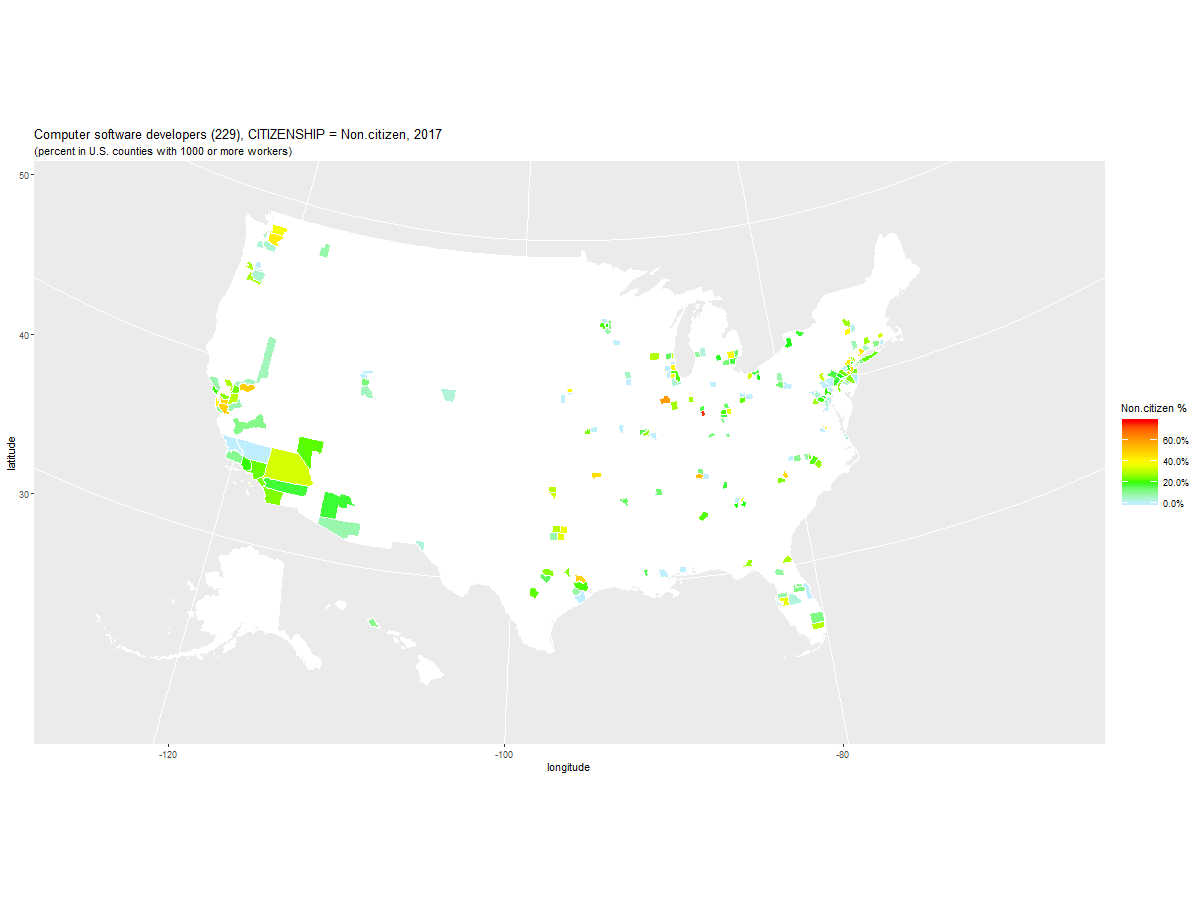
Percentage of Software Developers who were Non-citizens in the United States in 2017
AMERICAN COMMUNITIES SURVEY: 2017

Computer software developers (229): 2017, grouped by CITIZENSHIP (percent)

   Year                    COUNTY   Count Non.citizen Naturalized U.S._Born
1  2017          Hudson County NJ   8,836        77.9         9.0      13.1
2  2017     Santa Clara County CA  90,412        49.4        23.6      26.9
3  2017         Alameda County CA  39,393        47.9        22.1      30.0
4  2017       Middlesex County NJ  15,402        47.7        33.8      18.5
5  2017     Mecklenburg County NC  10,694        47.7         6.4      45.9
6  2017       San Mateo County CA  19,108        42.3        23.4      34.2
7  2017            King County WA  72,589        42.3        10.3      47.4
8  2017            Lake County IL   6,757        41.9        22.7      35.3
9  2017         Oakland County MI  14,694        39.8        14.3      45.8
10 2017          DuPage County IL   9,767        38.1        17.9      44.0
11 2017       Snohomish County WA   7,859        37.7        11.4      50.8
12 2017          Collin County TX  19,963        36.5        19.0      44.5
13 2017    Hillsborough County FL   7,446        35.9        11.5      52.5
14 2017          Dallas County TX  16,730        35.5        16.5      48.1
15 2017        New York County NY  13,179        34.7         9.5      55.8
16 2017          Denton County TX   7,218        30.2        25.0      44.7
17 2017         Broward County FL   7,696        30.1        25.9      44.0
18 2017            Dane County WI  10,832        29.7         6.5      63.8
19 2017           Duval County FL   6,645        29.0        23.3      47.7
20 2017      Washington County OR  11,096        28.7        10.8      60.4
21 2017        Hartford County CT   6,529        27.8        15.8      56.5
22 2017          Bergen County NJ   5,208        27.4        31.6      41.0
23 2017         Loudoun County VA  12,867        27.2        28.2      44.6
24 2017       St. Louis County MO   6,718        25.8         7.4      66.8
25 2017      Williamson County TX   9,423        25.4        22.3      52.4
26 2017    Contra Costa County CA  13,197        25.3        35.1      39.6
27 2017       San Diego County CA  27,569        24.8        23.8      51.4
28 2017         Johnson County KS   8,509        24.4         8.9      66.6
29 2017   San Francisco County CA  25,559        24.3        10.6      65.1
30 2017          Orange County CA  29,277        24.2        26.9      48.9
31 2017      Sacramento County CA   9,603        23.7        13.7      62.7
32 2017        Monmouth County NJ   5,383        23.4        14.7      61.9
33 2017     Los Angeles County CA  46,009        22.9        19.1      57.9
34 2017        Franklin County OH  10,146        22.9        11.1      65.9
35 2017         Suffolk County NY   6,851        22.5        19.9      57.6
36 2017           Bexar County TX   8,500        22.2         9.5      68.2
37 2017            Wake County NC  20,160        21.8        13.2      65.0
38 2017        Hennepin County MN  14,438        21.5         6.0      72.5
39 2017            Cook County IL  28,419        21.5        14.8      63.7
40 2017          Harris County TX  16,997        21.3        21.9      56.8
41 2017         Suffolk County MA   7,205        21.2        26.2      52.7
42 2017      Montgomery County MD  15,992        20.4        29.1      50.5
43 2017            Cobb County GA   6,891        19.8        19.0      61.2
44 2017          Ramsey County MN   6,373        19.4         5.1      75.6
45 2017      Montgomery County PA   7,636        19.1        19.0      61.8
46 2017        Gwinnett County GA   7,028        18.9        24.8      56.3
47 2017          Howard County MD   7,434        18.8        22.7      58.5
48 2017        Maricopa County AZ  22,527        17.9        11.6      70.5
49 2017          Monroe County NY   6,009        17.8         6.6      75.6
50 2017       Riverside County CA   5,659        17.7        14.6      67.6
51 2017         Chester County PA   7,853        17.7        16.6      65.7
52 2017           Wayne County MI   5,581        17.0        17.1      65.9
53 2017        Cuyahoga County OH   6,256        16.5        12.9      70.6
54 2017          Queens County NY  12,032        16.1        34.8      49.1
55 2017          Travis County TX  21,567        15.4         9.8      74.9
56 2017       Allegheny County PA  10,960        13.7         6.5      79.8
57 2017       Salt Lake County UT  11,825        13.1         6.8      80.2
58 2017                      (NA) 407,221        12.5        10.5      77.1
59 2017          Orange County FL   8,688        11.6        17.2      71.2
60 2017       Arlington County VA   5,053        11.4        21.1      67.4
61 2017          Nassau County NY   6,180        10.9        27.7      61.4
62 2017           Kings County NY  14,519        10.8        22.8      66.5
63 2017   District of Columbia DC   6,818         9.9         9.3      80.8
64 2017       Fort Bend County TX   5,700         8.6        44.0      47.4
65 2017         Tarrant County TX   7,020         8.4        17.2      74.4
66 2017            Utah County UT   8,735         6.3         0.0      93.7
67 2017 Prince George's County MD   8,033         4.1         2.2      93.7
68 2017        Pinellas County FL   5,742         2.6         7.2      90.3
69 2017    Anne Arundel County MD   6,835         2.5        10.5      87.0
70 2017       Multnomah County OR   6,378         2.0         5.2      92.8

URL parameters (short)=
?STATE=&geo=COUNTY&occ=Computer%20software%20developers%20(229)&group=CITIZENSHIP&sortn=4
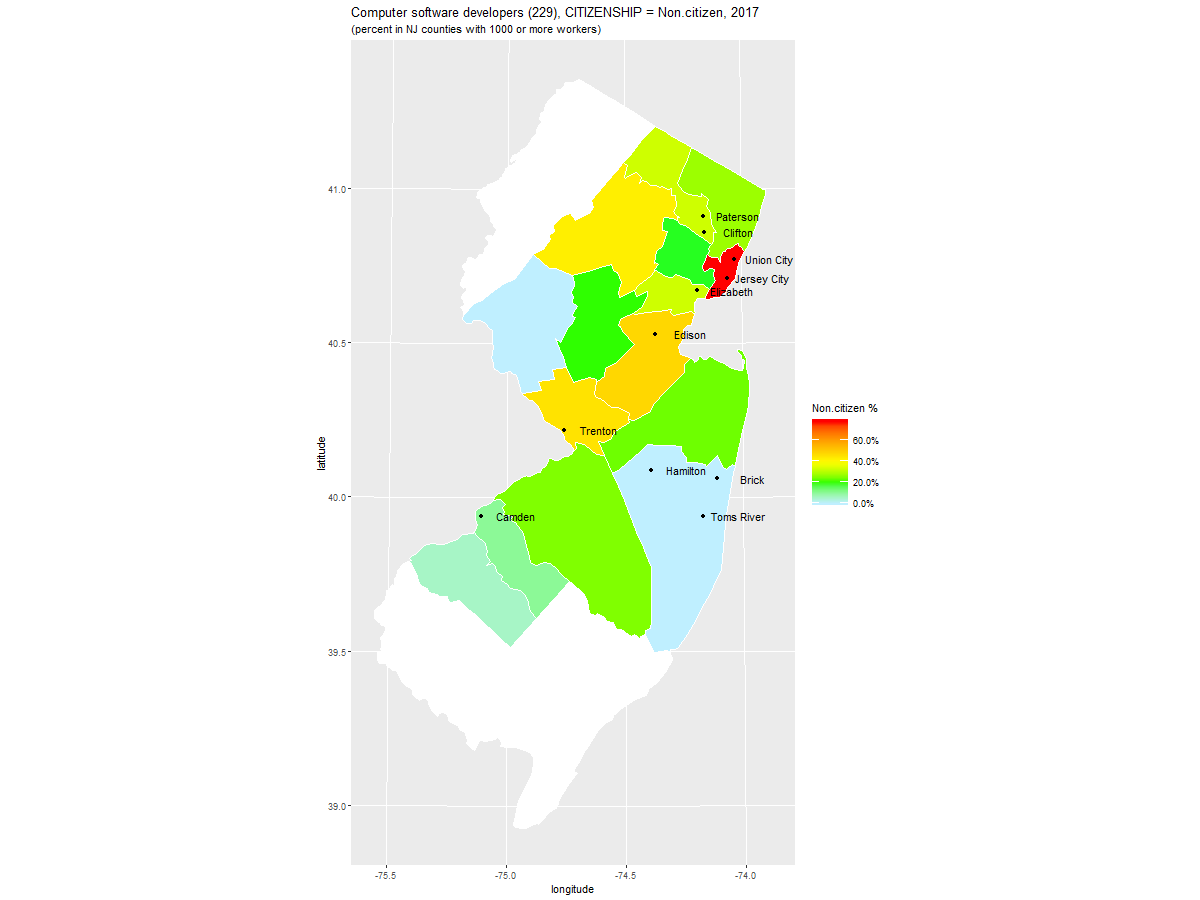
Percentage of Software Developers who were Non-citizens in New Jersey in 2017
AMERICAN COMMUNITIES SURVEY: 2017
(STATE=NJ)

Computer software developers (229): 2017, grouped by CITIZENSHIP (percent)

   Year               COUNTY  Count Non.citizen Naturalized U.S._Born
1  2017     Hudson County NJ  8,836        77.9         9.0      13.1
2  2017  Middlesex County NJ 15,402        47.7        33.8      18.5
3  2017     Mercer County NJ  4,055        45.0        20.6      34.3
4  2017     Morris County NJ  4,339        42.6        24.8      32.6
5  2017    Passaic County NJ  1,837        32.8        12.6      54.6
6  2017      Union County NJ  2,267        32.8        22.1      45.1
7  2017     Bergen County NJ  5,208        27.4        31.6      41.0
8  2017 Burlington County NJ  3,868        24.9        15.4      59.7
9  2017   Monmouth County NJ  5,383        23.4        14.7      61.9
10 2017   Somerset County NJ  3,903        20.2        50.8      29.0
11 2017      Essex County NJ  4,690        18.8        39.9      41.3
12 2017                 (NA)  1,973        17.3        24.9      57.8
13 2017     Camden County NJ  3,672        10.2        28.3      61.5
14 2017 Gloucester County NJ  1,211         5.6         9.3      85.1
15 2017  Hunterdon County NJ  1,343         0.0         4.4      95.6
16 2017      Ocean County NJ  1,576         0.0         3.1      96.9

URL parameters (short)=
?STATE=NJ&geo=COUNTY&occ=Computer%20software%20developers%20(229)&group=CITIZENSHIP&sortn=4&mincount=1000
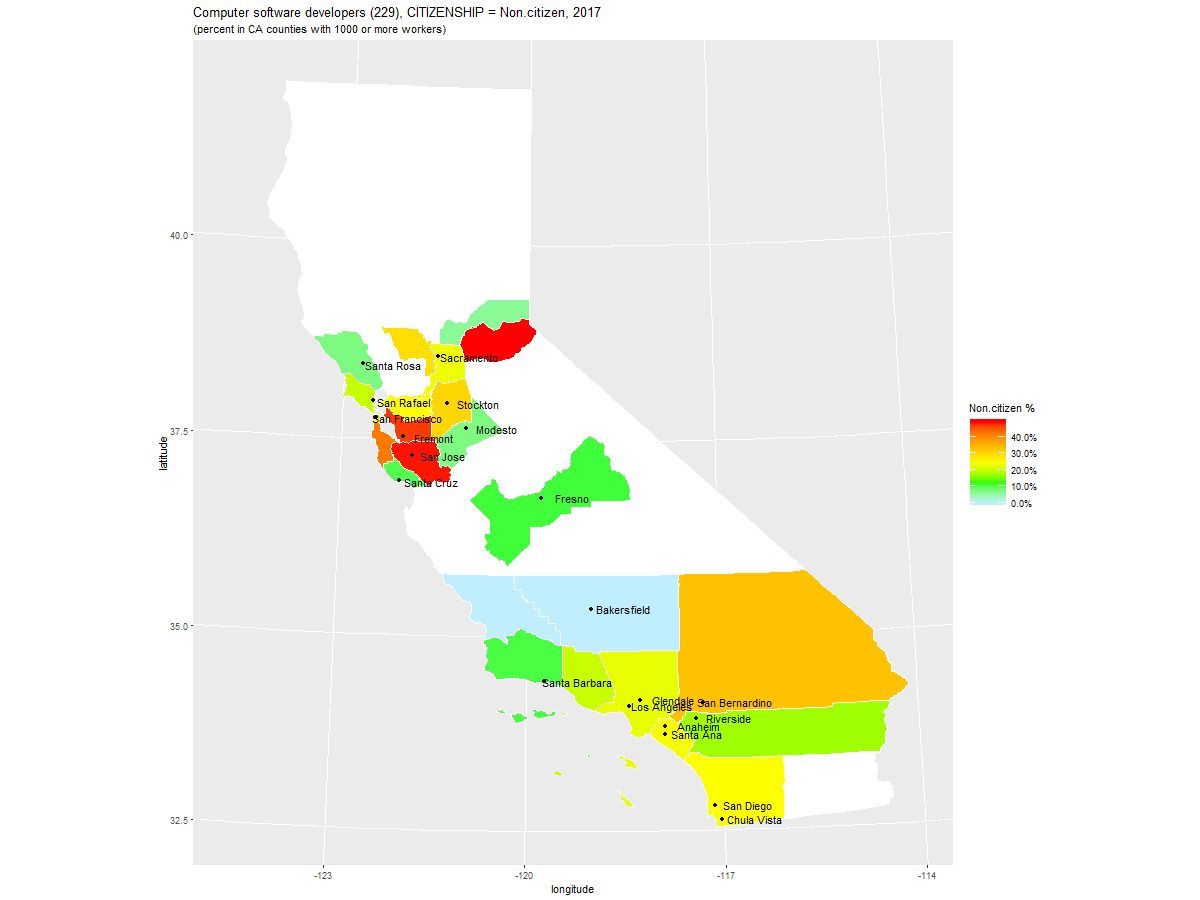
Percentage of Software Developers who were Non-citizens in California in 2017
AMERICAN COMMUNITIES SURVEY: 2017
(STATE=CA)

Computer software developers (229): 2017, grouped by CITIZENSHIP (percent)

   Year                    COUNTY  Count Non.citizen Naturalized U.S._Born
1  2017       El Dorado County CA  1,205        49.8         0.0      50.2
2  2017     Santa Clara County CA 90,412        49.4        23.6      26.9
3  2017         Alameda County CA 39,393        47.9        22.1      30.0
4  2017       San Mateo County CA 19,108        42.3        23.4      34.2
5  2017  San Bernardino County CA  4,067        33.4        22.8      43.8
6  2017     San Joaquin County CA  2,148        30.4        15.3      54.3
7  2017            Yolo County CA  1,016        29.3         9.2      61.5
8  2017    Contra Costa County CA 13,197        25.3        35.1      39.6
9  2017       San Diego County CA 27,569        24.8        23.8      51.4
10 2017   San Francisco County CA 25,559        24.3        10.6      65.1
11 2017          Orange County CA 29,277        24.2        26.9      48.9
12 2017      Sacramento County CA  9,603        23.7        13.7      62.7
13 2017     Los Angeles County CA 46,009        22.9        19.1      57.9
14 2017         Ventura County CA  3,917        20.5        19.1      60.5
15 2017           Marin County CA  1,579        20.3        14.6      65.0
16 2017       Riverside County CA  5,659        17.7        14.6      67.6
17 2017          Fresno County CA  1,481        11.3        17.4      71.3
18 2017   Santa Barbara County CA  2,208        10.9         0.0      89.1
19 2017      Santa Cruz County CA  2,342        10.5        10.5      79.0
20 2017          Sonoma County CA  2,689         7.9        12.3      79.8
21 2017      Stanislaus County CA  1,075         7.8         8.9      83.3
22 2017          Placer County CA  2,372         6.6        16.7      76.7
23 2017                      (NA)  2,529         5.3        21.7      73.0
24 2017            Kern County CA  1,011         0.0         0.0     100.0
25 2017 San Luis Obispo County CA  2,394         0.0         1.9      98.1

URL parameters (short)=
?geo=COUNTY&occ=Computer%20software%20developers%20(229)&group=CITIZENSHIP&sortn=4&mincount=1000
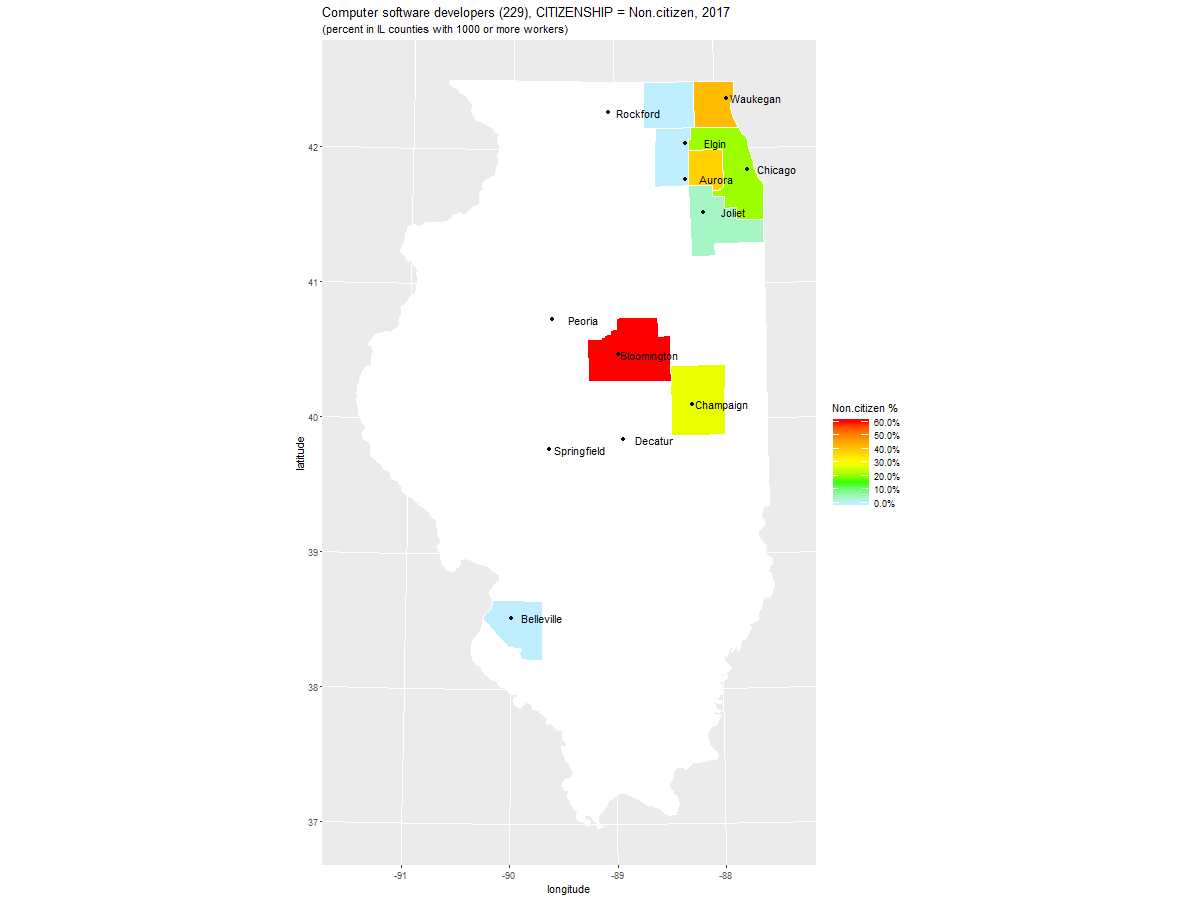
Percentage of Software Developers who were Non-citizens in Illinois in 2017
Computer software developers (229): 2017, grouped by CITIZENSHIP (percent)

   Year              COUNTY  Count Non.citizen Naturalized U.S._Born
1  2017    McLean County IL  2,872        60.7         4.6      34.7
2  2017      Lake County IL  6,757        41.9        22.7      35.3
3  2017    DuPage County IL  9,767        38.1        17.9      44.0
4  2017 Champaign County IL  2,428        28.0         0.0      72.0
5  2017      Cook County IL 28,419        21.5        14.8      63.7
6  2017      Will County IL  3,733         4.6        51.2      44.3
7  2017                (NA)  3,781         0.6         8.6      90.8
8  2017      Kane County IL  2,657         0.0         5.5      94.5
9  2017   McHenry County IL  1,590         0.0        22.8      77.2
10 2017 St. Clair County IL  1,372         0.0         0.0     100.0

URL parameters (short)=
?STATE=IL&geo=COUNTY&occ=Computer%20software%20developers%20(229)&group=CITIZENSHIP&sortn=4&mincount=1000
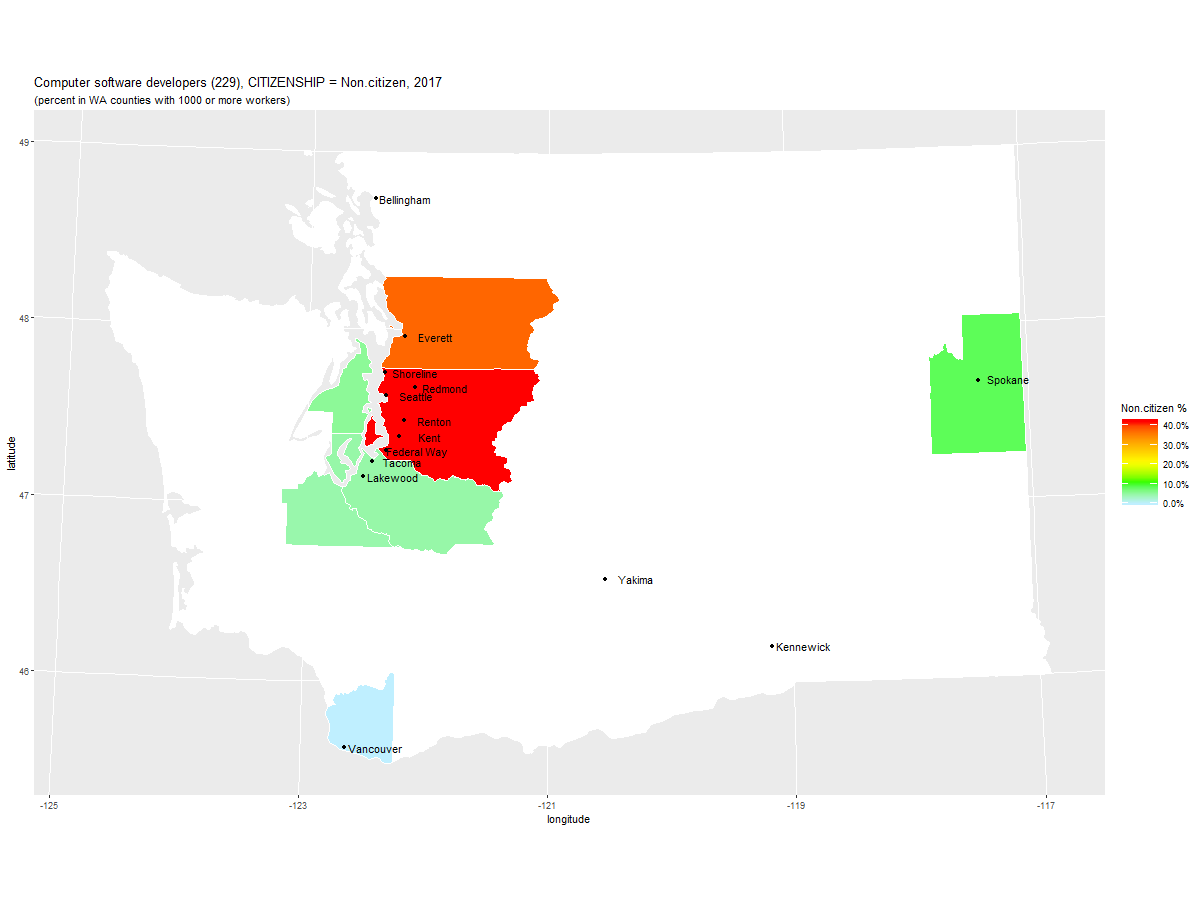
Percentage of Software Developers who were Non-citizens in Washington in 2017
Computer software developers (229): 2017, grouped by CITIZENSHIP (percent)

  Year              COUNTY  Count Non.citizen Naturalized U.S._Born
1 2017      King County WA 72,589        42.3        10.3      47.4
2 2017 Snohomish County WA  7,859        37.7        11.4      50.8
3 2017   Spokane County WA  1,105         8.5        10.7      80.8
4 2017    Kitsap County WA  1,036         5.5         0.0      94.5
5 2017    Pierce County WA  2,795         4.7         2.6      92.7
6 2017                (NA)  3,059         4.6         7.6      87.7
7 2017  Thurston County WA  2,352         4.4        28.7      66.8
8 2017     Clark County WA  3,096         0.0        12.1      87.9

URL parameters (short)=
?STATE=WA&geo=COUNTY&occ=Computer%20software%20developers%20(229)&group=CITIZENSHIP&sortn=4&mincount=1000
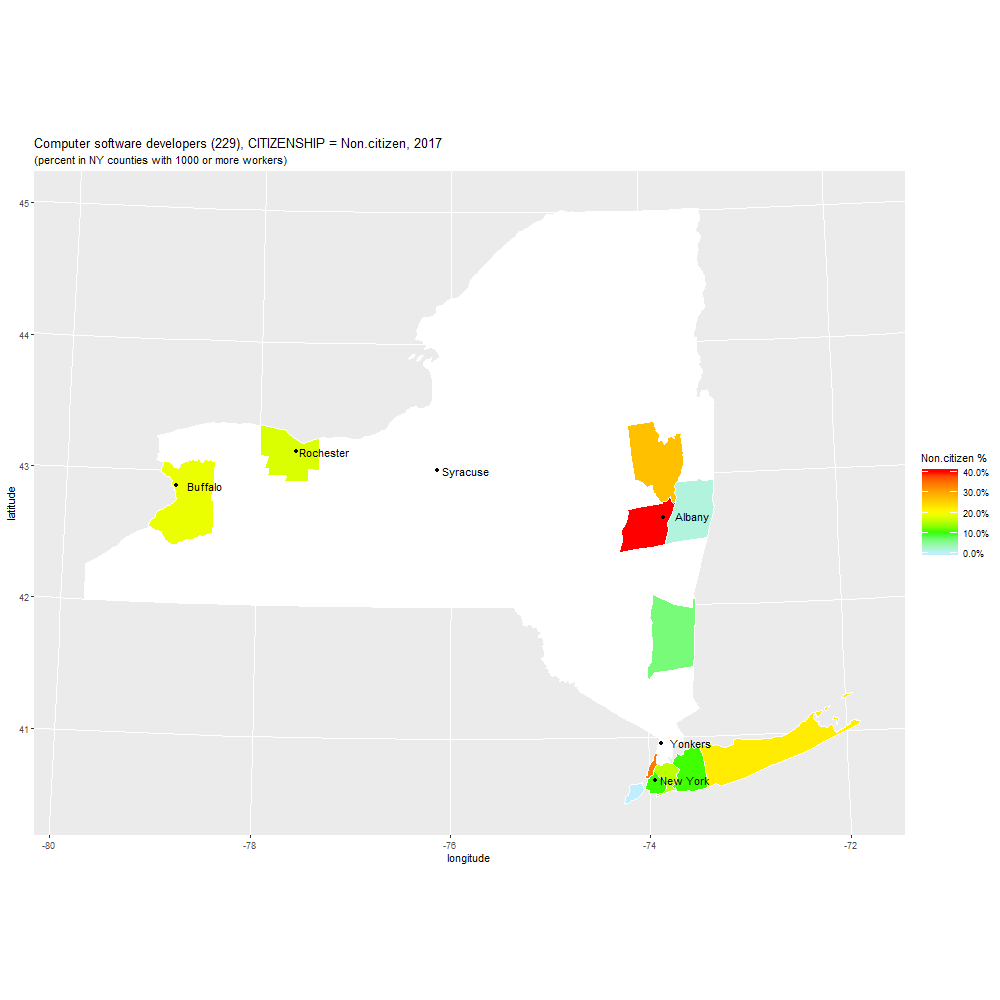
Percentage of Software Developers who were Non-citizens in New York in 2017
AMERICAN COMMUNITIES SURVEY: 2017
(STATE=NY)

Computer software developers (229): 2017, grouped by CITIZENSHIP (percent)

   Year               COUNTY  Count Non.citizen Naturalized U.S._Born
1  2017     Albany County NY  2,301        40.7         3.4      55.8
2  2017   New York County NY 13,179        34.7         9.5      55.8
3  2017   Saratoga County NY  1,000        27.6         0.0      72.4
4  2017    Suffolk County NY  6,851        22.5        19.9      57.6
5  2017       Erie County NY  3,574        19.0         2.6      78.4
6  2017     Monroe County NY  6,009        17.8         6.6      75.6
7  2017     Queens County NY 12,032        16.1        34.8      49.1
8  2017                 (NA) 17,874        11.5         8.1      80.3
9  2017     Nassau County NY  6,180        10.9        27.7      61.4
10 2017      Kings County NY 14,519        10.8        22.8      66.5
11 2017   Dutchess County NY  1,552         6.8        17.2      76.0
12 2017 Rensselaer County NY  1,438         1.7        19.7      78.5
13 2017   Richmond County NY  1,966         0.0        66.5      33.5
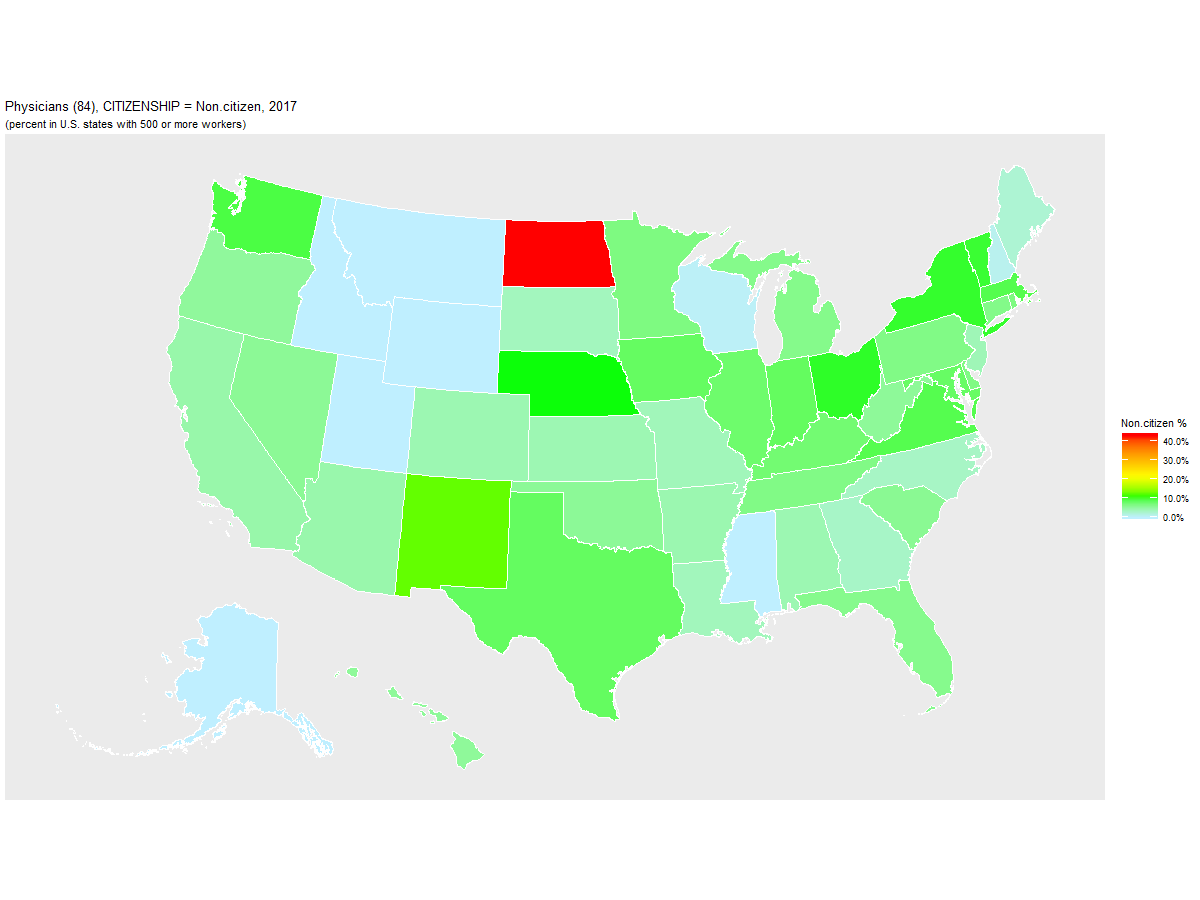
Percentage of Physicians who were Non-citizens in the United States in 2017