H-1B and Related Data for Washington


Certified Labor Condition Application (LCA) Data for Washington, FY 2019

Top 50 Worksite EMPLOYER_NAMEs and WORKSITE_CITYs, sorted by WORKERS, All Worksites

                              EMPLOYER_NAME2     WORKSITE_CITY WORKERS APPLICATIONS
1                                 AMAZON.COM           SEATTLE    8732         4224
2                                  MICROSOFT           REDMOND    3825         3577
3                                    EXPEDIA          BELLEVUE    1077          257
4                                 AMAZON WEB           SEATTLE     964          492
5                                  MICROSOFT          BELLEVUE     877          872
6                        DELOITTE CONSULTING           SEATTLE     862           69
7                                   FACEBOOK           SEATTLE     743          314
8                          UBER TECHNOLOGIES           SEATTLE     604           82
9                             ORACLE AMERICA           SEATTLE     587           34
10                                        HP         VANCOUVER     582           21
11                                SERVICENOW          KIRKLAND     465           22
12                              T-MOBILE USA          BELLEVUE     434          374
13                                    KFORCE           BOTHELL     360            6
14                                   INFOSYS           REDMOND     343          343
15                                    GOOGLE           SEATTLE     320          320
16                                    GOOGLE          KIRKLAND     280          280
17                                  T-MOBILE          BELLEVUE     272          225
18                                 NORDSTROM           SEATTLE     254          254
19                                  MINDTREE           REDMOND     235          235
20                     CYPRESS SEMICONDUCTOR          LYNNWOOD     220           13
21                                    NVIDIA           REDMOND     205            8
22                  TECH MAHINDRA (AMERICAS)           REDMOND     200          200
23                               HCL AMERICA           REDMOND     192           58
24                                    BOEING           SEATTLE     177           33
25                                   EXPEDIA           SEATTLE     170           23
26                                    AMAZON           SEATTLE     167          167
27                                  FACEBOOK           REDMOND     163           59
28                          COSTCO WHOLESALE          ISSAQUAH     158          158
29                           ELECTRONIC ARTS           SEATTLE     158           11
30                        PHILIPS HEALTHCARE           BOTHELL     150           18
31                                  SYNOPSYS           SEATTLE     140            5
32                                 STARBUCKS           SEATTLE     137          115
33                                   NUTANIX           SEATTLE     136           16
34                                    ZILLOW           SEATTLE     131          123
35                                 MICROSOFT          ISSAQUAH     127          127
36                         QUADRANT RESOURCE           REDMOND     127          123
37                                      AT&T           REDMOND     125           86
38                              T-MOBILE USA           BOTHELL     124           86
39                                 ACCENTURE           REDMOND     116           66
40                               F5 NETWORKS           SEATTLE     113           85
41                          SKYWEST AIRLINES            SEATAC     110           11
42                                      AT&T           BOTHELL     106           87
43                            SALESFORCE.COM          BELLEVUE     103           88
44                        BISOFT CONSULTANCY           REDMOND     102          102
45                               HCL AMERICA          BELLEVUE     101            6
46                          STARBUCKS COFFEE           SEATTLE      99           99
47                  UNIVERSITY OF WASHINGTON           SEATTLE      99           99
48                                  T-MOBILE           BOTHELL      97           97
49                           GILEAD SCIENCES           SEATTLE      96            7
50                                AMAZON.COM          BELLEVUE      95           95

Top 50 Worksite EMPLOYER_NAMEs and WORKSITE_CITYs, sorted by WORKERS, Local Worksites Only

                              EMPLOYER_NAME2     WORKSITE_CITY WORKERS APPLICATIONS
1                                 AMAZON.COM           SEATTLE    8695         4210
2                                  MICROSOFT           REDMOND    3029         3029
3                                    EXPEDIA          BELLEVUE    1011          217
4                                 AMAZON WEB           SEATTLE     964          492
5                        DELOITTE CONSULTING           SEATTLE     862           69
6                                  MICROSOFT          BELLEVUE     768          768
7                                   FACEBOOK           SEATTLE     738          309
8                          UBER TECHNOLOGIES           SEATTLE     604           82
9                             ORACLE AMERICA           SEATTLE     587           34
10                                        HP         VANCOUVER     563           13
11                                SERVICENOW          KIRKLAND     465           22
12                                    KFORCE           BOTHELL     360            6
13                                   INFOSYS           REDMOND     321          321
14                                    GOOGLE           SEATTLE     317          317
15                                    GOOGLE          KIRKLAND     275          275
16                                  MINDTREE           REDMOND     220          220
17                     CYPRESS SEMICONDUCTOR          LYNNWOOD     220           13
18                              T-MOBILE USA          BELLEVUE     206          206
19                                    NVIDIA           REDMOND     205            8
20                  TECH MAHINDRA (AMERICAS)           REDMOND     196          196
21                               HCL AMERICA           REDMOND     184           50
22                                   EXPEDIA           SEATTLE     169           22
23                                  FACEBOOK           REDMOND     160           56
24                           ELECTRONIC ARTS           SEATTLE     158           11
25                                 NORDSTROM           SEATTLE     144          144
26                                  SYNOPSYS           SEATTLE     140            5
27                                   NUTANIX           SEATTLE     136           16
28                                    ZILLOW           SEATTLE     130          122
29                          SKYWEST AIRLINES            SEATAC     110           11
30                                 MICROSOFT          ISSAQUAH     110          110
31                                 ACCENTURE           REDMOND     105           55
32                            SALESFORCE.COM          BELLEVUE     102           87
33                        BISOFT CONSULTANCY           REDMOND     102          102
34                               HCL AMERICA          BELLEVUE     100            5
35                                    AMAZON           SEATTLE      99           99
36                  UNIVERSITY OF WASHINGTON           SEATTLE      98           98
37                                AMAZON.COM          BELLEVUE      95           95
38                       DELOITTE CONSULTING           OLYMPIA      95            7
39                          STARBUCKS COFFEE           SEATTLE      94           94
40                           GILEAD SCIENCES           SEATTLE      80            5
41                       CONCUR TECHNOLOGIES          BELLEVUE      78           78
42                             CISCO SYSTEMS          BELLEVUE      76            9
43  PHILIPS ORAL HEALTHCARE INC (A PHILIPS H           BOTHELL      72            9
44    FRED HUTCHINSON CANCER RESEARCH CENTER           SEATTLE      69           69
45                         ERNST & YOUNG U.S           SEATTLE      69           69
46                         QUADRANT RESOURCE           REDMOND      66           66
47               BATTELLE MEMORIAL INSTITUTE          RICHLAND      65           65
48                               F5 NETWORKS           SEATTLE      65           65
49                             CISCO SYSTEMS           SEATTLE      65            5
50                                   INFOSYS          BELLEVUE      61           61

Top 50 Worksite EMPLOYER_NAMEs and WORKSITE_CITYs, sorted by WORKERS, Remote Worksites Only

                              EMPLOYER_NAME2     WORKSITE_CITY WORKERS APPLICATIONS
1                                  MICROSOFT           REDMOND     796          548
2                                   T-MOBILE          BELLEVUE     272          225
3                               T-MOBILE USA          BELLEVUE     228          168
4                                     BOEING           SEATTLE     172           28
5                         PHILIPS HEALTHCARE           BOTHELL     150           18
6                                  STARBUCKS           SEATTLE     137          115
7                                       AT&T           REDMOND     116           77
8                           COSTCO WHOLESALE          ISSAQUAH     111          111
9                                  NORDSTROM           SEATTLE     110          110
10                                 MICROSOFT          BELLEVUE     109          104
11                                  T-MOBILE           BOTHELL      97           97
12                                      AT&T           BOTHELL      95           76
13                                    BOEING           TUKWILA      87           87
14                              T-MOBILE USA           BOTHELL      85           47
15                                    BOEING            RENTON      85           79
16                               T-MOBILE US           BOTHELL      69           69
17                                    BOEING          BELLEVUE      68           60
18                                    AMAZON           SEATTLE      68           68
19                                   EXPEDIA          BELLEVUE      66           40
20  STATE OF WASHINGTON DEPARTMENT OF LICENS           OLYMPIA      63            7
21                         QUADRANT RESOURCE           REDMOND      61           57
22                  LIBERTY MUTUAL INSURANCE           SEATTLE      61           38
23                         PEOPLE TECH GROUP           REDMOND      51           51
24                                    BOEING           EVERETT      50           50
25                               F5 NETWORKS           SEATTLE      48           20
26                    RECREATIONAL EQUIPMENT          BELLEVUE      45           45
27                               TYSON FOODS        SPRINGDALE      45            3
28                               T-MOBILE US          BELLEVUE      43           43
29                                    COSTCO          ISSAQUAH      40           40
30                                  T MOBILE          BELLEVUE      38           32
31                                AMAZON.COM           SEATTLE      37           14
32                                    PACCAR            RENTON      35           30
33                                       N/A           SEATTLE      32            4
34               PROVIDENCE ST JOSEPH HEALTH            RENTON      31            3
35                             COSTCO TRAVEL          ISSAQUAH      31            3
36                           ALASKA AIRLINES            SEATAC      28           28
37                         CLIENT - T-MOBILE          BALLEVUE      23            7
38                                   INFOSYS           REDMOND      22           22
39                           CITY OF SEATTLE           SEATTLE      20           20
40                                    AVISTA           SPOKANE      20           20
41                             ENGIE INSIGHT           SPOKANE      20           20
42                                        HP         VANCOUVER      19            8
43                            LIBERTY MUTUAL           SEATTLE      18           18
44                LULULEMON ATHLETICA CANADA           SEATTLE      18           18
45                DASSAULT SYSTEMES AMERICAS           EVERETT      18           11
46               SAMSUNG ELECTRONICS AMERICA          BELLEVUE      17           17
47                                 MICROSOFT          ISSAQUAH      17           17
48                              FTV BUSINESS           EVERETT      16            2
49                           GILEAD SCIENCES           SEATTLE      16            2
50                                  MINDTREE           REDMOND      15           15
Note: Remote Worksites denote when workers will be placed at a secondary location.
      In this case, field SECONDARY ENTITY is set to Y as explained in this File Structure file and
      EMPLOYER_NAME2 above will be set to the contents of field SECONDARY ENTITY BUSINESS NAME.
      Local Worksites denote when workers will NOT be placed at a secondary location.
Source: OFLC Performance Data (click Disclosure Data tab and go to section
        "Latest Quarterly Updates"), 2019

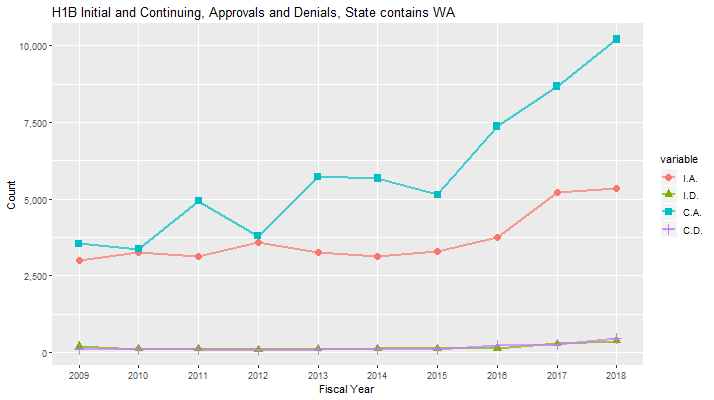
Labor Condition Application (LCA) Data for Washington, FY 2015-2018

YEAR CASE_STATUS WORKERS APPLICATIONS
2015   CERTIFIED   42770        19225
2016   CERTIFIED   41521        20387
2017   CERTIFIED   48784        22599
2018   CERTIFIED   51930        24862

Labor Condition Application (LCA) Data for Washington, FY 2018

Grouped by CASE_STATUS

  CASE_STATUS WORKERS APPLICATIONS
1   CERTIFIED   51930        24862
2 CERT-WITHDR    1305         1201
3   WITHDRAWN     536          482
4      DENIED     481          297

Grouped by VISA_CLASS (CERTIFIED)

       VISA_CLASS WORKERS APPLICATIONS
1            H-1B   50855        24175
2  E-3 Australian     835          526
3     H-1B1 Chile     136           85
4 H-1B1 Singapore     104           76

Top 50 EMPLOYER_NAMEs, sorted by WORKERS (CERTIFIED)

                               EMPLOYER_NAME WORKERS APPLICATIONS
1                                  MICROSOFT   10308         4827
2                                 AMAZON COM   10173         3023
3                                HCL AMERICA    4573          255
4                          ERNST & YOUNG U S    1288           70
5                         AMAZON FULFILLMENT    1101          674
6                                    EXPEDIA     957          323
7                        DELOITTE CONSULTING     935          251
8                                 AMAZON WEB     852          441
9                                   FACEBOOK     775          340
10                                    KFORCE     750           45
11                                   INFOSYS     694          694
12                            ORACLE AMERICA     578           62
13                          TATA CONSULTANCY     576          327
14                  TECH MAHINDRA (AMERICAS)     536          536
15                         PEOPLE TECH GROUP     522          522
16                                   EGENCIA     426           34
17                              EPAM SYSTEMS     370           22
18                                    GOOGLE     347          347
19                                SERVICENOW     345           16
20                                  MINDTREE     318          224
21                              T-MOBILE USA     314          314
22                     CYPRESS SEMICONDUCTOR     310           13
23                                 ACCENTURE     275          216
24                            SALESFORCE COM     264           87
25                 MANAGEMENT HEALTH SYSTEMS     239           51
26        COGNIZANT TECHNOLOGY SOLUTIONS U S     234           13
27                                     WIPRO     228          160
28                                    CYIENT     223           31
29                           ELECTRONIC ARTS     205            9
30                                    NVIDIA     196           16
31                              MAKEURCAREER     189          189
32                                  SYNOPSYS     180            6
33                                        HP     157           18
34                                 CODESMART     155          155
35                          STARBUCKS COFFEE     154          154
36                         CAPGEMINI AMERICA     154           72
37                                    ZILLOW     142          114
38                              CARADIGM USA     140            7
39                ZEN3 INFOSOLUTIONS AMERICA     129          121
40                                 NORDSTROM     127          127
41                          AMAZON CORPORATE     127          127
42                  UNIVERSITY OF WASHINGTON     123          123
43                                   MPHASIS     110            5
44  MASTECH DIGITAL TECHNOLOGIES INC A MASTE     108           18
45                         DELOITTE & TOUCHE     105           35
46                            OSLO SOLUTIONS     101          101
47                            LENORA SYSTEMS     100          100
48                               DAZ SYSTEMS     100            2
49                         QUADRANT RESOURCE      97           97
50                                   DROPBOX      97           19

Top 30 SOC_NAMEs, sorted by WORKERS (CERTIFIED)

                                    SOC_NAME WORKERS APPLICATIONS
1          SOFTWARE DEVELOPERS, APPLICATIONS   23991         9694
2            COMPUTER OCCUPATIONS, ALL OTHER    5625         2679
3                  COMPUTER SYSTEMS ANALYSTS    3515         1801
4      SOFTWARE DEVELOPERS, SYSTEMS SOFTWARE    3340         1985
5               OPERATIONS RESEARCH ANALYSTS    1681          725
6                       COMPUTER PROGRAMMERS    1343          312
7   COMPUTER AND INFORMATION SYSTEMS MANAGER    1081          524
8   NETWORK AND COMPUTER SYSTEMS ADMINISTRAT     717          357
9                              STATISTICIANS     703          375
10                  ACCOUNTANTS AND AUDITORS     682          281
11                       MANAGEMENT ANALYSTS     656          373
12                  COMPUTER SYSTEMS ANALYST     646          545
13  COMPUTER AND INFORMATION RESEARCH SCIENT     573          303
14    ELECTRONICS ENGINEERS, EXCEPT COMPUTER     455           79
15                        MARKETING MANAGERS     391          252
16  MARKET RESEARCH ANALYSTS AND MARKETING S     345          294
17                   DATABASE ADMINISTRATORS     340          216
18                            WEB DEVELOPERS     309          152
19               COMPUTER NETWORK ARCHITECTS     294          170
20             INFORMATION SECURITY ANALYSTS     285          129
21                      MECHANICAL ENGINEERS     270          105
22                        FINANCIAL MANAGERS     257          167
23                            MATHEMATICIANS     253          239
24  TRANSPORTATION, STORAGE, AND DISTRIBUTIO     248          158
25  MEDICAL AND CLINICAL LABORATORY TECHNOLO     243           55
26                        FINANCIAL ANALYSTS     228          134
27                           SALES ENGINEERS     208           63
28                      ELECTRICAL ENGINEERS     191          184
29                         GRAPHIC DESIGNERS     185          141
30               COMPUTER HARDWARE ENGINEERS     177          142

Note: SOC_NAME is the occupational name associated with the SOC_CODE.
      SOC_CODE is the occupational code associated with the job being
      requested for temporary labor condition, as classified by the
      Standard Occupational Classification (SOC) System.

Top 30 WORKSITE_CITYs, sorted by WORKERS (CERTIFIED)

                    WORKSITE_CITY WORKERS APPLICATIONS
1                         SEATTLE   20920         8915
2                         REDMOND   14725         6882
3                        BELLEVUE    8637         4933
4                         BOTHELL    1918          796
5                        KIRKLAND     863          463
6                        ISSAQUAH     649          503
7                          TACOMA     403          104
8                       VANCOUVER     380          126
9                          RENTON     377          285
10                       LYNNWOOD     356           40
11                        EVERETT     333          135
12                        SPOKANE     205          106
13                        TUKWILA     182           93
14                        OLYMPIA     139          121
15                          LACEY     130           84
16                       RICHLAND      94           94
17                        PULLMAN      92           92
18                       PUYALLUP      68           56
19                      KENNEWICK      60           19
20                       TUMWATER      58           52
21                     BELLINGHAM      52           50
22                           KENT      45           45
23                       MUKILTEO      45            7
24                      SEATTLE ,      42           42
25                         AUBURN      38           26
26                      WENATCHEE      37           17
27                       ENUMCLAW      37           37
28                       REDMOND,      37           10
29                         SEATAC      35           30
30                      HILLSBORO      33            2
Source: OFLC Performance Data (click Disclosure Data tab and go to section
        "LCA Programs (H-1B, H-1B1, E-3)"), 2015, 2016, 2017, and 2018

H1B Approval data for Washington, 2009-2018

H-1B Approval Data for Washington, FY 2009-2018

   FYear Records I.A. I.D.  C.A. C.D. Workers I.A.R C.A.R T.A.R
1   2009    1114 3011  193  3548   94    6559  94.0  97.4  95.8
2   2010     960 3263  107  3360   90    6623  96.8  97.4  97.1
3   2011    1039 3131  112  4933   87    8064  96.5  98.3  97.6
4   2012     931 3590   80  3785   68    7375  97.8  98.2  98.0
5   2013     977 3274  105  5728   80    9002  96.9  98.6  98.0
6   2014     978 3131  113  5674   83    8805  96.5  98.6  97.8
7   2015     885 3280  112  5136   85    8416  96.7  98.4  97.7
8   2016     989 3757  131  7368  212   11125  96.6  97.2  97.0
9   2017     998 5218  289  8675  253   13893  94.8  97.2  96.2
10  2018    1061 5341  368 10208  459   15549  93.6  95.7  94.9

Key: I.A. = Initial Approval, I.D. = Initial Denial, C.A. = Continuing Approval, C.D. = Continuing Denial,
     I.A.R. = Initial Approval Rate, C.A.R. = Continuing Approval Rate, T.A.R. = Total Approval Rate

H-1B Approval Data for Washington, FY 2018

Top 50 Employers, sorted by Workers (Initial Approvals plus Continuing Approvals)

  FYear Records I.A. I.D.  C.A. C.D. Workers I.A.R C.A.R T.A.R
1  2018    1061 5341  368 10208  459   15549  93.6  95.7  94.9

                              Employer Records I.A. I.D. C.A. C.D. Workers I.A.R C.A.R T.A.R
1                MICROSOFT CORPORATION      11 1255   13 3211   54    4466  99.0  98.3  98.5
2      AMAZON FULFILLMENT SERVICES INC       8 2397   23 1995   45    4392  99.0  97.8  98.5
3                 AMAZON CORPORATE LLC       9  153   14  826   31     979  91.6  96.4  95.6
4              AMAZON WEB SERVICES INC       7  248   12  465   29     713  95.4  94.1  94.6
5   A2Z DEVELOPMENT CTR INC DBA LAB126       1   77    2  286    5     363  97.5  98.3  98.1
6                     T-MOBILE USA INC       1   42    6  276   10     318  87.5  96.5  95.2
7                          EXPEDIA INC       5   82    1  205    2     287  98.8  99.0  99.0
8                           SLALOM LLC       3   19    6  136    7     155  76.0  95.1  92.3
9           A2Z DEVELOPMENT CENTER INC       2   55    0   83    2     138 100.0  97.6  98.6
10            STARBUCKS COFFEE COMPANY       1    8    0  111    3     119 100.0  97.4  97.5
11            UNIVERSITY OF WASHINGTON       1   57    0   53    1     110 100.0  98.1  99.1
12  HOSPITALIST MEDICINE PHYSICIANS OF       8   30    0   77    2     107 100.0  97.5  98.2
13                       NORDSTROM INC       2   10    0   96    4     106 100.0  96.0  96.4
14                          ZILLOW INC       1    8    5   97    3     105  61.5  97.0  92.9
15       HARMAN CONNECTED SERVICES INC       3    8    3   85   14      93  72.7  85.9  84.5
16         BATTELLE MEMORIAL INSTITUTE       2   28    0   59    2      87 100.0  96.7  97.8
17                TABLEAU SOFTWARE INC       2   13    0   59    1      72 100.0  98.3  98.6
18                     F5 NETWORKS INC       1   13    1   53    0      66  92.9 100.0  98.5
19                   PEOPLE TECH GROUP       1    1    2   52   25      53  33.3  67.5  66.2
20  FRED HUTCHINSON CANCER RESEARCH CE       2   21    1   26    1      47  95.5  96.3  95.9
21   SCHWEITZER ENGRG LABORATORIES INC       1    9    1   38    1      47  90.0  97.4  95.9
22       SEL ENGINEERGING SERVICES INC       1   16    0   30    0      46 100.0 100.0 100.0
23                       INSPIRAGE LLC       1    0    3   44   13      44   0.0  77.2  73.3
24                 AMAZON ROBOTICS LLC       1   13    1   29    0      42  92.9 100.0  97.7
25                         AKVELON INC       1   21    0   17    1      38 100.0  94.4  97.4
26                 AMAZON.COM.DEDC LLC       1    6    2   31    3      37  75.0  91.2  88.1
27       BILL MELINDA GATES FOUNDATION       1   12    1   21    0      33  92.3 100.0  97.1
28                          ZULILY LLC       1    6    1   26    0      32  85.7 100.0  97.0
29      ZEN3 INFOSOLUTIONS AMERICA INC       1    5   14   26    6      31  26.3  81.2  60.8
30                         EGENCIA LLC       3   10    0   19    1      29 100.0  95.0  96.7
31               WASHINGTON STATE UNIV       1   18    0   11    0      29 100.0 100.0 100.0
32            PACTERA TECHNOLOGIES INC       1    5    0   22    0      27 100.0 100.0 100.0
33  PROVIDENCE HEALTH & SVCS WASHINGTO       1   11    1   16    0      27  91.7 100.0  96.4
34                         A100 US LLC       2    3    0   23    0      26 100.0 100.0 100.0
35                   ILINK SYSTEMS INC       1    5    1   21    2      26  83.3  91.3  89.7
36                    GENIUS MINDS LLC       1    4    8   21    1      25  33.3  95.5  73.5
37                 CYBAGE SOFTWARE INC       1   11   16   13    2      24  40.7  86.7  57.1
38                         EDIFECS INC       1    2    1   22    2      24  66.7  91.7  88.9
39              TWITCH INTERACTIVE INC       1    1    2   23    1      24  33.3  95.8  88.9
40           APPLEXUS TECHNOLOGIES LLC       1    1    1   22    7      23  50.0  75.9  74.2
41                           ITRON INC       1   10    1   13    1      23  90.9  92.9  92.0
42                         PEACEHEALTH       2   12    0   11    1      23 100.0  91.7  95.8
43    SOUTH SOUND IMPATIENT PHYSICIANS       1    2    0   19    1      21 100.0  95.0  95.5
44   A2Z DEVELOPMENT CTR INC D/B/A LAB       3   10    0   10    0      20 100.0 100.0 100.0
45             AMAZON COM SERVICES INC      13   13    0    7    0      20 100.0 100.0 100.0
46                C2S TECHNOLOGIES INC       1    2    5   18    8      20  28.6  69.2  60.6
47                         AVANADE INC       2    5    2   14    2      19  71.4  87.5  82.6
48                      CODE SMART INC       1    0    0   19   12      19   NaN  61.3  61.3
49                  OSLO SOLUTIONS LLC       2    1    1   17   11      18  50.0  60.7  60.0
50         CAMBIA HEALTH SOLUTIONS INC       2    3    0   14    0      17 100.0 100.0 100.0

Key: I.A. = Initial Approval, I.D. = Initial Denial, C.A. = Continuing Approval, C.D. = Continuing Denial,
     I.A.R. = Initial Approval Rate, C.A.R. = Continuing Approval Rate, T.A.R. = Total Approval Rate
Source: H-1B Employer Data Hub Files, U.S. Citizenship and Immigration Services

Washington Schools Among the Top 100 by Total Number of Students Participating in Optional Practical Training (OPT), 2017

Washington Schools Among the Top 100 by Total Number of Students Participating in Optional Practical Training (OPT), 2017

N               School Name State Students
-- ------------------------ ----- --------
24 University of Washington    WA     2300
-- ------------------------ ----- --------
             Total Students    WA     2300

Sources: U.S. Immigration and Customs Enforcement,
         2017 Top 100 Schools by Total Number of Students Participating in OPT

Washington Schools Among Top 427 Employers for Optional Practical Training (OPT) Students, 2017

Washington Schools Among Top 427 Employers for Optional Practical Training (OPT) plus Curricular Practical Training (CPT) Students, 2017

N                      Employer Pre&Post  STEM   CPT Total
--- --------------------------- -------- ----- ----- -----
62     University of Washington      201   106     0   307
238 Washington State University       82     0     0    82
--- --------------------------- -------- ----- ----- -----
                 Total Students      283   106     0   389

Sources: U.S. Immigration and Customs Enforcement,
         2017 Top 200 Employers for Pre- and Post-Completion OPT Students,
         2017 Top 200 Employers for STEM OPT Students,
         2017 Top 200 Employers for CPT Students

Non-citizen Software Developers in Washington, 2017

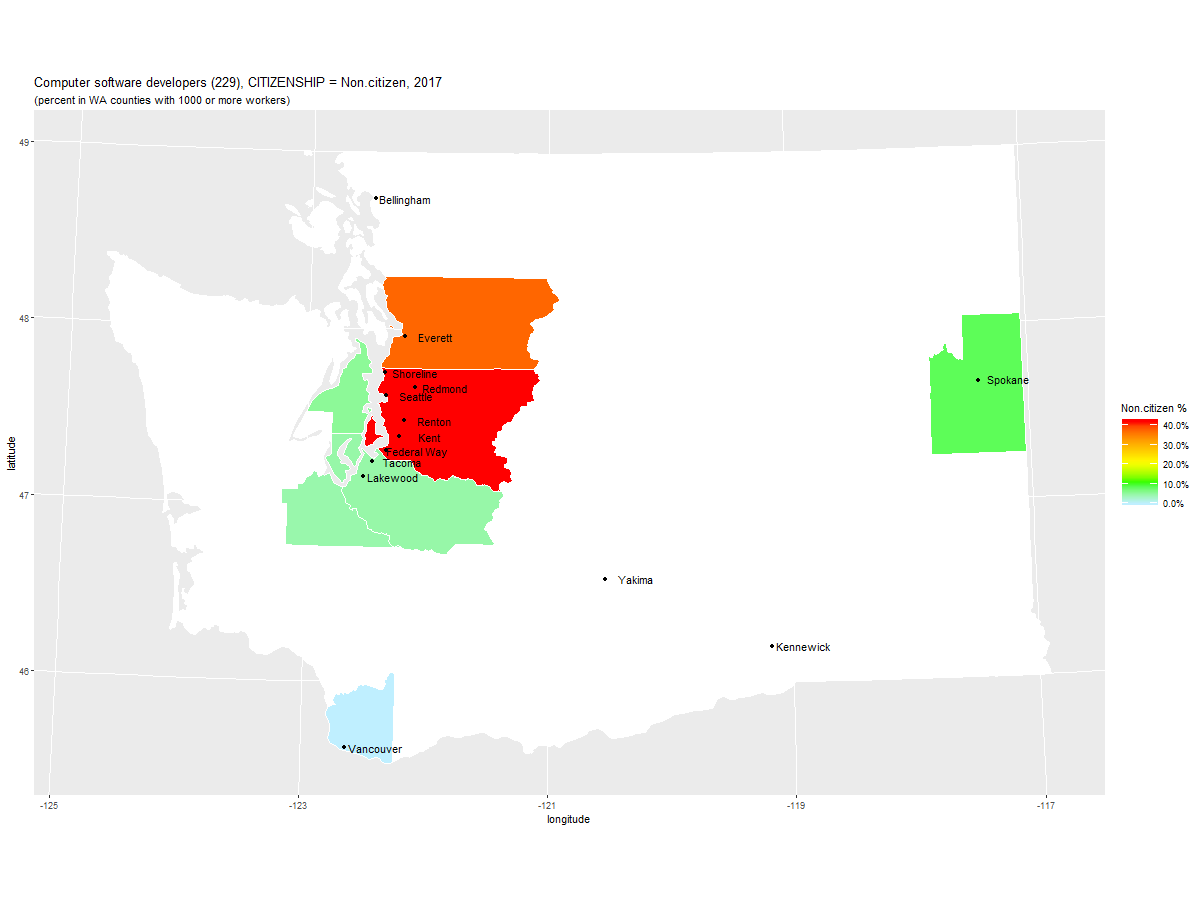
Census Data for Computer Software Developers in Washington in 1980-2017

Percent of Computer Software Developers in Washington, grouped by BIRTHPLACE and SEX: 1980-2017

Computer software developers (229): 1980-2017, grouped by BIRTHPLACE_TECH and SEX_M_F, STATE=WA (percent)

  Year  Count U.S._Born_M U.S._Born_F India_M India_F China_M China_F Other_M Other_F
1 1980  5,700        71.2        23.9     0.4      NA      NA     0.7     3.5     0.4
2 1990 12,372        65.3        25.3     0.3     0.2     1.2     0.5     4.8     2.3
3 2000 39,621        57.6        16.6     4.6     1.1     2.5     2.2    12.4     2.9
4 2010 59,400        43.2        11.2    11.6     3.8     6.5     2.6    18.1     3.0
5 2017 94,231        45.5         6.1    14.5     4.6     9.5     1.7    15.4     2.6

URL parameters (short)=
?minyear=1980&STATE=WA&geo=NATION&occ=Computer%20software%20developers%20(229)&group=BIRTHPLACE_TECH|SEX_M_F

Percent of Computer Software Developers in Washington, grouped by CITIZENSHIP and SEX: 1980-2017

Computer software developers (229): 1980-2017, grouped by CTZNSHP and SEX_M_F, STATE=WA (percent)

  Year  Count Non.ctzn_M Non.ctzn_F Naturlzd_M Naturlzd_F U.S._Brn_M U.S._Brn_F
1 1980  5,700        2.1        0.7        1.4        0.4       71.6       23.9
2 1990 12,372        3.0        1.3        2.4        1.4       66.2       25.8
3 2000 39,621       13.8        3.4        4.5        2.8       58.9       16.7
4 2010 59,400       25.7        7.1        8.8        2.2       44.9       11.2
5 2017 94,231       29.6        6.8        8.4        2.1       46.9        6.1

URL parameters (short)=
?minyear=1980&STATE=WA&geo=NATION&occ=Computer%20software%20developers%20(229)&group=CTZNSHP|SEX_M_F

Percent of Computer Software Developers in Washington, grouped by RACE: 1980-2017

Computer software developers (229): 1980-2017, grouped by RACE, STATE=WA (percent)

  Year  Count White Black AmIndian Chinese Japanese OthAsian OthRace TwoRace X3.Races
1 1980  5,700  94.7   0.7      0.7     1.1      0.7      2.1      NA      NA       NA
2 1990 12,372  90.0   1.3      0.7     2.4      1.6      3.9     0.2      NA       NA
3 2000 39,621  79.1   1.2      0.1     5.7      1.5      9.7     0.7     1.9      0.1
4 2010 59,400  63.0   1.9      0.1    10.0      0.7     20.9     0.3     2.9      0.2
5 2017 94,231  57.8   1.7       NA    13.1      0.4     22.0     0.5     4.0      0.5

URL parameters (short)=
?minyear=1980&STATE=WA&geo=NATION&occ=Computer%20software%20developers%20(229)&group=RACE

Percent of All Workers in Washington, grouped by RACE: 1980-2017

All (0-999): 1980-2017, grouped by RACE, STATE=WA (percent)

  Year     Count White Black AmIndian Chinese Japanese OthAsian OthRace TwoRace X3.Races
1 1980   974,780  94.4   1.9      0.8     0.5      1.0      1.2     0.1      NA       NA
2 1990 1,354,056  91.9   2.2      1.0     0.9      0.9      2.2     0.9      NA       NA
3 2000 1,707,249  86.7   2.6      1.0     1.3      0.7      3.6     1.5     2.4      0.2
4 2010 3,113,546  80.6   3.2      1.1     1.4      0.6      6.4     3.7     2.8      0.3
5 2017 3,651,348  76.4   3.8      0.8     1.9      0.4      7.5     4.6     3.8      0.6

URL parameters (short)=
?minyear=1980&STATE=WA&geo=NATION&occ=All%20(0-999)&group=RACE

Percent of Computer Software Developers in Washington, grouped by HISPAN: 1980-2017

Computer software developers (229): 1980-2017, grouped by HISPAN, STATE=WA (percent)

  Year  Count NotHisp Mexican PuertoRico Other Cuban
1 1980  5,700    97.5     1.1        0.4   1.1    NA
2 1990 12,372    98.8     0.7         NA   0.5    NA
3 2000 39,621    98.5     0.6        0.0   0.7   0.1
4 2010 59,400    98.0     0.9        0.3   0.8    NA
5 2017 94,231    95.5     1.7        0.7   2.0   0.1

URL parameters (short)=
?minyear=1980&STATE=WA&geo=NATION&occ=Computer%20software%20developers%20(229)&group=HISPAN

Percent of All Workers in Washington, grouped by HISPAN: 1980-2017

All (0-999): 1980-2017, grouped by HISPAN, STATE=WA (percent)

  Year     Count NotHisp Mexican PuertoRico Cuban Other
1 1980   974,780    98.5     0.8        0.1   0.0   0.6
2 1990 1,354,056    97.8     1.4        0.1   0.0   0.6
3 2000 1,707,249    96.6     2.1        0.2   0.1   1.0
4 2010 3,113,546    90.6     7.6        0.4   0.1   1.3
5 2017 3,651,348    88.5     8.8        0.5   0.1   1.9

URL parameters (short)=
?minyear=1980&STATE=WA&geo=NATION&occ=All%20(0-999)&group=HISPAN

Percent of Computer Software Developers in Washington, grouped by CITIZENSHIP and SEX: 1990-2017

Computer software developers (229): 1990-2017, grouped by CTZNSHP and EDUC, STATE=WA (percent)

  Year  Count Non.ctzn_Bac- Non.ctzn_Mast Non.ctzn_Phd+ Naturlzd_Bac- Naturlzd_Mast Naturlzd_Phd+ U.S._Brn_Bac- U.S._Brn_Mast U.S._Brn_Phd+
1 1990 12,372           3.8           0.5            NA           3.1           0.6           0.1          82.2           8.0           1.9
2 2000 39,621           8.8           7.5           0.9           5.2           1.9           0.2          63.3          10.1           2.2
3 2010 59,400          17.4          12.3           3.0           6.9           3.3           1.0          46.9           7.5           1.7
4 2017 94,231          12.1          21.0           3.3           5.7           4.3           0.6          45.7           6.1           1.2

Key: Bac- = Bachelor's Degree or less, Mast = Master's Degree, Phd+ = PhD Degree or more

URL parameters (short)=
?minyear=1990&STATE=WA&geo=NATION&occ=Computer%20software%20developers%20(229)&group=CTZNSHP|EDUC

Census Data for Computer Software Developers in Washington in 2017

Percent of Computer Software Developers in Washington, grouped by BIRTHPLACE and SEX, sorted by India_Male, 2017

Computer software developers (229): 2017, grouped by BIRTHPLACE_TECH and SEX_M_F, 1000 or more workers (percent)

  Year              COUNTY  Count U.S._Born_M U.S._Born_F India_M India_F China_M China_F Other_M Other_F
1 2017 Snohomish County WA  7,859        45.0         5.0    19.3     1.5     2.6     3.7    19.9     2.8
2 2017      King County WA 72,589        40.4         5.6    16.3     5.8    11.6     1.8    15.8     2.7
3 2017    Pierce County WA  2,795        69.5        23.3     3.6     2.6     0.0     0.0     1.0     0.0
4 2017                (NA)  3,059        82.1         3.5     1.8     0.0     0.0     0.0    12.6     0.0
5 2017     Clark County WA  3,096        78.0         9.9     0.9     0.0     6.5     0.0     2.6     2.1
6 2017    Kitsap County WA  1,036        94.5         0.0     0.0     0.0     0.0     0.0     0.0     5.5
7 2017   Spokane County WA  1,105        74.4         6.4     0.0     0.0     8.5     0.0     0.0    10.7
8 2017  Thurston County WA  2,352        53.3         7.3     0.0     0.0     0.0     0.0    39.5     0.0

URL parameters (short)=
?STATE=WA&geo=COUNTY&occ=Computer%20software%20developers%20(229)&group=BIRTHPLACE_TECH|SEX_M_F&sortn=6&mincount=1000

Percent of Computer Software Developers in Washington, grouped by CITIZENSHIP and SEX, sorted by Non.citizen_Male, 2017

Computer software developers (229): 2017, grouped by CTZNSHP and SEX_M_F, 1000 or more workers (percent)

  Year              COUNTY  Count Non.ctzn_M Non.ctzn_F Naturlzd_M Naturlzd_F U.S._Brn_M U.S._Brn_F
1 2017      King County WA 72,589       34.0        8.3        8.4        1.9       41.8        5.6
2 2017 Snohomish County WA  7,859       33.6        4.1        7.5        3.9       45.8        5.0
3 2017   Spokane County WA  1,105        8.5        0.0        0.0       10.7       74.4        6.4
4 2017    Pierce County WA  2,795        4.7        0.0        0.0        2.6       69.5       23.3
5 2017                (NA)  3,059        4.6        0.0        7.6        0.0       84.2        3.5
6 2017  Thurston County WA  2,352        4.4        0.0       28.7        0.0       59.6        7.3
7 2017     Clark County WA  3,096        0.0        0.0       10.0        2.1       78.0        9.9
8 2017    Kitsap County WA  1,036        0.0        5.5        0.0        0.0       94.5        0.0

URL parameters (short)=
?STATE=WA&geo=COUNTY&occ=Computer%20software%20developers%20(229)&group=CTZNSHP|SEX_M_F&sortn=4&mincount=1000

Percent of Computer Software Developers in Washington, grouped by CITIZENSHIP and SEX, sorted as above, 1990

Computer software developers (229): 1990, grouped by CTZNSHP and SEX_M_F (percent)

   Year              COUNTY Count Non.ctzn_M Non.ctzn_F Naturlzd_M Naturlzd_F U.S._Brn_M U.S._Brn_F
3  1990      King County WA 7,023        3.2        2.1        3.0        1.8       65.5       24.4
4  1990 Snohomish County WA 1,149        1.6        0.0        0.0        0.0       75.2       23.2
8  1990   Spokane County WA   543        0.0        0.0        3.9        0.0       77.9       18.2
5  1990    Pierce County WA   855        1.1        0.0        2.5        0.0       71.6       24.9
6  1990                (NA)   957        0.9        0.6        0.0        1.3       63.6       33.5
1  1990  Thurston County WA   702       12.0        0.0        6.8        0.0       51.7       29.5
2  1990     Clark County WA   258        9.3        0.0        0.0        0.0       36.0       54.7
7  1990    Kitsap County WA   663        0.0        0.0        0.0        2.3       70.6       27.1

URL parameters (short)=
?minyear=1990&maxyear=1990&STATE=WA&geo=COUNTY&occ=Computer%20software%20developers%20(229)&group=CTZNSHP|SEX_M_F&sortn=4&mincount=0

Percent of Computer Software Developers in Washington, grouped by CITIZENSHIP and EDUCATION, sorted by Non.citizen_Bachelor, 2017

Computer software developers (229): 2017, grouped by CTZNSHP and EDUC, 1000 or more workers (percent)

  Year              COUNTY  Count Non.ctzn_Bac. Non.ctzn_Mast Non.ctzn_Phd. Naturlzd_Bac. Naturlzd_Mast Naturlzd_Phd. U.S._Brn_Bac. U.S._Brn_Mast U.S._Brn_Phd.
1 2017 Snohomish County WA  7,859          15.5          17.4           4.8          11.4           0.0           0.0          48.3           2.2           0.3
2 2017      King County WA 72,589          13.3          25.4           3.6           4.5           5.2           0.7          39.5           6.5           1.3
3 2017    Kitsap County WA  1,036           5.5           0.0           0.0           0.0           0.0           0.0          87.5           1.2           5.8
4 2017    Pierce County WA  2,795           4.7           0.0           0.0           2.6           0.0           0.0          75.3          14.8           2.5
5 2017                (NA)  3,059           4.6           0.0           0.0           6.4           0.0           1.2          82.2           4.8           0.7
6 2017  Thurston County WA  2,352           4.4           0.0           0.0          28.7           0.0           0.0          62.7           4.2           0.0
7 2017     Clark County WA  3,096           0.0           0.0           0.0           6.2           5.9           0.0          84.2           3.7           0.0
8 2017   Spokane County WA  1,105           0.0           0.0           8.5           0.0          10.7           0.0          74.4           6.4           0.0

Key: Bac- = Bachelor's Degree or less, Mast = Master's Degree, Phd+ = PhD Degree or more

URL parameters (short)=
?STATE=WA&geo=COUNTY&occ=Computer%20software%20developers%20(229)&group=CTZNSHP|EDUC&sortn=4&mincount=1000

Percent of Workers Who Are Non-citizens by Occupation in Washington in 2017, sorted by percent

                                                                      Non-
N                                              Occupation     Total citizen Percent  Occ1990
-- ------------------------------------------------------ --------- ------- ------- --------
1                   Farming, Forestry, Fishing, Gardening   103,451  40,690    39.3  Farming
2                            Computer software developers    94,231  34,343    36.4  SWDevel
3                                     Construction Trades   139,067  23,722    17.1 Constrct
4                                      Natural Scientists    21,138   2,877    13.6   NatSci
5                    Operators, Fabricators, and Laborers   111,725  13,046    11.7 Operator
6                Service Occupations, including Household   560,364  65,037    11.6  Service
7          Transportation and Material Moving Occupations   261,477  27,961    10.7 Transprt
8                    Mathematical and Computer Scientists    84,078   7,099     8.4 MathComp
9                        Precision Production Occupations    72,806   5,308     7.3 Productn
10                   Engineers, Architects, and Surveyors    70,930   4,980     7.0 Engineer
11                                Mechanics and Repairers    98,014   6,061     6.2 Mechanic
12              Executive, Administrative, and Managerial   571,091  34,578     6.1  Manager
13                          Health Diagnosing Occupations    35,328   2,087     5.9 HlthDiag
14                                      Sales Occupations   344,374  17,796     5.2    Sales
15         Teachers, Librarians, Archivists, and Curators   226,355  11,333     5.0  Teacher
16 Administrative Support Occupations, including Clerical   444,320  18,439     4.1 AdminSup
17               Health Assessment & Treating, Therapists   108,795   4,032     3.7 HlthCare
18                          Technologists and Technicians   100,795   2,974     3.0  Technol
19           Social Scientists, Urban Planners, Religious    61,254   1,492     2.4   SocSci
20                                     Lawyers and Judges    23,146     229     1.0   Lawyer
21                                   Military Occupations    47,101       0     0.0 Military
-- ------------------------------------------------------ --------- ------- ------- --------
                                           Total Employed 3,651,348 327,149     9.0    Total

Source for Census Data

U.S. Census Data available at IPUMS USA - using the following default sample from each year:

Most Recent Trade Adjustment Assistance (TAA) Data for Washington

          TAW                                   Company            Location    Decision  Workers  Reasons why you believe that separations that have occurred
0      95065              Futurewei Technologies, Inc.        Bellevue, WA         NaN       44  (+197 in CA) Due to listing of Huawei on the Designated Entity List, Futurewei, a subidiary of Huawei, announced a reduction of over 600 U.S. positions.
1      95060                  Seneca Foods Corporation       Sunnyside, WA         NaN      300  Unable to compete with imported "like" product from China, Mexico and Canada. (canned food)
2      95053                            Filson Company         Seattle, WA         NaN       39  Filson is curtailing workers in Seattle & importing goods from factories outside the US for sale in their outlet store. (clothing manufacture)
3      95019               REC Solar Grade Silicon LLC      Moses Lake, WA         NaN       10  Affected by the partial closure at the Moses Lake Plan. See TA-W-94132. (Silane and Polysilicon)
4      95004              Providence St. Joseph Health          Renton, WA         NaN  400-500  Company is outsourcing many duties to companies that have Multi-national work centers. Workers state that their jobs are being outsourced to India & the Philippines. 
5      94983                                   HP Inc.       Vancouver, WA         NaN       20  Workers in the QA dept (including R&D) from Vancouver & San Diego had their duties transferred to HP Inc. Singapore & possibly other contractors outside the US.
6      94974  Leased Workers from Apex Systems, Eliass        Kirkland, WA   7/24/2019      240  Closing the Kirkland facility and relocating to Canada. (On-line merchandise support, call center customer support)
7      94926                    Beyondsoft Corporation       Vancouver, WA   7/28/2019      10+  US workers are being displaced by Beyondsoft workers in China and Singapore. (software engineers, testers & support personnel for the HP printer division)
8      94908                        Smartfocus US Inc.        Bellevue, WA   7/12/2019        6   Over time the business and support team duties were transferred to the Company's offices in London England and Barcelona Spain.
9      94864              Teck Washington Incorporated  Metaline Falls, WA         NaN      210  (+10 in 10/18)  Production will be curtailed at this site and increased at other sites operated by the corporation to satisfy global need for theses metals. 
10     94863                           Light Speed LLC        Bellevue, WA         NaN       +4  Job opportunities are moving to India and the departments are going through restructuring to bring in investors. (software developer, QA, tech program managing)
11     94858  Teck Washington Incorporated - Pend Orei  Metaline Falls, WA         NaN      250  Foreign competition has resulted in a reduction in zinc price since mid 2018.
12     94809                       Web.com Group, Inc.         Spokane, WA   6/11/2019      +64  Work is leaving the U.S. & relocating to Canada. Canada has tax incentives for companies to grow in certain regions resulting in cheaper labor. (Website Solutions)
13     94793                               Lumedx Inc.        Bellevue, WA         NaN        5  Ludmedx opened a facility in Pune, India and has since trained & transferred duties to personnel in India. (Technical Support)
14     94655                  Lowe's Home Centers, LLC        Kirkland, WA   6/18/2019      111  Closing the Kirkland facility and relocating to Canada. (On-line merchandise support, call center customer support)
15     94543                                      Epiq         Seattle, WA   6/26/2019       30  Epiq has outsourced facets of their support operations to Sonata Software headquartered in Bengalru, India. (computer code, production support & DB maintenance)
16     94539                                  Jeld-Wen          Yakima, WA   4/12/2019      180  Under pressure of imports of "like" products from Canada, China & Mexico. (doors & windows)
17     94518                        Sigma Design, Inc.       Vancouver, WA    4/7/2019       80  HP has a long track record of offshoring to countries like China & India in order to stay competitive (computer design, development & testing)
18     94489                           Loud Audio, LLC          Auburn, WA   5/24/2019     8-10  Warehouse workers affected by closure of Woodinville facility.
19     94418                            Valente Global        Bellevue, WA         NaN       20  Company administered Microsoft's online store. Mindtree assumed operations & hired 4 former employees to help transition the work their site in Bengaluru India.
20     94393           Grays Harbor Community Hospital        Aberdeen, WA    1/9/2019       21  All patient/revenue cycle duties contracted to entity in India - Vee Technology & Avec Health Solutions.>
21    94248A                           Loud Audio, LLC          Auburn, WA    1/8/2019      10+  Company changed ownership & the operations department has been outsourced to China.
22     94248                           Loud Audio, LLC     Woodinville, WA    1/8/2019        "  "
23     94245                 Wargaming (Seattle), Inc.         Redmond, WA    1/3/2019      150  Parent company is Belarusian-Cypriot based. Work has gone to Wargaming's facility in Kiev, Ukraine. (video game development & support)
24     94150  Healthcare Management Administrators, In        Bellevue, WA   10/1/2018       16  Medical claims duties transferred to HMA's subcontractor, MDI, located in India. The HMA workers trained their replacements.
25     94132               REC Solar Grade Silicon LLC      Moses Lake, WA   4/18/2019       6+  Layoffs due to foreign competition. (Silane and Polysilicon)
26     94118                         Ciena Corporation  Spokane Valley, WA  10/22/2018       75  Tech support group trained their counterparts at Ciena's facility in Gurgaon, India. Workers told this was a cost saving measure.
27     94007            Centralia Knitting Mills, Inc.       Centralia, WA    8/9/2018       20  Closure caused by imports of like products from countries outside the U.S. like Mexico, China, Malaysia, & India. (clothing)
28    93967D                                KeyBank NA          Tacoma, WA   8/24/2018       20  Services are being outsourced to India. (Financial Services - Network Operations Center and Enterprise Resolution Center)
29     93952              Honeywell International Inc.        Lynnwood, WA   8/15/2018       15  Workers in this department were made to train workers in facilities in China and India and the jobs were moved there. (product management & engineering)
30     93821                  Columbia River Logistics       Vancouver, WA    9/7/2018       25  (+252 in OR) Competition from increased imports. (paper company)
31     93817                            Star Forge LLC         Seattle, WA    1/4/2019      110  Industries company supplied product to have outsourced their production to outside the U.S., including Boeing.
32     93816                 Philips North America LLC         Bothell, WA   7/31/2018
33     93798                     Joyson Safety Systems      Moses Lake, WA   5/31/2018
34     93787                           Airtronics Inc.        Bellevue, WA   5/29/2018
35    93781A                 Philips North America LLC         Bothell, WA    9/4/2018
36     93757                    A.O. Smith Corporation          Renton, WA   7/26/2018
37     93732                                Itron Inc.    Liberty Lake, WA    5/9/2018
38     93730      Allianz Global Corporate & Specialty         Spokane, WA    5/9/2018
39     93679             Aviation Partners Boeing Inc.         Seattle, WA   6/29/2018
40     93624   Georgia-Pacific Consumer Operations LLC           Camas, WA   1/22/2019
41     93623           The Travelers Indemnity Company         Spokane, WA   5/18/2018
42    93602A           Grays Harbor Community Hospital        Aberdeen, WA  11/28/2018
43    93602B           Grays Harbor Community Hospital        Aberdeen, WA  11/28/2018
44     93602           Grays Harbor Community Hospital        Aberdeen, WA  11/28/2018
45     93574                               Zones, Inc.          Auburn, WA   4/17/2018
46     93571                  S.E. Wood Products, Inc.        Colville, WA   5/10/2018
47     93549                                 CellNetix         Seattle, WA    4/9/2018
48     93381                                    Altair         Everett, WA   2/27/2018
49     93368                              Avanade Inc.         Seattle, WA   4/20/2018
50     93351                      Sunlight Supply Inc.       Vancouver, WA   1/25/2018
51     93348                    M.Torres America, Inc.         Everett, WA    5/4/2018
52     93347                     Kellogg Sales Company          Sumner, WA   2/15/2018
53     93285  TrueBlue, Inc. and StaffManagement, Inc.          Tacoma, WA  12/17/2017
54    93263A  On-Site Leased Workers from Alaska Aggre        Republic, WA   12/1/2017
55     93263                 Echo Bay Minerals Company        Republic, WA   12/1/2017
56    93262P                       Boyd Coffee Company        Lynnwood, WA  12/14/2017
57    93262Z                       Boyd Coffee Company         Spokane, WA  12/14/2017
58     93225                                  ADP, LLC         Lynwood, WA   1/18/2018
59     93213                  Windstream Services, LLC       Vancouver, WA   12/5/2017
60     93199          North Pacific Paper Company, LLC        Longview, WA  12/18/2017
61     93198     International Business Machines (IBM)         Seattle, WA   11/7/2017
62     93196              Hearth and Home Technologies        Colville, WA   11/8/2017
63     93142                        GM Nameplate, Inc.         Seattle, WA  12/21/2017
64     93141                              Lincare Inc.         Spokane, WA   9/26/2017
65     93102             Sharp Electronics Corporation           Camas, WA   2/20/2018
66     93012                 Tata Consultancy Services         Redmond, WA   7/29/2017
67     92993                          Zodiac Aerospace      Bellingham, WA  12/15/2017
68     92903                        The Boeing Company         Tukwila, WA    8/8/2017
69     92877                         MarketSource, Inc       Vancouver, WA    8/7/2017
70     92833                       Jamco America, Inc.         Everett, WA  12/12/2017
71     92812       Sharp Laboratories of America, Inc.           Camas, WA    7/7/2017
72     92775                          MultiCare Tacoma          Auburn, WA   7/29/2017
73     92721       Nippon Paper Industries USA Co. Ltd    Port Angeles, WA   10/2/2017
74     92709            Stampede Forest Products, Inc.            Omak, WA   4/21/2017
75     92663             Lionbridge Technologies, Inc.        Bellevue, WA   6/30/2017
76    92661A          McFarland Cascade Holdings, Inc.       Arlington, WA   6/14/2017
77    92661B          McFarland Cascade Holdings, Inc.         Shelton, WA   6/14/2017
78     92661          McFarland Cascade Holdings, Inc.       Rochester, WA   6/14/2017
79     92657                         The Seattle Times         Seattle, WA   7/22/2017
80     92569           Triumph Composite Systems, Inc.         Spokane, WA   3/14/2017
81     92543                           DBBuilder, Inc.        Lynnwood, WA    3/1/2017
82     92509                 Omak Forest Products, LLC            Omak, WA    3/1/2017
83    92478A  Pacific Bioscience Laboratories Products            Kent, WA   1/18/2017
84     92478  Pacific Bioscience Laboratories Products         Redmond, WA   1/18/2017
85     92453                    Garco Building Systems  Airway Heights, WA    4/3/2017
86     92452                         Intel Corporation          DuPont, WA   3/28/2017
87     92432                    Blue Sea Systems, Inc.      Bellingham, WA   2/27/2017
88     92341                            Spectrum Glass     Woodinville, WA   2/27/2017
89     92330               Shoes.com Technologies Inc.         Seattle, WA  11/22/2016
90     92328                       Market Source, Inc.       Vancouver, WA   2/27/2017
91     92318            Vancouver Iron and Steel, Inc.       Vancouver, WA   1/18/2017
92    92293K                                   HP Inc.       Vancouver, WA  12/15/2016
93     92243                                    Harman          Cheney, WA  10/11/2016
94     92089                       Precor Incorporated     Woodinville, WA  10/20/2016
95     92080           Xerox Commercial Solutions, LLC         Redmond, WA   12/9/2016
96     92065                          Rane Corporation        Mukilteo, WA   9/22/2016
97     92010      Atos IT Solutions and Services, Inc.         Redmond, WA  12/27/2016
98     91950       Branded Entertainment Network, Inc.         Seattle, WA   7/29/2016
99     91922          Seattle-Snohomish Mill Co., Inc.       Snohomish, WA   8/18/2017
100    91896                            Smilebox, Inc.         Redmond, WA    7/6/2016
101    91868                     Hewlett Packard, Inc.       Vancouver, WA   6/27/2016
102    91847                   Teledyne Blueview, Inc.         Bothell, WA   6/10/2016
103    91845                Olympic Panel Products LLC         Shelton, WA    9/2/2016
104    91773  CH2M Hill Engineers, Inc., CH2M Hill, In      Bellingham, WA   6/10/2016
105    91754                  QBE North Americas, INC.        Bellevue, WA    7/4/2016
106  91752AA                     The McClatchy Company       Kennewick, WA   6/22/2016
107   91752X                     The McClatchy Company      Bellingham, WA   6/22/2016
108   91752Y                     The McClatchy Company         Olympia, WA   6/22/2016
109   91752Z                     The McClatchy Company          Tacoma, WA   6/22/2016
110    91726        Chemtrade Performance Chemical LLC          Kalama, WA   5/13/2016
111    91722                              Labinal, LLC         Everett, WA   5/20/2016
112    91699                        Hexcel Corporation            Kent, WA   9/22/2016
113    91682         Recreational Equipment Inc. (REI)            Kent, WA    5/3/2016
114   91616A               Mary's River Lumber Company       Montesano, WA   12/7/2016
115    91574                Sensata Technologies, Inc.         Everett, WA   8/10/2016
116   91573A                              nLight, Inc.       Vancouver, WA   6/24/2016
117    91573                              nLight, Inc.       Vancouver, WA   6/24/2016
118    91548        Sensata Technologies, Incorporated         Everett, WA   8/19/2016
119    91437                  Hoquiam Plywood Products         Hoquiam, WA    5/5/2016
Source: U.S. Department of Labor, Trade Adjustment Assistance (TAA) data

Other Related Data for Washington

Worker Adjustment and Retraining Notification (WARN)

H-1B and Related Data by State
H-1B Data
OPT Data