On April 1, 2019, the USCIS (U.S. Citizenship and Immigration Services) launched the H-1B Employer Data Hub to provide information on employers petitioning for H-1B workers. Also posted is a description of its use titled "Understanding Our H-1B Employer Data Hub". The hub page states that the complete files for individual fiscal years can be downloaded from the H-1B Employer Data Hub Files page. These files were used to create an R Shiny application that extends the current functionality of the USCIS Data Hub. Following is an example:
Go to the USCIS H-1B Employer Data Hub, select 2020 for the Fiscal Year, and press the Search button. The following first 10 of a reported 55,239 entries will be displayed:
Fiscal                                  Initial     Initial
Year    Employer                        Approval    Denial
2020                                        0           1
2020                                        0           0
2020                                        1           0
2020    01INTERACTIVE INC                   1           1
2020    01INTERACTIVE INC                   0           1
2020    05MEDIA INC                         1           0
2020    0965688 BC LTD DBA PROCOGIA         1           1
2020    1 800 FLOWERS COM INC               1           0
2020    1 BETHESDA DRIVE OPERATING CO LLC   0           0
2020    1 DUST TECHNOLOGY LLC               0           1
Additional information is available by clicking the arrows on the far right. Now, go to the R Shiny app, ensure that the Start Year and End Year are set to 2020, place checks in the "Output all records" and "Output employer details" checkboxes, select "Employer" in the "Sort by" select list, and press the Submit button. The first row of data output reports that there are 55,666 records, same as was reported by the data hub. Following are the first 10 rows in the last table output:
  FYear Records   I.A.  I.D.   C.A.  C.D. Workers I.A.R C.A.R T.A.R
1  2020   55239 122894 18276 303830 21639  426724  87.1  93.4  91.4

                             Employer Records I.A. I.D. C.A. C.D. Workers I.A.R C.A.R T.A.R NAICS Tax.ID State             City   ZIP
1                                           1    1    0    0    0       1 100.0   NaN 100.0    54    777    CA         GLENDORA 91740
2                                           1    0    0    1    0       1   NaN 100.0 100.0    62    458    CA       EMERYVILLE 94608
3                                           1    0    1    0    0       0   0.0   NaN   0.0    71   3557    NY          ASTORIA 11106
4                   01INTERACTIVE INC       1    1    1    0    0       1  50.0   NaN  50.0    54   9852    CA CITY OF INDUSTRY 91745
5                   01INTERACTIVE INC       1    0    1    0    0       0   0.0   NaN   0.0    54   9852    CA HACIENDA HEIGHTS 91745
6                         05MEDIA INC       1    1    0    0    0       1 100.0   NaN 100.0    54   4558    CA        SAN DIEGO 92130
7         0965688 BC LTD DBA PROCOGIA       1    1    1    1    0       2  50.0 100.0  66.7    54    209    WA         BELLEVUE 98006
8               1 800 FLOWERS COM INC       1    1    0    3    0       4 100.0 100.0 100.0    45   7311    NY      CARLE PLACE 11514
9   1 BETHESDA DRIVE OPERATING CO LLC       1    0    0    1    0       1   NaN 100.0 100.0    62   5614    NY          HORNELL 14843
10              1 DUST TECHNOLOGY LLC       1    0    1    0    0       0   0.0   NaN   0.0    99   5330    MO     CHESTERFIELD 63017
As can be seen, the rows are pretty much identical. The only difference is that the three lines with no employer are reversed in order. Also, note that lines 3, 5, and 10 have workers equal to zero. This is because there were no initial approvals (I.A.) or continuing approvals (C.A.) for those employers.
The column names I.A., I.D., C.A., and C.D. stand for Initial Approval, Initial Denial, Continuing Approval, and Continuing Denial, respectively. If the Initial Approval label is clicked in the header of the data hub output, the data will be sorted in descending order by Initial Approval and the following 10 rows will be output:
Fiscal Year Employer
Initial Approval
sorted descending. Select to sort ascending.    Initial Denial
Fiscal                                  Initial     Initial
Year    Employer                        Approval    Denial

2020    AMAZON COM SERVICES LLC             3737    94
2020    INFOSYS LIMITED                     3487    1958
2020    TATA CONSULTANCY SVCS LTD           2401    264
2020    COGNIZANT TECHNOLOGY SOLUTIONS US   1991    1519
2020    MICROSOFT CORPORATION               1788    42
2020    GOOGLE LLC                          1673    21
2020    CAPGEMINI AMERICA INC               1399    357
2020    HCL AMERICA INC                     1301    399
2020    IBM CORPORATION                     1281    116
2020    FACEBOOK INC                        1168    7
If "I.A." is selected in the "Sort by" select list in the R Shiny app, following are the first 10 records output in the last group of data on the page:
                             Employer Records I.A. I.D.  C.A. C.D. Workers I.A.R C.A.R T.A.R NAICS Tax.ID State            City   ZIP
1             AMAZON COM SERVICES LLC       3 3737   94  7556  119   11293  97.5  98.4  98.1    45   4687    WA         SEATTLE 98121
2                     INFOSYS LIMITED      17 3493 1968  6237 1562    9730  64.0  80.0  73.4    54    235    TX      RICHARDSON 75082
3           TATA CONSULTANCY SVCS LTD       7 2403  264  6008  673    8411  90.1  89.9  90.0    54   9806    MD       ROCKVILLE 20850
4   COGNIZANT TECHNOLOGY SOLUTIONS US       7 1992 1520 12740 2493   14732  56.7  83.6  78.6    54   4155    TX COLLEGE STATION 77845
5               MICROSOFT CORPORATION       4 1788   42  5192   75    6980  97.7  98.6  98.4    51   4442    WA         REDMOND 98052
6                          GOOGLE LLC       1 1673   21  4129   35    5802  98.8  99.2  99.0    54   3581    CA   MOUNTAIN VIEW 94043
7               CAPGEMINI AMERICA INC       2 1399  357  3775  169    5174  79.7  95.7  90.8    54   5929    IL         CHICAGO 60606
8                     HCL AMERICA INC       3 1302  399  2792  511    4094  76.5  84.5  81.8    54   5035    CA       SUNNYVALE 94085
9                     IBM CORPORATION       2 1281  116  1035   52    2316  91.7  95.2  93.2    54   1985    NC          DURHAM 27709
10                       FACEBOOK INC       1 1168    7  3196   25    4364  99.4  99.2  99.3    51   5019    CA      MENLO PARK 94025
As can be seen, the data is identical to the data output by the USCIS data hub. It does include the additional column "Workers". By default, this is set to the sum of I.A. (Initial Approval) and C.A. (Coninuing Approval) but this can be changed via the "Include in Workers" checkboxes. In any case, these are the 10 records with the highest number of Initial H-1B approvals in 2020. However, there appears to be a separate record for each combination of Employer, NAICS, Tax.ID, State, City, and ZIP.
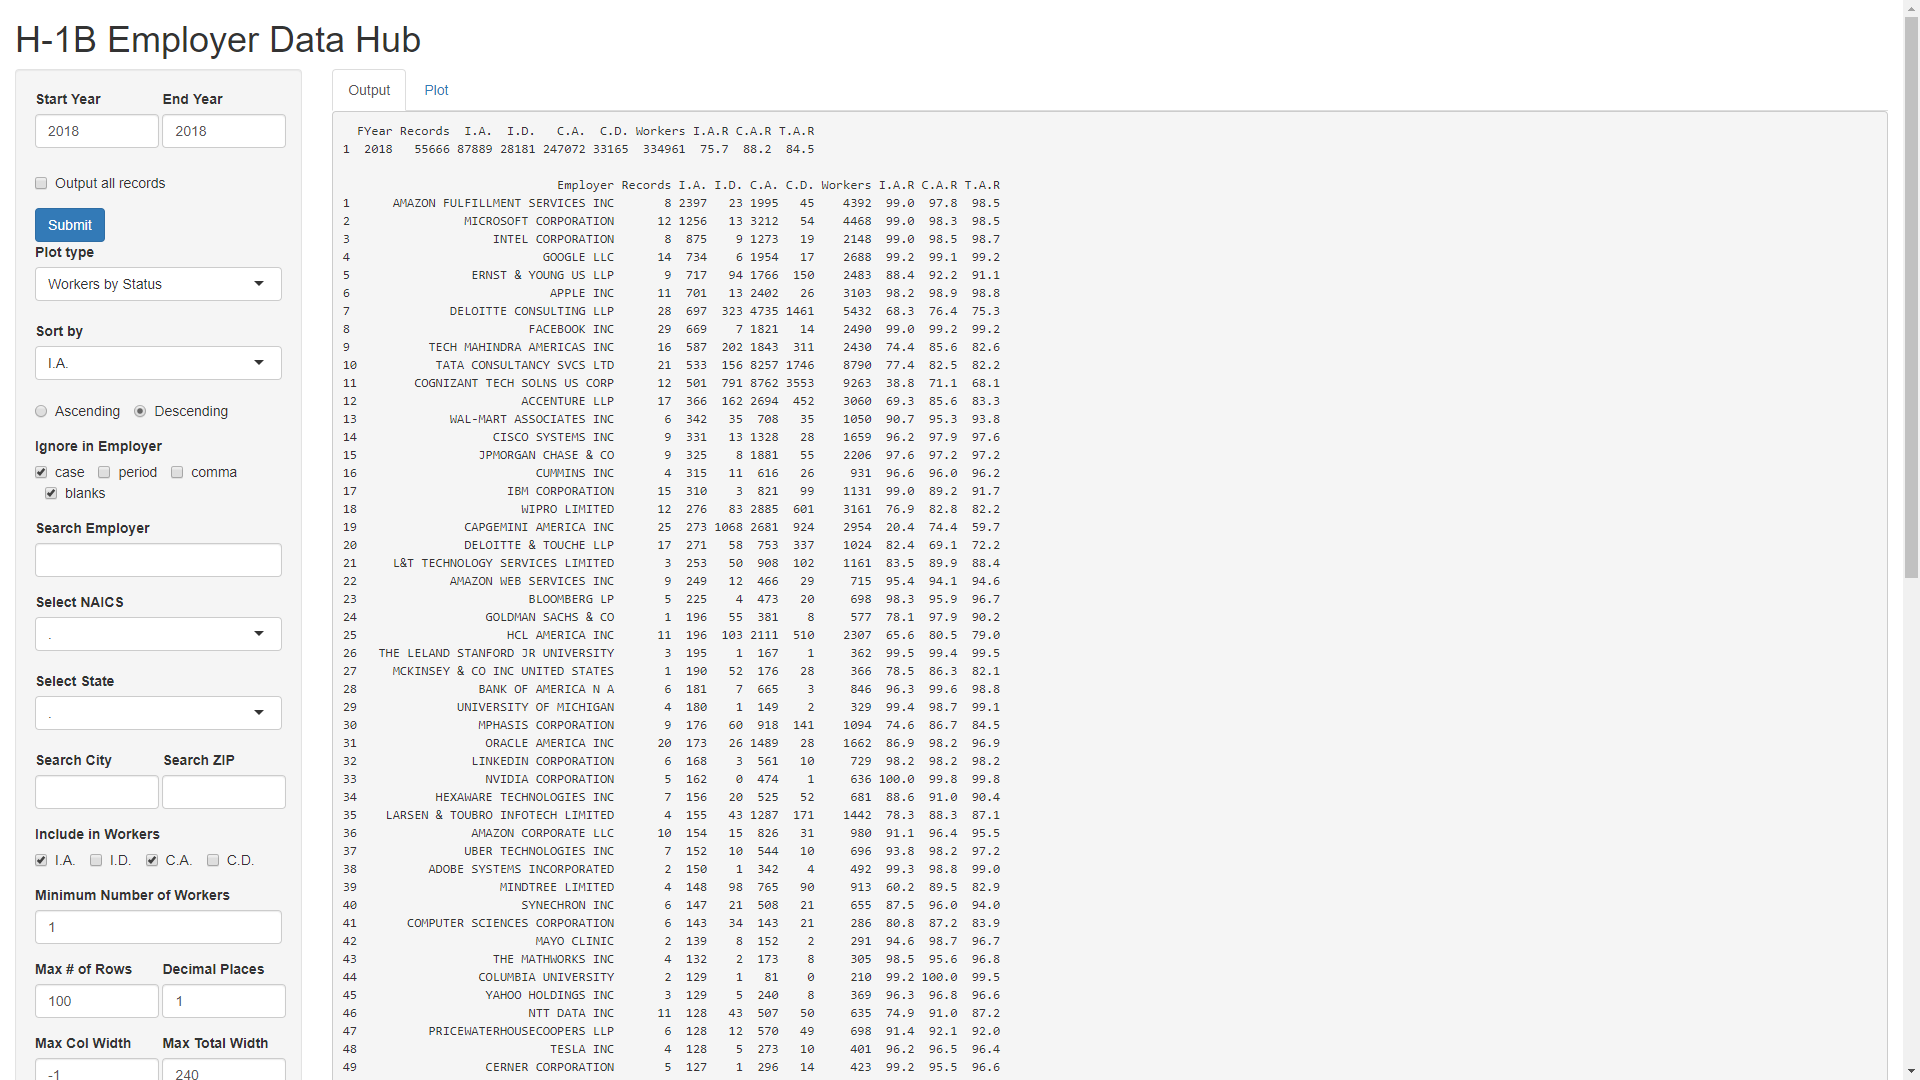
The R Shiny app will also show the totals by year and by employer. This can be seen in the following screenshot:
Following are the top 10 records from the prior section:
   FYear                           Employer I.A. I.D. C.A. C.D. NAICS Tax.ID State              City   ZIP Workers
1   2018    AMAZON FULFILLMENT SERVICES INC 2392   22 1980   45    45   4687    WA           SEATTLE 98121    4372
2   2018              MICROSOFT CORPORATION 1251   13 3199   54    51   4442    WA           REDMOND 98052    4450
3   2018                  INTEL CORPORATION  873    9 1260   19    33   2743    AZ          CHANDLER 85248    2133
4   2018                         GOOGLE LLC  724    6 1931   17    54   3581    CA     MOUNTAIN VIEW 94043    2655
5   2018               ERNST & YOUNG US LLP  716   93 1760  150    54   5596    NJ          SECAUCUS  7094    2476
6   2018                          APPLE INC  697   13 2386   25    33   4110    CA         CUPERTINO 95014    3083
7   2018                       FACEBOOK INC  650    5 1406   12    51   5019    CA        MENLO PARK 94025    2056
8   2018            DELOITTE CONSULTING LLP  592  295 4193 1281    54   4513    PA      PHILADELPHIA 19103    4785
9   2018         TECH MAHINDRA AMERICAS INC  579  201 1781  300    54   2696    NJ  SOUTH PLAINFIELD  7080    2360
10  2018          TATA CONSULTANCY SVCS LTD  528  152 8227 1744    54   9806    MD         ROCKVILLE 20850    8755
Following are the top 10 employers by I.A. (Initial Approvals) shown in the above screenshot:
                              Employer Records I.A. I.D. C.A. C.D. Workers I.A.R C.A.R T.A.R
1      AMAZON FULFILLMENT SERVICES INC       8 2397   23 1995   45    4392  99.0  97.8  98.5
2                MICROSOFT CORPORATION      12 1256   13 3212   54    4468  99.0  98.3  98.5
3                    INTEL CORPORATION       8  875    9 1273   19    2148  99.0  98.5  98.7
4                           GOOGLE LLC      14  734    6 1954   17    2688  99.2  99.1  99.2
5                 ERNST & YOUNG US LLP       9  717   94 1766  150    2483  88.4  92.2  91.1
6                            APPLE INC      11  701   13 2402   26    3103  98.2  98.9  98.8
7              DELOITTE CONSULTING LLP      28  697  323 4735 1461    5432  68.3  76.4  75.3
8                         FACEBOOK INC      29  669    7 1821   14    2490  99.0  99.2  99.2
9           TECH MAHINDRA AMERICAS INC      16  587  202 1843  311    2430  74.4  85.6  82.6
10           TATA CONSULTANCY SVCS LTD      21  533  156 8257 1746    8790  77.4  82.5  82.2
As can be seen, the second 10 rows do not contain the FYear, NAICS, Tax.ID, State, City, or ZIP columns. That's because the records have been grouped by just the Employer. However, it contains the additional columns of Records which is simply the number of records that were found and combined for each employer. Also, it contains the new columns I.A.R, C.A.R, and T.A.R. These are simply the Initial Approval Rate, Continuing Approval Rate, and Total Approval Rate as calculated from I.A., I.D., C.A., and C.D.
One item of interest is that the approval rates of the consulting companies (ERNST & YOUNG US LLP, DELOITTE CONSULTING LLP, TECH MAHINDRA AMERICAS INC, and TATA CONSULTANCY SVCS LTD) are all lower than the "regular" 6 tech companies. The lowest Initial Approval Rate for these latter 6 companies is 98.2 percent while the highest Initial Approval Rate for the 4 consulting companies is 88.4 percent. To see if this pattern extends beyond the top 10 companies, change "Sort by" to I.A.R (Initial Approval Rate). In order to focus on the largest users of Initial Approvals, set the "Include in Workers" checkboxes to only include I.A. (Initial Approvals) and set "Minimum Number of Workers" to 150. That causes the following table to be output:
                            Employer Records I.A. I.D. C.A. C.D. Workers I.A.R C.A.R T.A.R
1                 NVIDIA CORPORATION       5  162    0  474    1     162 100.0  99.8  99.8
2  THE LELAND STANFORD JR UNIVERSITY       3  195    1  167    1     195  99.5  99.4  99.5
3             UNIVERSITY OF MICHIGAN       4  180    1  149    2     180  99.4  98.7  99.1
4         ADOBE SYSTEMS INCORPORATED       2  150    1  342    4     150  99.3  98.8  99.0
5                         GOOGLE LLC      14  734    6 1954   17     734  99.2  99.1  99.2
6    AMAZON FULFILLMENT SERVICES INC       8 2397   23 1995   45    2397  99.0  97.8  98.5
7                       FACEBOOK INC      29  669    7 1821   14     669  99.0  99.2  99.2
8                    IBM CORPORATION      15  310    3  821   99     310  99.0  89.2  91.7
9                  INTEL CORPORATION       8  875    9 1273   19     875  99.0  98.5  98.7
10             MICROSOFT CORPORATION      12 1256   13 3212   54    1256  99.0  98.3  98.5
11                      BLOOMBERG LP       5  225    4  473   20     225  98.3  95.9  96.7
12                         APPLE INC      11  701   13 2402   26     701  98.2  98.9  98.8
13              LINKEDIN CORPORATION       6  168    3  561   10     168  98.2  98.2  98.2
14               JPMORGAN CHASE & CO       9  325    8 1881   55     325  97.6  97.2  97.2
15                       CUMMINS INC       4  315   11  616   26     315  96.6  96.0  96.2
16               BANK OF AMERICA N A       6  181    7  665    3     181  96.3  99.6  98.8
17                 CISCO SYSTEMS INC       9  331   13 1328   28     331  96.2  97.9  97.6
18           AMAZON WEB SERVICES INC       9  249   12  466   29     249  95.4  94.1  94.6
19             UBER TECHNOLOGIES INC       7  152   10  544   10     152  93.8  98.2  97.2
20              AMAZON CORPORATE LLC      10  154   15  826   31     154  91.1  96.4  95.5
21           WAL-MART ASSOCIATES INC       6  342   35  708   35     342  90.7  95.3  93.8
22         HEXAWARE TECHNOLOGIES INC       7  156   20  525   52     156  88.6  91.0  90.4
23              ERNST & YOUNG US LLP       9  717   94 1766  150     717  88.4  92.2  91.1
24                ORACLE AMERICA INC      20  173   26 1489   28     173  86.9  98.2  96.9
25   L&T TECHNOLOGY SERVICES LIMITED       3  253   50  908  102     253  83.5  89.9  88.4
26             DELOITTE & TOUCHE LLP      17  271   58  753  337     271  82.4  69.1  72.2
27   MCKINSEY & CO INC UNITED STATES       1  190   52  176   28     190  78.5  86.3  82.1
28  LARSEN & TOUBRO INFOTECH LIMITED       4  155   43 1287  171     155  78.3  88.3  87.1
29                GOLDMAN SACHS & CO       1  196   55  381    8     196  78.1  97.9  90.2
30         TATA CONSULTANCY SVCS LTD      21  533  156 8257 1746     533  77.4  82.5  82.2
31                     WIPRO LIMITED      12  276   83 2885  601     276  76.9  82.8  82.2
32               MPHASIS CORPORATION       9  176   60  918  141     176  74.6  86.7  84.5
33        TECH MAHINDRA AMERICAS INC      16  587  202 1843  311     587  74.4  85.6  82.6
34                     ACCENTURE LLP      17  366  162 2694  452     366  69.3  85.6  83.3
35           DELOITTE CONSULTING LLP      28  697  323 4735 1461     697  68.3  76.4  75.3
36                   HCL AMERICA INC      11  196  103 2111  510     196  65.6  80.5  79.0
37      COGNIZANT TECH SOLNS US CORP      12  501  791 8762 3553     501  38.8  71.1  68.1
38             CAPGEMINI AMERICA INC      25  273 1068 2681  924     273  20.4  74.4  59.7
All of the employers from HEXAWARE TECHNOLOGIES INC (number 22) on appear to be consulting companies except for ORACLE AMERICA INC and GOLDMAN SACHS & CO. In fact, all but those and MCKINSEY & CO INC UNITED STATES and L&T TECHNOLOGY SERVICES LIMITED appear in the Wikipedia list of IT consulting firms. All of the employers before HEXAWARE TECHNOLOGIES INC appear not to be IT consulting firms. Hence, there does seem to be a lower initial approval rate for consulting firms. The reason for this is not clear from the data. An article titled Avoid These 3 Reasons for H-1B Denials lists those 3 reasons as follows:
In any event, it's also worth noting that the two universities listed, Stanford and Michigan, had initial approval rates of 99.5 and 99.4, respectively. In fact, most of the most recognizable tech firms have initial approval rates of 99 percent and above. Apple and LinkedIn trailed slightly with 98.2 percent and Cisco had 96.2 percent. Hence, the recent increase in denials appear to be chiefly affecting consulting firms. This is not that surprising since such firms tend to hire workers with lower-level skills which may not qualify as unique. Also, there may be more difficulty in showing an employer-employee relationship since the H-1B workers are typically sent to work at client companies.
It should be noted that the two groups of rows contain the same 10 companies though the order of FACEBOOK INC and DELOITTE CONSULTING LLP are swapped. Also, the values of I.A., I.D., C.A., and C.D. in the second 10 rows are all greater than or equal to the corresponding values in the first 10 rows. That is because the values in the second 10 rows equal the corresponding values in the first 10 rows plus the values from other records that matched each Employer name. The largest jump in Workers is for DELOITTE CONSULTING LLP which jumps from 4785 to 5432. A list of all of the matching records for can be seen by entering DELOITTE CONSULTING LLP into "Search Employer", checking the "Output all records" checkbox, and pressing the Submit button. The following data is output:
  FYear Records I.A. I.D. C.A. C.D. Workers I.A.R C.A.R T.A.R
1  2018      28  697  323 4735 1461    5432  68.3  76.4  75.3

                 Employer Records I.A. I.D. C.A. C.D. Workers I.A.R C.A.R T.A.R
1 DELOITTE CONSULTING LLP      28  697  323 4735 1461    5432  68.3  76.4  75.3

   FYear                Employer I.A. I.D. C.A. C.D. NAICS Tax.ID State         City   ZIP Workers
1   2018 DELOITTE CONSULTING LLP  592  295 4193 1281    54   4513    PA PHILADELPHIA 19103    4785
2   2018 DELOITTE CONSULTING LLP   99   28  420  145    54   4513    MA       BOSTON  2210     519
3   2018 DELOITTE CONSULTING LLP    1    0    1    0    54   4513    PA PHILADELPHIA 19103       2
4   2018 DELOITTE CONSULTING LLP    1    0    0    0    54   1513    PA PHILADELPHIA 19103       1
5   2018 DELOITTE CONSULTING LLP    1    0    1    0    54   4513            TORONTO    NA       2
6   2018 DELOITTE CONSULTING LLP    1    0   93   31    54   4513    GA      ATLANTA 30309      94
7   2018 DELOITTE CONSULTING LLP    1    0    0    0    51   4513    PA PHILADELPHIA 19103       1
8   2018 DELOITTE CONSULTING LLP    1    0    0    0    54   5413    PA PHILADELPHIA 19103       1
9   2018 DELOITTE CONSULTING LLP    0    0    2    0    54   4513    PA PHILADELPHIA 19103       2
10  2018 DELOITTE CONSULTING LLP    0    0    2    0    54   4513    PA PHILADELPHIA 19103       2
11  2018 DELOITTE CONSULTING LLP    0    0    1    0    54   4451    PA PHILADELPHIA 19103       1
12  2018 DELOITTE CONSULTING LLP    0    0    1    0    54   4512    PA PHILADELPHIA 19103       1
13  2018 DELOITTE CONSULTING LLP    0    0    3    0    54   4513    MA       BOSTON  2110       3
14  2018 DELOITTE CONSULTING LLP    0    0    1    0    54   4513    PA   NEW CASTLE 16103       1
15  2018 DELOITTE CONSULTING LLP    0    0    1    0    54   4513    PA PHILADELPHIA 19102       1
16  2018 DELOITTE CONSULTING LLP    0    0    1    0    54   4513    PA PHILADELPHIA 19107       1
17  2018 DELOITTE CONSULTING LLP    0    0    2    0    54   4513    PA PHILADELPHIA 19130       2
18  2018 DELOITTE CONSULTING LLP    0    0    1    0    54   4551    PA PHILADELPHIA 19103       1
19  2018 DELOITTE CONSULTING LLP    0    0    1    1    54   4613    PA PHILADELPHIA 19103       1
20  2018 DELOITTE CONSULTING LLP    0    0    1    0    54   4513    PA PHILADELPHIA 19103       1
21  2018 DELOITTE CONSULTING LLP    0    0    2    0    54   5451    PA PHILADELPHIA 19103       2
22  2018 DELOITTE CONSULTING LLP    0    0    5    0    54   4513    PA PHILADELPHIA 19103       5
23  2018 DELOITTE CONSULTING LLP    0    0    1    0    54   4513    PA PHILADELPHIA 19103       1
24  2018 DELOITTE CONSULTING LLP    0    0    1    0    54    817    PA PHILADELPHIA 19103       1
25  2018 DELOITTE CONSULTING LLP    0    0    1    0    54   2549    PA PHILADELPHIA 19103       1
As can be seen, most of the increase in workers was due to 519 workers in Boston and 94 workers in Atlanta. However, also visible are a few apparent typos. Note that all of the Tax.ID values are 4513 except for values of 1513, 5413, 4451, 4512, 4551, 4613, 5451, 817, and 2549. At least the values of 1513, 5413, 4512, and 4613 are likely typos of 4513. Also, the ZIP values of 19102, 19107, and 19130 are likely typos of 19103. The possibility of typos is mentioned in the section "Data Accuracy" at this USCIS document that states "For example, an applicant may mix up numbers in their tax identification number."
As seen in the prior screenshot, the R Shiny app first outputs the totals by year. Hence, the first data output in the screenshot is the following:
  FYear Records   I.A.  I.D.   C.A.  C.D. Workers I.A.R C.A.R T.A.R
1  2020   55239 122894 18276 303830 21639  426724  87.1  93.4  91.4
The R Shiny app can output the data for any span of available years by setting both the Start Year and End Year. For example, setting the Start Year to 2009, the End Year to 2020 and pressing the Submit button causes the initial data output to be the following (this may take 30 seconds or so):
   FYear Records   I.A.  I.D.   C.A.  C.D. Workers I.A.R C.A.R T.A.R
1   2009   68919  99790 18099 127687  7967  227477  84.6  94.1  89.7
2   2010   55429  84038  7352 108935  5170  192973  92.0  95.5  93.9
3   2011   62874 114863  8583 155186  4548  270049  93.0  97.2  95.4
4   2012   56222 140809  7401 129023  4028  269832  95.0  97.0  95.9
5   2013   56079 130736  9596 164538  4552  295274  93.2  97.3  95.4
6   2014   56595 130616 10645 202190  6120  332806  92.5  97.1  95.2
7   2015   48544 111846  7644 176656  5429  288502  93.6  97.0  95.7
8   2016   53129 105092 11295 252120 11737  357212  90.3  95.6  93.9
9   2017   49786  96166 14518 277229 15338  373395  86.9  94.8  92.6
10  2018   55666  87889 28181 247072 33165  334961  75.7  88.2  84.5
11  2019   59441 132967 35633 256356 33880  389323  78.9  88.3  84.9
12  2020   55239 122894 18276 303830 21639  426724  87.1  93.4  91.4
Ensure that "Plot type" is set to "Workers by Status" and press the Plot tab. The following graph will be output:
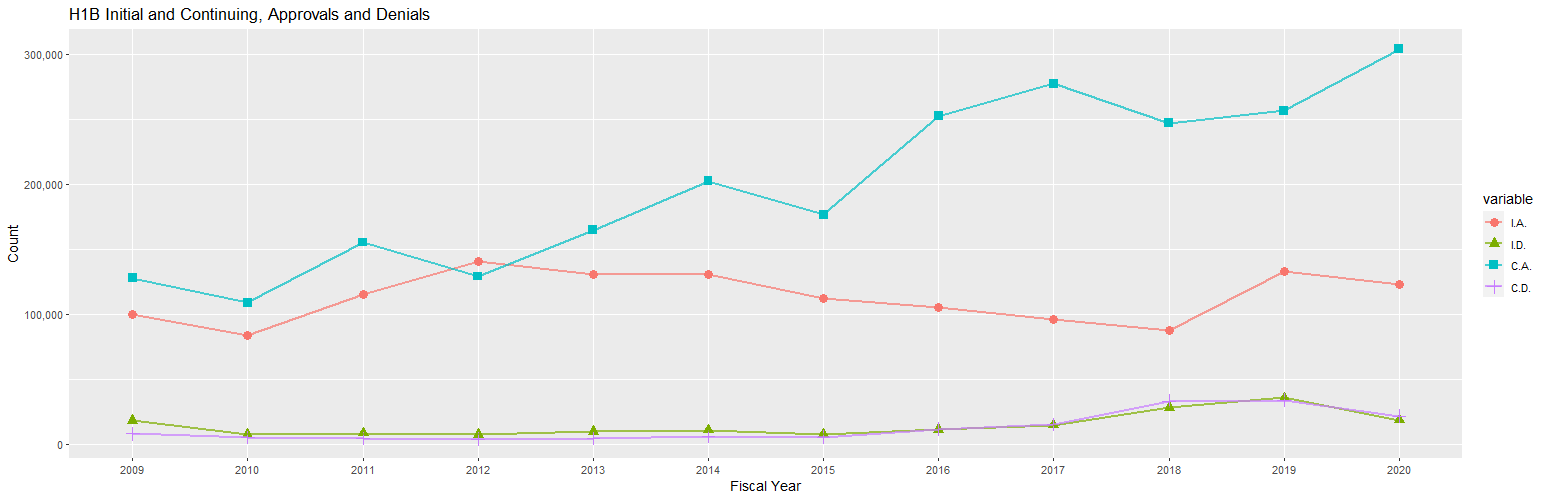
The sharp decline in 2019 is chiefly due to the fact that this includes just one quarter's worth of data. Other than that, the graph shows that initial approvals have been declining slightly since 2012 and continuing approvals have been generally increasing since then and increased sharply in 2016. One seemingly strange thing is that the graph shows that the number of continuing approvals have increased to be much greater than the initial approvals, especially from 2016 on. It would seem that the main source of applications for a continuing approval would be H-1B workers who received an initial approval 3 years prior (since the initial and continuing H-1B approval is good for 3 years). However, the 252,120 continuing approvals in 2016 is nearly twice as much as the 130,736 initial approvals 3 years earlier. In their article titled "Understanding Our H-1B Employer Data Hub", the USCIS describes Continuing Approval as follows:
H-1B petitions with anything other than "New employment" or "New concurrent employment" selected on Part 2, Question 2 of the Form I-129, whose first decision is an approval. This includes, for example, continuing employment, change of employer, and amended petitions.
Hence, many of the additional H-1B approvals may be for existing H-1B workers who changed their employer or amended their petition.
Changing "Plot type" to "Approval Rates" will output the following graph:
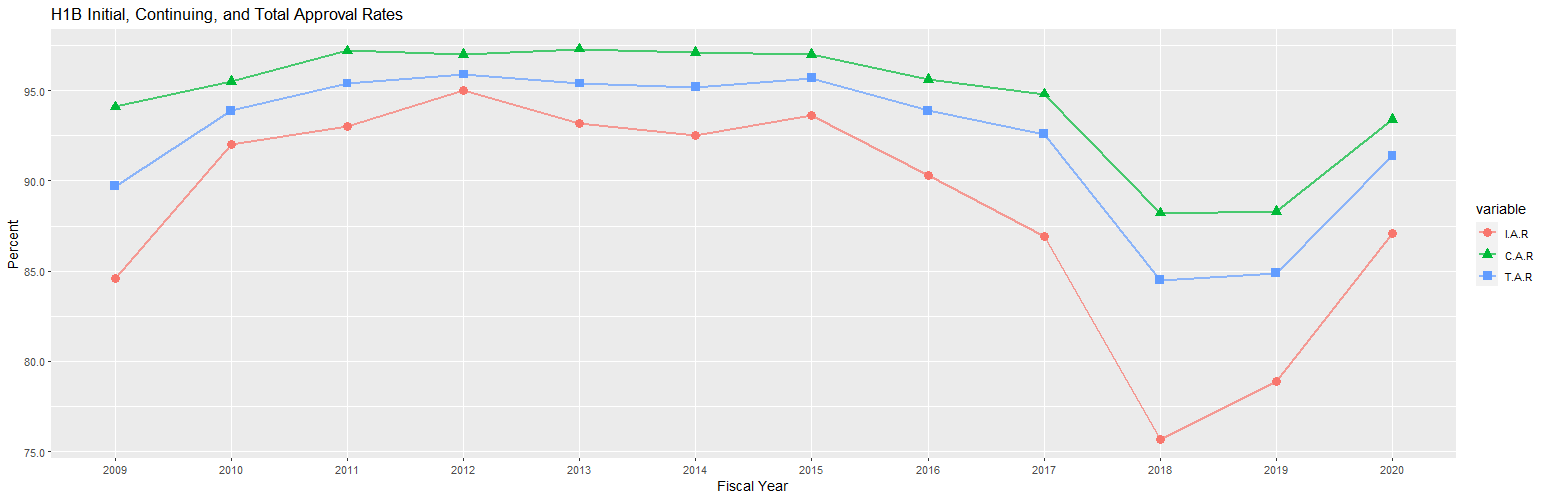
Once again, 2019 includes just one quarter's worth of data so it's value may not be totally indicative of what the final rates for 2019 turn out to be. Still, approval rates have been generally dropping since 2015.
Finally, changing "Plot type" to "Records and Workers" will output the following graph:
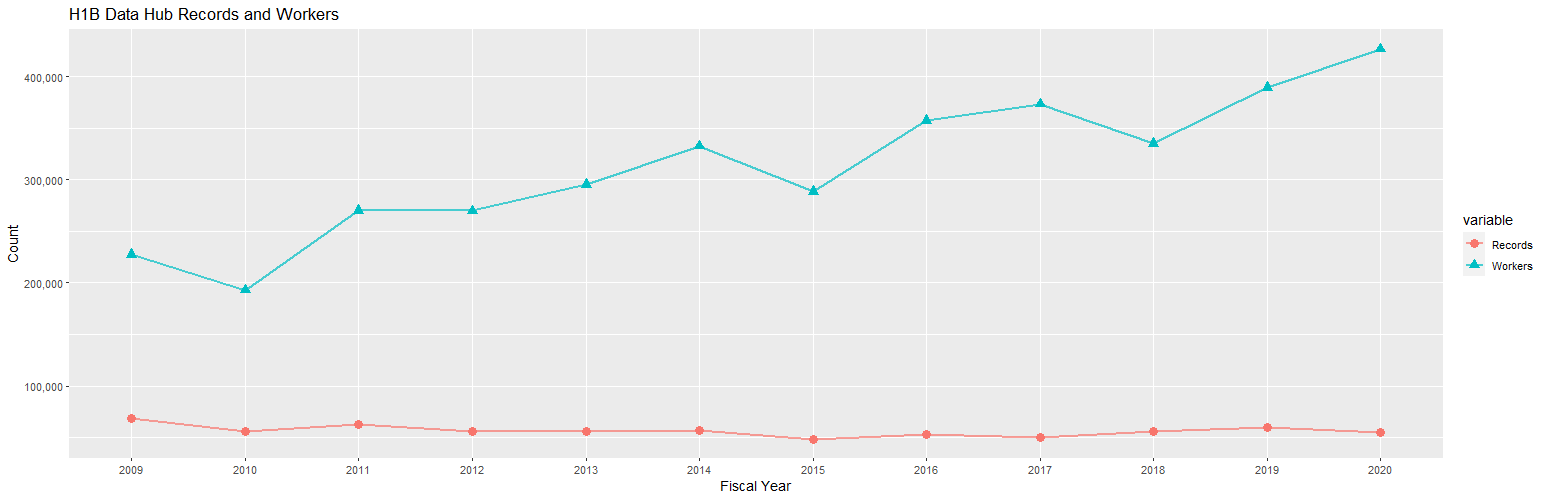
Note that the values for Workers is affected by which of the IA, ID, CA, and CD checkboxes are checked under "Include in Workers".
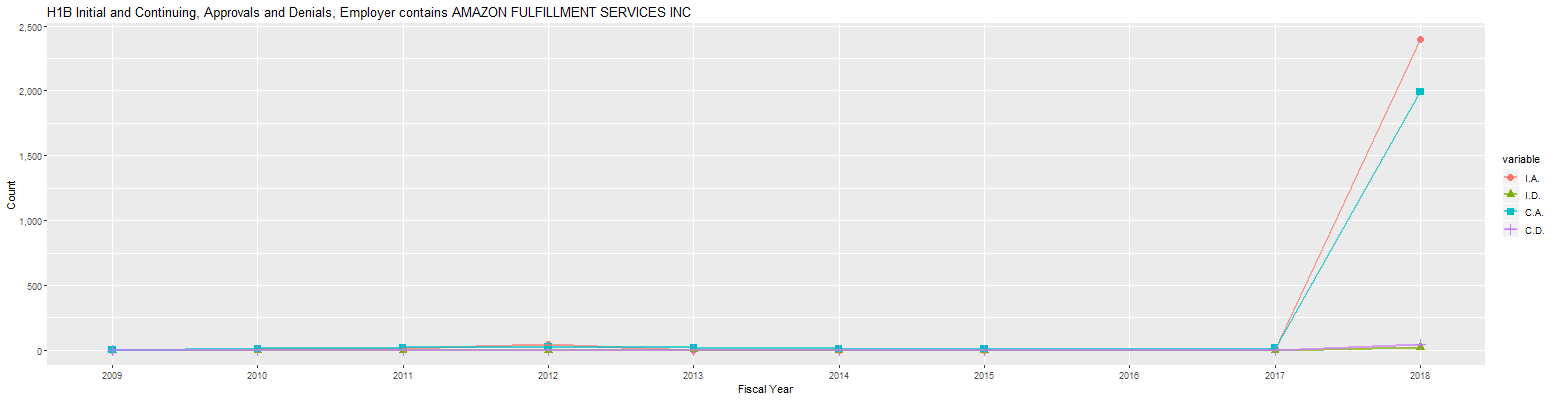
The above graphs can be created for a single employer. For example, set "Search Employer" to "AMAZON FULFILLMENT SERVICES INC" (without the quotes), select "Workers by Status" for "Plot type", and press the Submit button. The following graph will be output:
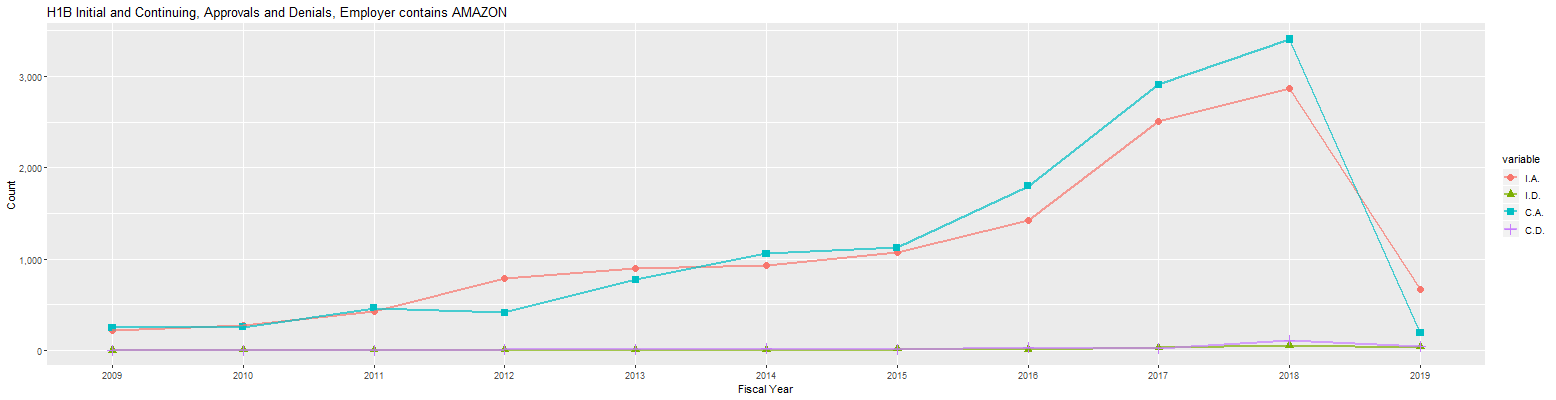
It would seem that Amazon has been using other names for their company. Change "Search Employer" to AMAZON and press the Submit button. The following graph will be output:
Pressing the Output tab shows that AMAZON matched 61 unique Employer names, some of which are obviously not a part of the company run by Jeff Bezos. Setting the "Minimum Number of Workers" numeric input to 10 causes this list to be cut down to the following list of 25:
                           Employer Records I.A. I.D. C.A. C.D. Workers I.A.R C.A.R T.A.R
1             AMAZON CORPORATE LLC     113 7577   67 8447  106   16024  99.1  98.8  98.9
2  AMAZON FULFILLMENT SERVICES INC      17 2462   24 2112   46    4574  99.0  97.9  98.5
3          AMAZON WEB SERVICES INC      33  701   21 1080   48    1781  97.1  95.7  96.3
4          AMAZON.COM SERVICES INC       2  607   27  124   27     731  95.7  82.1  93.1
5      AMAZON GLOBAL RESOURCES INC       5  256    0  301    4     557 100.0  98.7  99.3
6              AMAZON.COM.KYDC INC       3  107    0   84    0     191 100.0 100.0 100.0
7              AMAZON.COM.DEDC LLC      12   99    4  113    3     212  96.1  97.4  96.8
8              AMAZON ROBOTICS LLC       5   27    2   68    2      95  93.1  97.1  96.0
9              AMAZON.COM.KYDC LLC       6   26    0   25    1      51 100.0  96.2  98.1
10         AMAZON COM SERVICES INC      20   21    0    9    1      30 100.0  90.0  96.8
11         AMAZON WEB SERVICES LLC       6   21    0   26    0      47 100.0 100.0 100.0
12             AMAZON COM AZDC LLC       6   16    0   11    0      27 100.0 100.0 100.0
13             AMAZON SERVICES LLC       9   13    1   30    2      43  92.9  93.8  93.5
14             AMAZON COM INDC LLC      10   11    1   13    0      24  91.7 100.0  96.0
15             AMAZON.COM KYDC LLC       2   10    0   13    1      23 100.0  92.9  95.8
16      AMAZON MECHANICAL TURK INC       7    8    0    8    0      16 100.0 100.0 100.0
17     AMAZON CAPITAL SERVICES INC       6    4    0   10    1      14 100.0  90.9  93.3
18     AMAZON DIGITAL SERVICES INC       5    4    0    9    2      13 100.0  81.8  86.7
19          AMAZON MEDIA GROUP LLC       6    4    1   13    1      17  80.0  92.9  89.5
20                 AMAZON SVCS LLC       3    4    0   14    0      18 100.0 100.0 100.0
21             AMAZON.COM DEDC LLC       2    4    0   20    0      24 100.0 100.0 100.0
22     AMAZON FULFILLMENT SVCS INC       4    2    0    8    0      10 100.0 100.0 100.0
23         AMAZON TECHNOLOGIES INC       3    2    0   10    0      12 100.0 100.0 100.0
24             AMAZON PAYMENTS INC       7    1    0   14    0      15 100.0 100.0 100.0
25              AMAZON MEDIA GROUP       1    0    0   10    0      10   NaN 100.0 100.0
Most, if not all, of these appear to be under the known Amazon. In any event, it appears that the great majority of the data caught by the AMAZON filter are a part of the known Amazon. It is possible to get a graph showing the Workers for each of these different Employer names by selecting "Workers by Employer Name" as the "Plot type" and pressing on the Plot tab. The following graph is output:
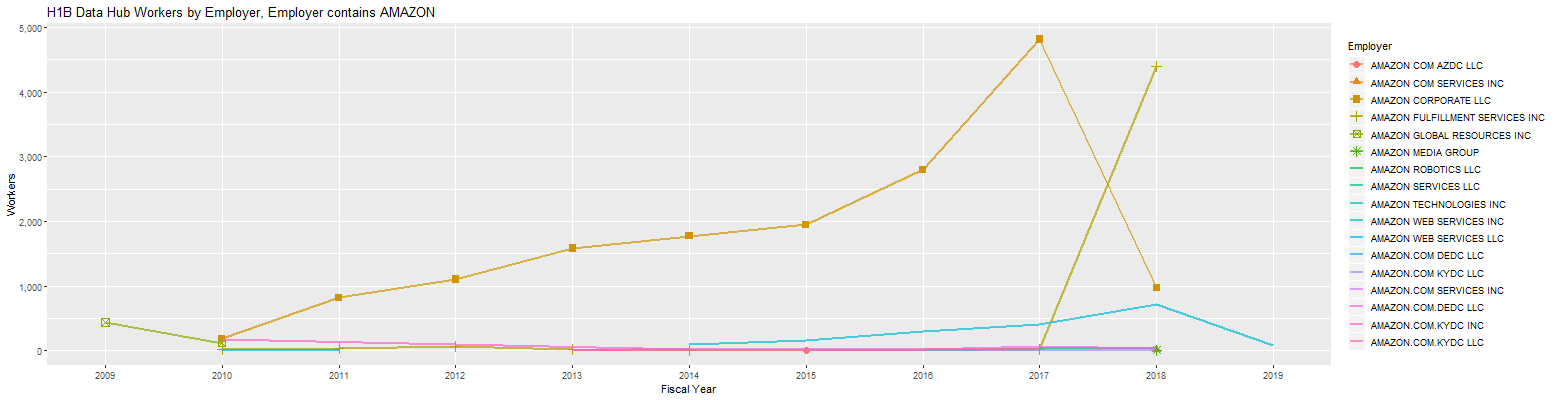
As can be seen, the main name that Amazon used in its Form I-129 through 2017 was AMAZON CORPORATE LLC but, in 2018, this name was used far less and AMAZON FULFILLMENT SERVICES INC became the most used name. The third most used name in 2018 was AMAZON WEB SERVICES INC.
Following is a prior list of the employers sorted by I.A. (Initial Approvals):
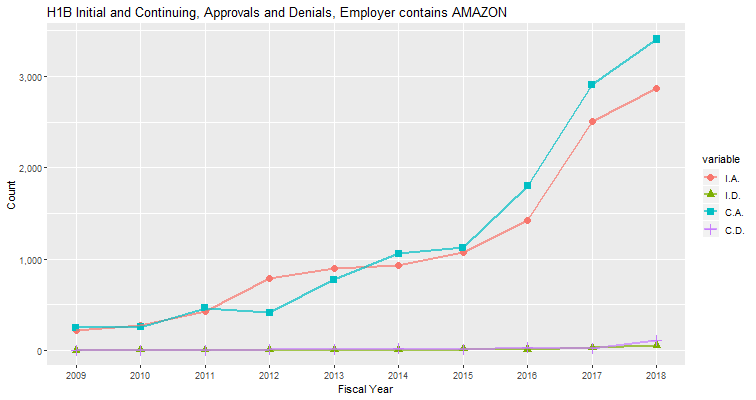
   FYear                           Employer I.A. I.D. C.A. C.D. NAICS Tax.ID State              City   ZIP Workers
1   2018    AMAZON FULFILLMENT SERVICES INC 2392   22 1980   45    45   4687    WA           SEATTLE 98121    4372
2   2018              MICROSOFT CORPORATION 1251   13 3199   54    51   4442    WA           REDMOND 98052    4450
3   2018                  INTEL CORPORATION  873    9 1260   19    33   2743    AZ          CHANDLER 85248    2133
4   2018                         GOOGLE LLC  724    6 1931   17    54   3581    CA     MOUNTAIN VIEW 94043    2655
5   2018               ERNST & YOUNG US LLP  716   93 1760  150    54   5596    NJ          SECAUCUS  7094    2476
6   2018                          APPLE INC  697   13 2386   25    33   4110    CA         CUPERTINO 95014    3083
7   2018                       FACEBOOK INC  650    5 1406   12    51   5019    CA        MENLO PARK 94025    2056
8   2018            DELOITTE CONSULTING LLP  592  295 4193 1281    54   4513    PA      PHILADELPHIA 19103    4785
9   2018         TECH MAHINDRA AMERICAS INC  579  201 1781  300    54   2696    NJ  SOUTH PLAINFIELD  7080    2360
10  2018          TATA CONSULTANCY SVCS LTD  528  152 8227 1744    54   9806    MD         ROCKVILLE 20850    8755
In the prior graph titled "H1B Initial and Continuing, Approvals and Denials, Employer contains AMAZON", the initial and continuing approvals seem to be increasing together. However, this was observed to not be the case for many employers. For this reason, it's useful to ensure that only the I.A. and I.C. checkboxes are set in the "Include in Workers" checkboxes and then to set "Sort by" to Workers. Following are the first 20 totals by Employer in 2018:
                              Employer Records I.A. I.D. C.A. C.D. Workers I.A.R C.A.R T.A.R
1         COGNIZANT TECH SOLNS US CORP      12  501  791 8762 3553    9263  38.8  71.1  68.1
2            TATA CONSULTANCY SVCS LTD      21  533  156 8257 1746    8790  77.4  82.5  82.2
3                          INFOSYS LTD       5   69   80 5902 2045    5971  46.3  74.3  73.8
4              DELOITTE CONSULTING LLP      28  697  323 4735 1461    5432  68.3  76.4  75.3
5                MICROSOFT CORPORATION      12 1256   13 3212   54    4468  99.0  98.3  98.5
6      AMAZON FULFILLMENT SERVICES INC       8 2397   23 1995   45    4392  99.0  97.8  98.5
7                        WIPRO LIMITED      12  276   83 2885  601    3161  76.9  82.8  82.2
8                            APPLE INC      11  701   13 2402   26    3103  98.2  98.9  98.8
9                        ACCENTURE LLP      17  366  162 2694  452    3060  69.3  85.6  83.3
10               CAPGEMINI AMERICA INC      25  273 1068 2681  924    2954  20.4  74.4  59.7
11                          GOOGLE LLC      14  734    6 1954   17    2688  99.2  99.1  99.2
12                        FACEBOOK INC      29  669    7 1821   14    2490  99.0  99.2  99.2
13                ERNST & YOUNG US LLP       9  717   94 1766  150    2483  88.4  92.2  91.1
14          TECH MAHINDRA AMERICAS INC      16  587  202 1843  311    2430  74.4  85.6  82.6
15                     HCL AMERICA INC      11  196  103 2111  510    2307  65.6  80.5  79.0
16                 JPMORGAN CHASE & CO       9  325    8 1881   55    2206  97.6  97.2  97.2
17                   INTEL CORPORATION       8  875    9 1273   19    2148  99.0  98.5  98.7
18                  ORACLE AMERICA INC      20  173   26 1489   28    1662  86.9  98.2  96.9
19                   CISCO SYSTEMS INC       9  331   13 1328   28    1659  96.2  97.9  97.6
20           IBM INDIA PRIVATE LIMITED      11   62   60 1562  289    1624  50.8  84.4  82.3
As can be seen, this is a very different list than the list sorted by I.A. (Initial Approvals). In the prior list, only 4 of the top 10 employers were consulting firms and those were in positions 5 and 8 through 10. In this list, 7 of the top 10 employers are consulting firms and those are in positions 1 through 4, 7, 9, and 10. Looking at the approvals in the list, it appears that the consulting firms tend to have many more continuing approvals than initial approvals in 2018, sometimes as much as 10 times as many. Following are graphs of the approvals over time of the first 12 employers in the list above. The graphs just include the complete fiscal years (through 2018) and the graphs were made less wide by simply making the browser window that holds them less wide.
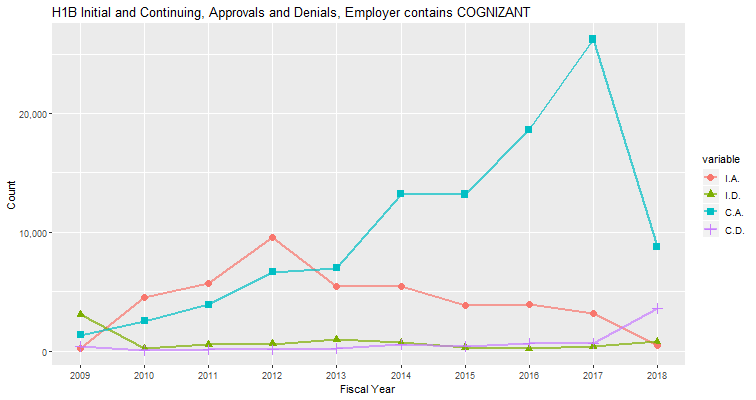
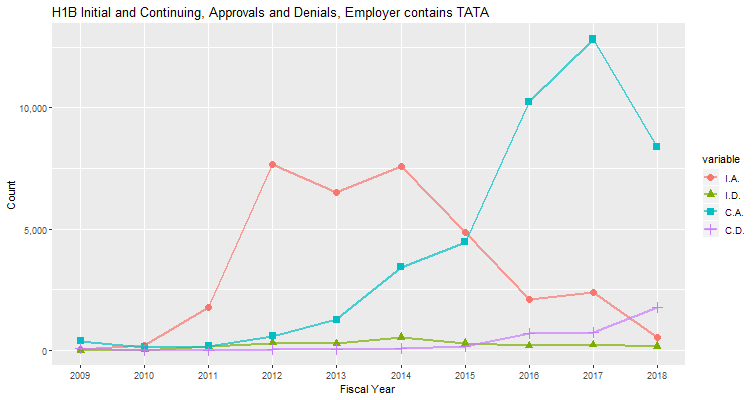
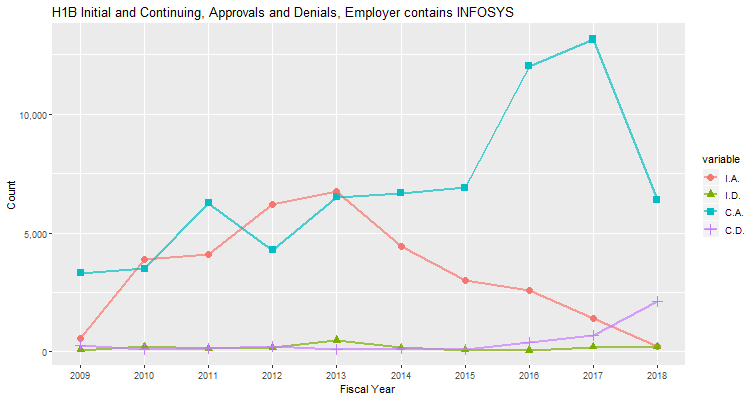
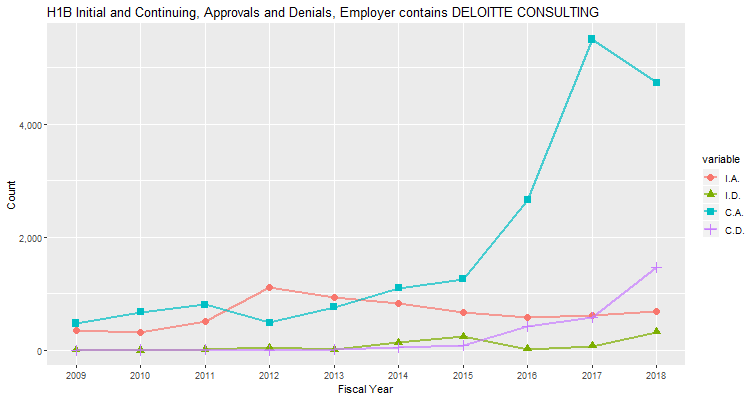
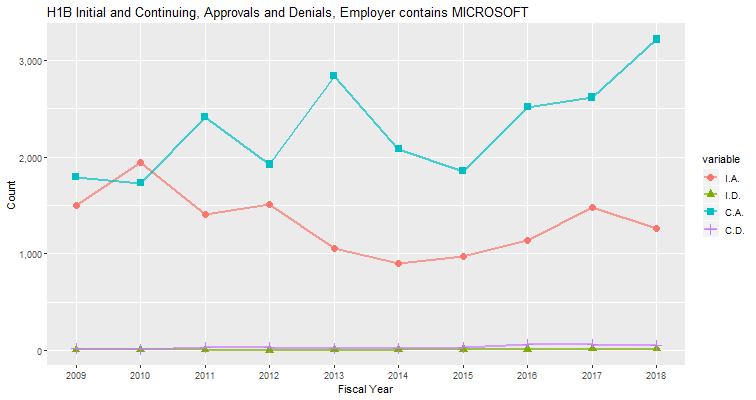
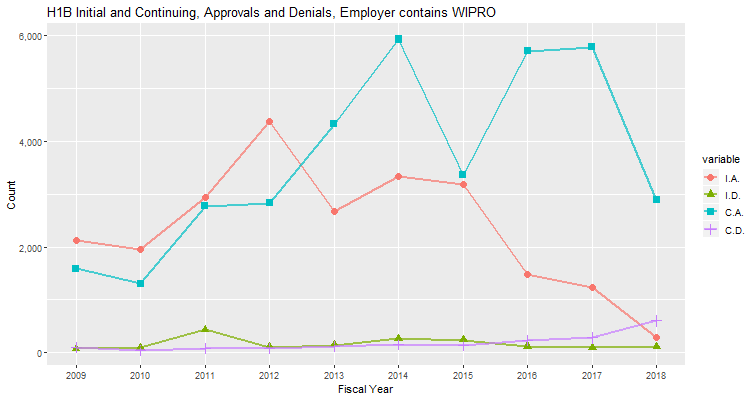
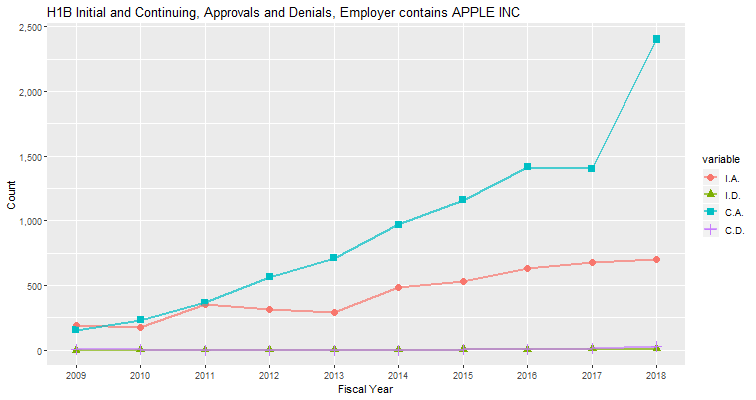
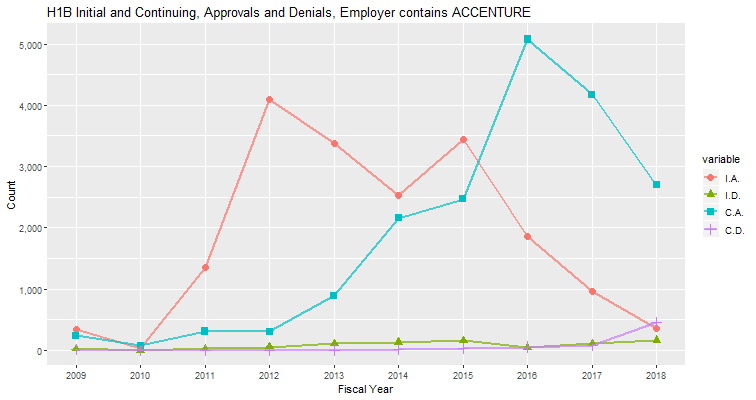
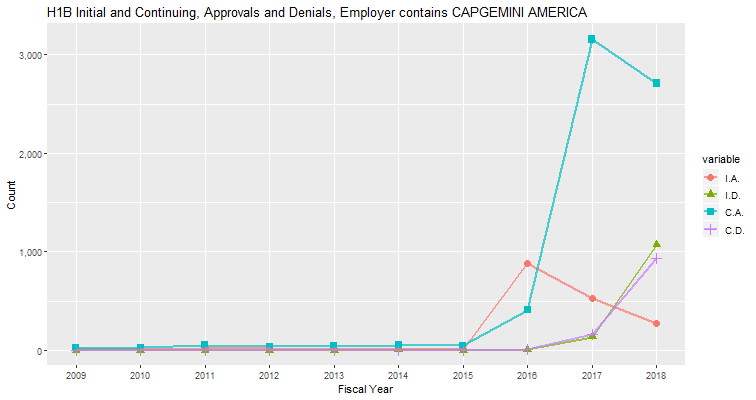
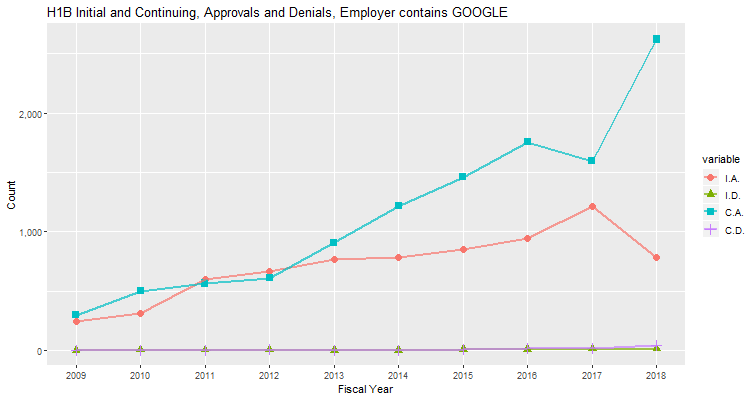
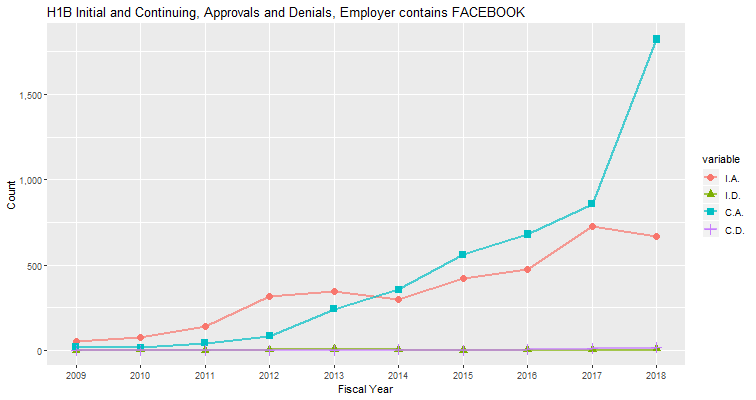
As can be seen, the initial approvals of all of the consulting firms are decreasing toward zero and the continuing approvals were going up through 2017 but decreased in 2018 (except ACCENTURE which started decreasing in 2017). The initial approvals of the non-consulting firms are generally moving up though 3 in 5 went down in 2018. Their continuing approvals are also generally moving up and 3 out of 5 (APPLE, GOOGLE, and FACEBOOK) increased sharply in 2018. It's not clear what is going on here but it is possible that the non-consulting firms are hiring away many of the H-1B workers from the consulting firms.
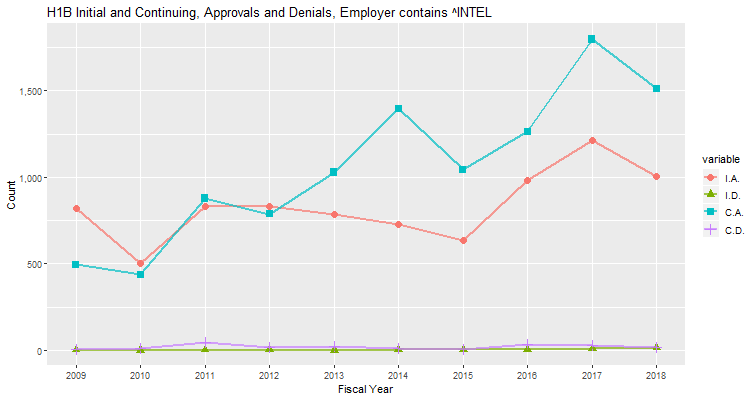
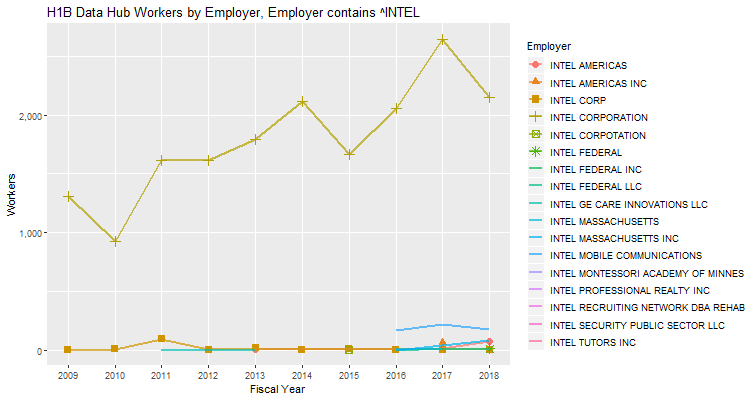
The third and fourth tables in this document show that INTEL CORPORATION had the third most Initial Approvals in 2018. In trying to find all of the records associated with that company, simply searching for INTEL matches numerous unassociated records. Some experimentation showed that searching for "^INTEL " (with the trailing blank but without the quotes) matched the following employer names:
                             Employer Records I.A. I.D. C.A. C.D. Workers I.A.R C.A.R T.A.R
1                   INTEL CORPORATION      99 7920   38 9963  189   17883  99.5  98.1  98.7
2         INTEL MOBILE COMMUNICATIONS      13  154    3  412    4     566  98.1  99.0  98.8
3                          INTEL CORP      39   89    0   65    2     154 100.0  97.0  98.7
4             INTEL MASSACHUSETTS INC       3   85    2   42    0     127  97.7 100.0  98.4
5                      INTEL AMERICAS       8   32    1   67    2      99  97.0  97.1  97.1
6                  INTEL AMERICAS INC       1   26    2   40    1      66  92.9  97.6  95.7
7                   INTEL FEDERAL LLC       6   13    0   13    1      26 100.0  92.9  96.3
8                       INTEL FEDERAL       1    3    0   12    0      15 100.0 100.0 100.0
9                   INTEL FEDERAL INC       1    3    0    7    1      10 100.0  87.5  90.9
10      INTEL GE CARE INNOVATIONS LLC       3    3    1    2    0       5  75.0 100.0  83.3
11                INTEL MASSACHUSETTS       5    2    0    7    0       9 100.0 100.0 100.0
12                   INTEL TUTORS INC       1    1    0    0    0       1 100.0   NaN 100.0
13                  INTEL CORPOTATION       1    0    0    1    0       1   NaN 100.0 100.0
14 INTEL MONTESSORI ACADEMY OF MINNES       1    0    0    1    0       1   NaN 100.0 100.0
15      INTEL PROFESSIONAL REALTY INC       1    0    0    1    0       1   NaN 100.0 100.0
16 INTEL RECRUITING NETWORK DBA REHAB       1    0    0    3    0       3   NaN 100.0 100.0
17   INTEL SECURITY PUBLIC SECTOR LLC       1    0    0    1    0       1   NaN 100.0 100.0
It appears that the employer names through INTEL MASSACHUSETTS are associated with the company so this search seems to be a good estimate of total H-1B approved for Intel Corporation. As can be seen in the (Wikipedia page for Regular expression, the leading carat (^) is a metacharacter that matches the starting position within the string. In fact, the searches in this application use regex (regular expressions). Following are the graphs output for this search and Plot types of "Worker by Status" and "Workers by Employer Name":
Another employer that required regex metacharacters was Wal-Mart. It appears that both WALMART and WAL-MART have been used in the applications. In addition, it appears that WAL-MART was misspelled as WALT-MART in 2017. All of these spellings can be caught by the regex string WAL[A-Z]?[-]?MART or by the slightly simpler WAL[A-Z-]*MART. Following are the graphs output for this search and Plot types of "Worker by Status" and "Workers by Employer Name":
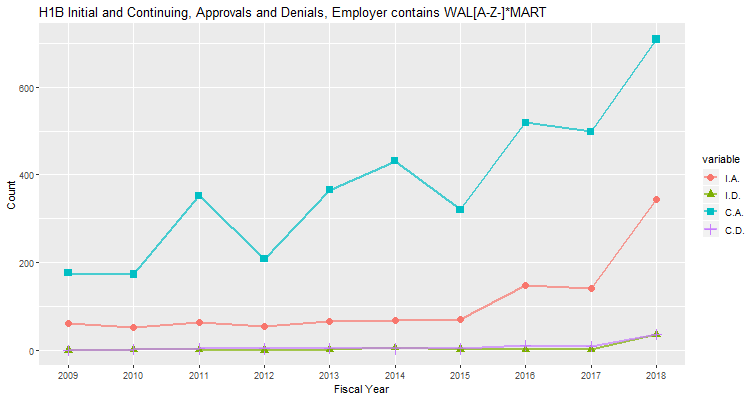
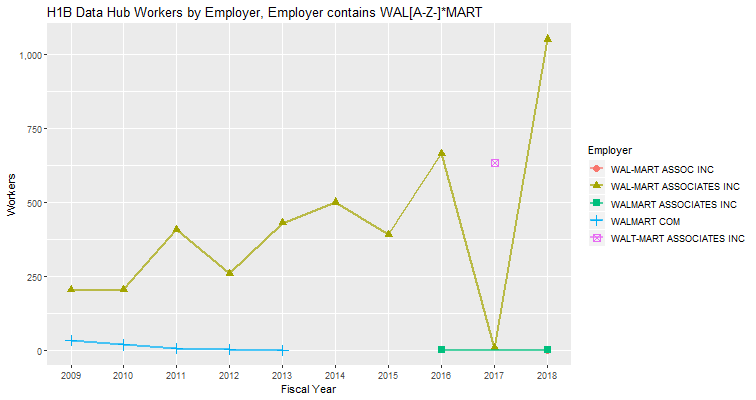
As can be seen in the second graph, WAL-MART ASSOCIATES INC seems to have simply been mistyped with an extra T in 2017.
This application is under continuing development. If anyone should run into any issues or have any suggestions for additional features, feel free to let me know via the Contact box at the bottom of this page.