Employed Population by Citizenship Status, 2012
Silicon Valley Area San Francisco Area
---------------------------------- ----------------------------------
Santa Clara & San Mateo counties Alameda & San Francisco counties
---------------------------------- ----------------------------------
Citizen Naturalized Not a Citizen Naturalized Not a
by birth Citizen Citizen by birth Citizen Citizen Occupation
---------- ---------- ---------- ---------- ---------- ---------- ----------
3,994 4,606 2,285 5,997 1,730 1,328 Computer and Information Systems Managers (MGR)
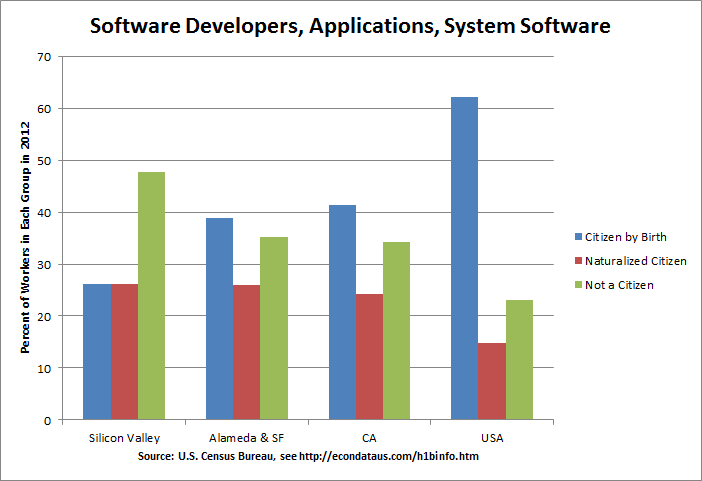
14,736 14,696 26,921 10,935 7,306 9,905 Software Developers, Applications and Systems Software (CMM)
4,296 2,252 3,349 5,443 2,492 1,867 Computer Programmers (CMM)
18,155 7,833 5,981 20,330 7,396 5,320 Other Computer and Mathematical (CMM)
---------- ---------- ---------- ---------- ---------- ---------- ----------
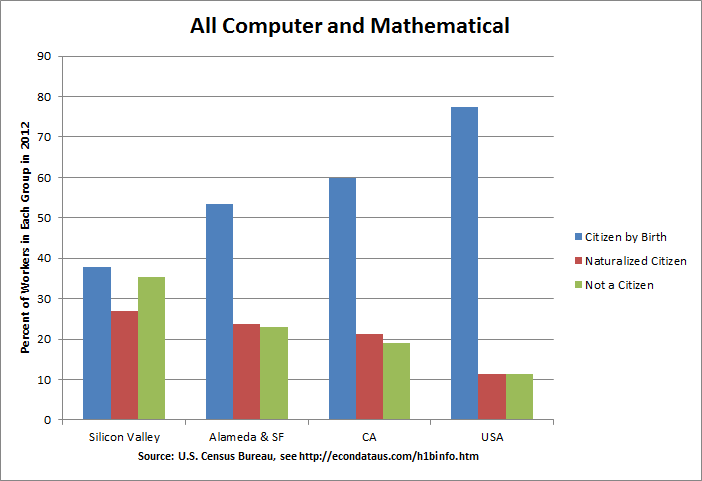
41,181 29,387 38,536 42,705 18,924 18,420 Total Computer and Mathematical (CMM & MGR)
2,808 1,734 1,010 1,605 1,626 79 Architectural and Engineering Managers (MGR)
25,600 23,774 14,350 18,179 11,653 6,528 Architectural and Engineering (ENG)
134 0 0 890 167 0 Natural Sciences Managers (MGR)
10,756 4,841 3,700 14,934 3,116 3,710 Life, physical, and social science (SCI)
3,054 1,451 418 4,108 605 130 Medical and Health Services Managers (MGR)
40,045 29,482 10,884 45,531 18,249 9,504 Medical and Health Services (MED & HLS)
7,138 3,554 1,316 6,448 2,332 591 Financial Managers (MGR)
10,861 8,573 5,148 14,210 7,579 2,848 Accountants and Auditors (FIN)
5,971 2,922 1,147 12,212 2,544 376 Other Financial (FIN)
79,067 24,480 17,292 87,143 19,396 10,602 Other Managers (MGR)
449,141 167,305 167,212 476,861 154,691 130,444 Other Workers
---------- ---------- ---------- ---------- ---------- ---------- ----------
675,756 297,503 261,013 724,826 240,882 183,232 TOTAL (all occupations)
==================================================================================
Percent of Employed Population by Citizenship Status, 2012
---------------------------------- ----------------------------------
Santa Clara & San Mateo counties Alameda & San Francisco counties
---------------------------------- ----------------------------------
Citizen Naturalized Not a Citizen Naturalized Not a
by birth Citizen Citizen by birth Citizen Citizen Occupation
---------- ---------- ---------- ---------- ---------- ---------- ----------
54.7 24.1 21.1 63.1 21.0 15.9 All Industries
36.7 42.3 21.0 66.2 19.1 14.7 Computer and Information Systems Managers (MGR)
26.1 26.1 47.8 38.9 26.0 35.2 Software Developers, Applications and Systems Software (CMM)
43.4 22.8 33.8 55.5 25.4 19.0 Computer Programmers (CMM)
56.8 24.5 18.7 61.5 22.4 16.1 Other Computer and Mathematical (CMM)
---------- ---------- ---------- ---------- ---------- ---------- ----------
37.7 26.9 35.3 53.3 23.6 23.0 Total Computer and Mathematical (CMM & MGR)
50.6 31.2 18.2 48.5 49.1 2.4 Architectural and Engineering Managers (MGR)
40.2 37.3 22.5 50.0 32.0 18.0 Architectural and Engineering (ENG)
100.0 0.0 0.0 84.2 15.8 0.0 Natural Sciences Managers (MGR)
55.7 25.1 19.2 68.6 14.3 17.0 Life, physical, and social science (SCI)
62.0 29.5 8.5 84.8 12.5 2.7 Medical and Health Services Managers (MGR)
49.8 36.7 13.5 62.1 24.9 13.0 Medical and Health Services (MED & HLS)
59.4 29.6 11.0 68.8 24.9 6.3 Financial Managers (MGR)
44.2 34.9 20.9 57.7 30.8 11.6 Accountants and Auditors (FIN)
59.5 29.1 11.4 80.7 16.8 2.5 Other Financial (FIN)
65.4 20.3 14.3 74.4 16.6 9.1 Other Managers (MGR)
57.3 21.3 21.3 62.6 20.3 17.1 Other Workers
---------- ---------- ---------- ---------- ---------- ---------- ----------
54.7 24.1 21.1 63.1 21.0 15.9 TOTAL (all occupations)
Source: American Community Survey, Public Use Microdata Sample (PUMS) on DataFerrett,
United States Census Bureau (Instructions for Generating Data)
Note: Employed = Civilian employed, at work (series ESR);
Citizen by birth = born in U.S., Guam, Puerto Rico, U.S. Virgin Islands or
Northern Marianas, or born abroad of American parent(s) (series CIT);
United States and California Workforce: 2012
            Employed Population by Citizenship Status, 2012

United States                        California
-----------------------------------  ----------------------------------
    Citizen  Naturalized      Not a     Citizen  Naturalized      Not a
   by birth     Citizen     Citizen    by birth     Citizen     Citizen  Occupation
 ----------  ----------  ----------  ----------  ----------  ----------  ----------
    421,786      55,635      39,878      37,992      13,384       7,786  Computer and Information Systems Managers (MGR)
    609,659     145,262     225,273      71,309      41,879      59,015  Software Developers, Applications and Systems Software (CMM)
    351,428      57,454      44,869      35,520      13,463       8,758  Computer Programmers (CMM)
  1,846,727     218,466     161,809     181,571      47,873      27,928  Other Computer and Mathematical (CMM)
 ----------  ----------  ----------  ----------  ----------  ----------  ----------
  3,229,600     476,817     471,829     326,392     116,599     103,487  Total Computer and Mathematical (CMM & MGR)
    117,245      18,768       8,645      14,060       6,403       2,114  Architectural and Engineering Managers (MGR)
  2,064,432     292,935     178,389     218,493      99,504      46,371  Architectural and Engineering (ENG)
     13,818       2,148       1,367       1,523         701          74  Natural Sciences Managers (MGR)
    971,258     112,388     137,213     114,468      27,986      23,435  Life, physical, and social science (SCI)
    509,848      46,970      15,867      41,968      13,638       2,890  Medical and Health Services Managers (MGR)
  9,608,823   1,248,014     599,072     723,303     280,221     120,517  Medical and Health Services (MED & HLS)
    922,310      93,916      45,630      90,760      25,160       6,902  Financial Managers (MGR)
  1,711,366     225,826      98,530     157,325      67,903      24,331  Accountants and Auditors (FIN)
  1,099,678      89,168      38,916     115,476      23,754       8,132  Other Financial (FIN)
  9,912,904     812,459     564,175   1,014,721     213,863     125,148  Other Managers (MGR)
 86,667,310   7,424,897  10,135,136   7,794,842   1,918,282   2,453,045  Other Workers
-----------  ----------  ----------  ----------  ----------  ----------  ----------
116,828,592  10,844,306  12,294,769  10,613,331   2,794,014   2,916,446  TOTAL (all occupations)
===================================================================================
      Percent of Employed Population by Citizenship Status, 2012

United States                        California
-----------------------------------  ----------------------------------
    Citizen Naturalized       Not a     Citizen Naturalized       Not a
   by birth     Citizen     Citizen    by birth     Citizen     Citizen  Occupation
 ----------  ----------  ----------  ----------  ----------  ----------  ----------
       81.5        10.8         7.7        64.2        22.6        13.2  Computer and Information Systems Managers (MGR)
       62.2        14.8        23.0        41.4        24.3        34.3  Software Developers, Applications and Systems Software (CMM)
       77.4        12.7         9.9        61.5        23.3        15.2  Computer Programmers (CMM)
       82.9         9.8         7.3        70.5        18.6        10.9  Other Computer and Mathematical (CMM)
 ----------  ----------  ----------  ----------  ----------  ----------  ----------
       77.3        11.4        11.3        59.7        21.3        18.9  Total Computer and Mathematical (CMM & MGR)
       81.0        13.0         6.0        62.3        28.4         9.4  Architectural and Engineering Managers (MGR)
       81.4        11.6         7.0        60.0        27.3        12.7  Architectural and Engineering (ENG)
       79.7        12.4         7.9        66.3        30.5         3.2  Natural Sciences Managers (MGR)
       79.6         9.2        11.2        69.0        16.9        14.1  Life, physical, and social science (SCI)
       89.0         8.2         2.8        71.7        23.3         4.9  Medical and Health Services Managers (MGR)
       83.9        10.9         5.2        64.3        24.9        10.7  Medical and Health Services (MED & HLS)
       86.9         8.8         4.3        73.9        20.5         5.6  Financial Managers (MGR)
       84.1        11.1         4.8        63.0        27.2         9.7  Accountants and Auditors (FIN)
       89.6         7.3         3.2        78.4        16.1         5.5  Other Financial (FIN)
       87.8         7.2         5.0        75.0        15.8         9.2  Other Managers (MGR)
       83.2         7.1         9.7        64.1        15.8        20.2  Other Workers
 ----------  ----------  ----------  ----------  ----------  ----------  ----------
       83.5         7.7         8.8        65.0        17.1        17.9  TOTAL (all occupations)
Source: American Community Survey, Public Use Microdata Sample (PUMS) on DataFerrett,
        United States Census Bureau (Instructions for Generating Data)
Note: Employed = Civilian employed, at work (series ESR);
      Citizen by birth = born in U.S., Guam, Puerto Rico, U.S. Virgin Islands or
      Northern Marianas, or born abroad of American parent(s) (series CIT);
Silicon Valley Workforce, BA or Higher: 2012
  Employed Population with a BA or Higher by Citizenship Status, 2012

            California              Silicon Valley (Santa Clara and San Mateo counties)
----------------------------------  ----------------------------------
   Citizen  Naturalized      Not a     Citizen  Naturalized      Not a
  by birth     Citizen     Citizen    by birth     Citizen     Citizen  Occupation
----------  ----------  ----------  ----------  ----------  ----------  ----------
    25,575      12,052       6,718       3,159       4,490       2,027  Computer and Information Systems Managers (MGR)
    56,502      39,972      58,097      13,433      13,919      26,601  Software Developers, Applications and Systems Software (CMM)
    25,389      10,835       7,623       3,746       2,143       3,067  Computer Programmers (CMM)
   100,761      33,618      22,831      11,779       5,757       5,435  Other Computer and Mathematical (CMM)
----------  ----------  ----------  ----------  ----------  ----------  ----------
   208,227      96,477      95,269      32,117      26,309      37,130  Total Computer and Mathematical (CMM & MGR)
    12,276       5,885       1,864       2,551       1,620       1,010  Architectural and Engineering Managers (MGR)
   147,635      79,257      39,921      21,185      18,976      13,865  Architectural and Engineering (ENG)
     1,523         701          74         134           0           0  Natural Sciences Managers (MGR)
    97,118      24,716      19,474       9,684       4,419       3,618  Life, physical, and social science (SCI)
    25,742      10,667       1,736       1,901       1,326         266  Medical and Health Services Managers (MGR)
   317,150     160,018      52,256      22,468      17,231       6,308  Medical and Health Services (MED & HLS)
    54,746      16,965       5,359       5,573       3,187       1,249  Financial Managers (MGR)
   118,200      54,964      20,743       8,712       7,323       4,302  Accountants and Auditors (FIN)
    72,130      15,988       5,810       4,319       2,192         776  Other Financial (FIN)
   555,446     118,214      54,971      52,457      17,696      12,309  Other Managers (MGR)
 2,260,571     493,427     277,153     168,113      59,437      32,517  Other Workers
----------  ----------  ----------  ----------  ----------  ----------  ----------
 3,870,764   1,077,279     574,630     329,214     159,716     113,350  TOTAL (all occupations)

==================================================================================
Percent of Employed Population with a BA or Higher by Citizenship Status, 2012

            California              Silicon Valley (Santa Clara and San Mateo counties)
----------------------------------  ----------------------------------
   Citizen  Naturalized      Not a     Citizen  Naturalized      Not a
  by birth     Citizen     Citizen    by birth     Citizen     Citizen  Occupation
----------  ----------  ----------  ----------  ----------  ----------  ----------
      57.7        27.2        15.1        32.6        46.4        20.9  Computer and Information Systems Managers (MGR)
      36.6        25.9        37.6        24.9        25.8        49.3  Software Developers, Applications and Systems Software (CMM)
      57.9        24.7        17.4        41.8        23.9        34.2  Computer Programmers (CMM)
      64.1        21.4        14.5        51.3        25.1        23.7  Other Computer and Mathematical (CMM)
----------  ----------  ----------  ----------  ----------  ----------  ----------
      52.1        24.1        23.8        33.6        27.5        38.9  Total Computer and Mathematical (CMM & MGR)
      61.3        29.4         9.3        49.2        31.3        19.5  Architectural and Engineering Managers (MGR)
      55.3        29.7        15.0        39.2        35.1        25.7  Architectural and Engineering (ENG)
      66.3        30.5         3.2       100.0         0.0         0.0  Natural Sciences Managers (MGR)
      68.7        17.5        13.8        54.6        24.9        20.4  Life, physical, and social science (SCI)
      67.5        28.0         4.6        54.4        38.0         7.6  Medical and Health Services Managers (MGR)
      59.9        30.2         9.9        48.8        37.5        13.7  Medical and Health Services (MED & HLS)
      71.0        22.0         7.0        55.7        31.8        12.5  Financial Managers (MGR)
      61.0        28.3        10.7        42.8        36.0        21.2  Accountants and Auditors (FIN)
      76.8        17.0         6.2        59.3        30.1        10.6  Other Financial (FIN)
      76.2        16.2         7.5        63.6        21.5        14.9  Other Managers (MGR)
      74.6        16.3         9.1        64.6        22.9        12.5  Other Workers
----------  ----------  ----------  ----------  ----------  ----------  ----------
      70.1        19.5        10.4        54.7        26.5        18.8  TOTAL (all occupations)

Source: American Community Survey, Public Use Microdata Sample (PUMS) on DataFerrett,
        United States Census Bureau
Note: Employed = Civilian employed, at work (series ESR);
      BA or Higher = Bachelor's degree, Master's degree, Professional degree beyond a
      bachelor's degree, or Doctorate degree (series SCHL);
      Citizen by birth = born in U.S., Guam, Puerto Rico, U.S. Virgin Islands or
      Northern Marianas, or born abroad of American parent(s) (series CIT);
Silicon Valley Workforce: 2011
  Employed Population with a BA or Higher that is Foreign-Born, 2011

    United States             California        Silicon Valley (Santa Clara and San Mateo counties)
----------------------  ----------------------  ----------------------
  Foreign-                Foreign-                Foreign-
      born     US-born        born     US-born        born     US-born  Occupation
----------  ----------  ----------  ----------  ----------  ----------  ----------
 7,310,929  36,672,822   1,656,163   3,637,564     270,314     299,282  All Industries (shown in Silicon Valley Index)
----------  ----------  ----------  ----------  ----------  ----------  ----------
    87,541     294,525      19,316      26,060       6,508       3,533  Computer and Information Systems Managers (MGR)
   320,516     420,837      87,999      54,735      37,077      14,240  Software Developers, Applications and Systems Software (CMM)
    99,001     213,967      18,569      19,644       4,060       2,718  Computer Programmers (CMM)
   315,770     964,032      66,928      89,098      14,575       8,400  Other Computer and Mathematical (CMM)
----------  ----------  ----------  ----------  ----------  ----------  ----------
   822,828   1,893,361     192,812     189,537      62,220      28,891  Total Computer and Mathematical (CMM & MGR)
    22,035      91,892       8,055      10,519       2,800       1,685  Architectural and Engineering Managers (MGR)
   372,506   1,249,645     110,422     133,407      31,451      17,543  Architectural and Engineering (ENG)
     4,608      15,368         716       1,210         137         192  Natural Sciences Managers (MGR)
   251,078     736,829      50,663      95,506       9,194       8,704  Life, physical, and social science (SCI)
    49,163     312,061      10,419      28,892         490       2,851  Medical and Health Services Managers (MGR)
   992,817   3,745,801     214,611     314,180      22,217      22,741  Medical and Health Services (MED & HLS)
   106,232     525,439      25,893      51,279       4,240       3,895  Financial Managers (MGR)
   283,818   1,272,085      74,943     109,575       9,932       8,940  Accountants and Auditors (FIN)
    95,363     668,849      21,994      66,920       3,393       4,471  Other Financial (FIN)
   762,563   4,865,543     185,173     525,962      34,178      49,906  Other Managers (MGR)
 3,547,918  21,295,949     760,462   2,110,577      90,062     149,463  All Others
----------  ----------  ----------  ----------  ----------  ----------  ----------
 7,310,929  36,672,822   1,656,163   3,637,564     270,314     299,282  TOTAL

==================================================================================
Percent of Employed Population with a BA or Higher that is Foreign-Born, 2011

    United States             California        Silicon Valley (Santa Clara and San Mateo counties)
----------------------  ----------------------  ----------------------
  Foreign-                Foreign-                Foreign-
      born     US-born        born     US-born        born     US-born  Occupation
----------  ----------  ----------  ----------  ----------  ----------  ----------
      16.6        83.4        31.3        68.7        47.5        52.5  All Industries (shown in Silicon Valley Index)
----------  ----------  ----------  ----------  ----------  ----------  ----------
      22.9        77.1        42.6        57.4        64.8        35.2  Computer and Information Systems Managers (MGR)
      43.2        56.8        61.7        38.3        72.3        27.7  Software Developers, Applications and Systems Software (CMM)
      31.6        68.4        48.6        51.4        59.9        40.1  Computer Programmers (CMM)
      24.7        75.3        42.9        57.1        63.4        36.6  Other Computer and Mathematical (CMM)
----------  ----------  ----------  ----------  ----------  ----------  ----------
      30.3        69.7        50.4        49.6        68.3        31.7  Total Computer and Mathematical (CMM & MGR)
      19.3        80.7        43.4        56.6        62.4        37.6  Architectural and Engineering Managers (MGR)
      23.0        77.0        45.3        54.7        64.2        35.8  Architectural and Engineering (ENG)
      23.1        76.9        37.2        62.8        41.6        58.4  Natural Sciences Managers (MGR)
      25.4        74.6        34.7        65.3        51.4        48.6  Life, physical, and social science (SCI)
      13.6        86.4        26.5        73.5        14.7        85.3  Medical and Health Services Managers (MGR)
      21.0        79.0        40.6        59.4        49.4        50.6  Medical and Health Services (MED & HLS)
      16.8        83.2        33.6        66.4        52.1        47.9  Financial Managers (MGR)
      18.2        81.8        40.6        59.4        52.6        47.4  Accountants and Auditors (FIN)
      12.5        87.5        24.7        75.3        43.1        56.9  Other Financial (FIN)
      13.5        86.5        26.0        74.0        40.6        59.4  Other Managers (MGR)
      14.3        85.7        26.5        73.5        37.6        62.4  All Others
----------  ----------  ----------  ----------  ----------  ----------  ----------
      16.6        83.4        31.3        68.7        47.5        52.5  TOTAL

Source: American Community Survey, Public Use Microdata Sample (PUMS) on DataFerrett,
        United States Census Bureau; totals match those given at Silicon Valley Index
Note: Employed = Civilian employed, at work (series ESR);
      BA or Higher = Bachelor's degree, Master's degree, Professional degree beyond a
      bachelor's degree, or Doctorate degree (series SCHL); US-born = born in U.S.,
      American Samoa, Guam, Puerto Rico, or US Virgin Islands (series POBP);
      San Mateo County = PUMA# 2301-2306; Santa Clara county = PUMA# 2701-2714;