Change in Silicon Valley Workforce from 2015 to 2016
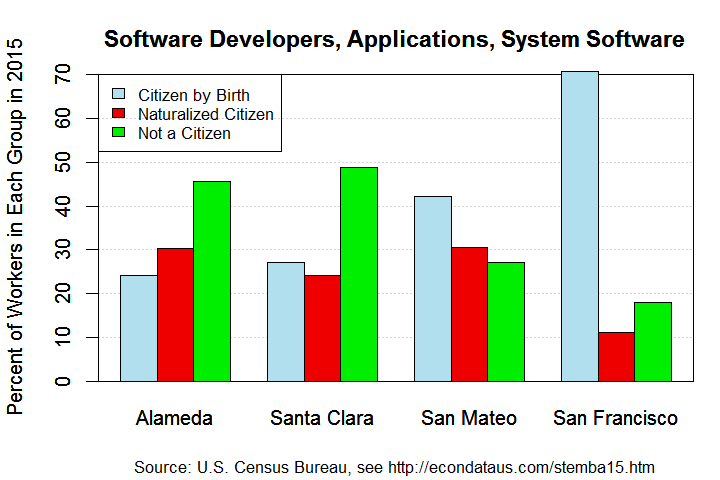
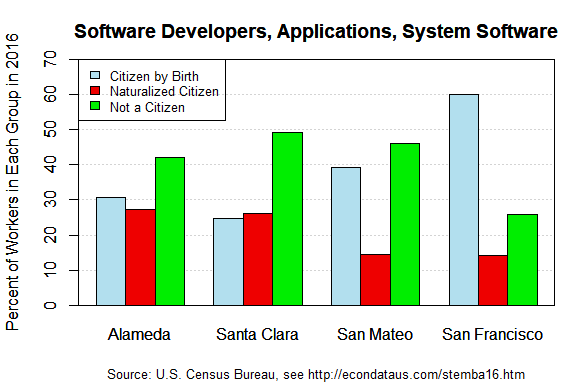
Silicon Valley Workforce in 2016
East and South Bay Workforce: 2016
Employed Population by Citizenship Status, 2016
Alameda county Santa Clara county
----------------------------------- ----------------------------------
Citizen Naturalized Not a Citizen Naturalized Not a
by birth Citizen Citizen by birth Citizen Citizen Occupation
---------- ---------- ---------- ---------- ---------- ---------- ----------
3,795 1,900 1,703 4,846 4,176 3,092 Computer and Information Systems Managers (MGR)
12,763 11,360 17,435 19,199 20,112 38,004 Software Developers, Applications and Systems Software (CMM)
1,331 1,000 452 2,547 2,716 2,433 Computer Programmers (CMM)
14,630 6,955 5,528 12,791 9,248 9,234 Other Computer and Mathematical (CMM)
---------- ---------- ---------- ---------- ---------- ---------- ----------
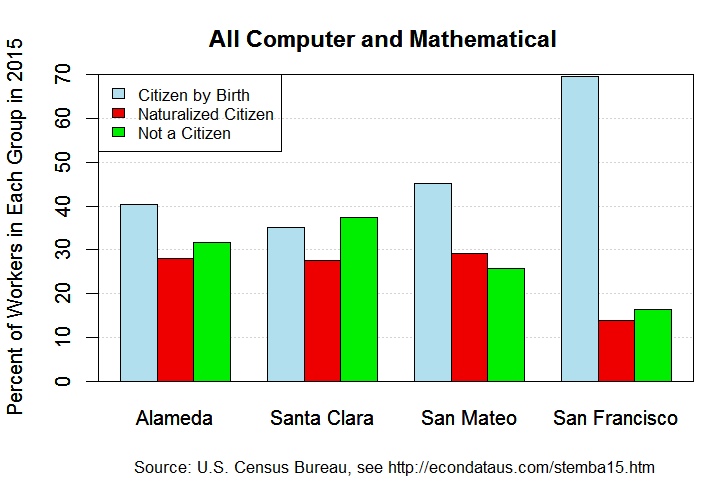
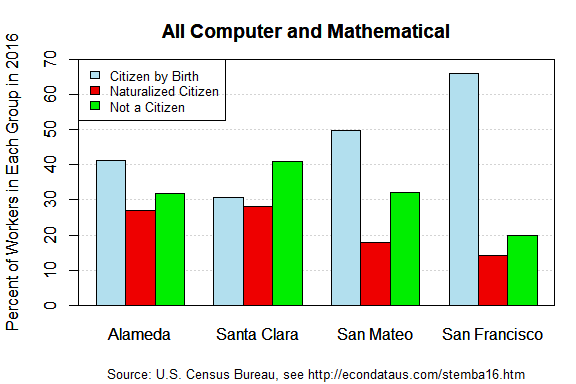
32,519 21,215 25,118 39,383 36,252 52,763 Total Computer and Mathematical (CMM & MGR)
395 1,073 336 2,694 3,166 1,605 Architectural and Engineering Managers (MGR)
12,883 7,222 6,289 19,997 20,006 16,275 Architectural and Engineering (ENG)
0 0 0 374 69 39 Natural Sciences Managers (MGR)
12,427 3,475 2,919 7,924 2,967 3,902 Life, physical, and social science (SCI)
2,294 1,537 0 2,395 999 186 Medical and Health Services Managers (MGR)
29,315 14,193 5,471 30,026 24,676 6,027 Medical and Health Services (MED & HLS)
5,189 1,542 934 4,979 2,110 765 Financial Managers (MGR)
6,795 5,033 1,479 9,269 8,445 2,334 Accountants and Auditors (FIN)
5,191 2,066 813 6,369 3,591 640 Other Financial (FIN)
54,441 15,869 7,805 59,516 23,830 13,578 Other Managers (MGR)
357,833 108,344 96,505 329,012 130,604 113,622 Other Workers
---------- ---------- ---------- ---------- ---------- ---------- ----------
519,282 181,569 147,669 511,938 256,715 211,736 TOTAL (all occupations)
==================================================================================
Percent of Employed Population by Citizenship Status, 2016
Alameda county Santa Clara county
----------------------------------- ----------------------------------
Citizen Naturalized Not a Citizen Naturalized Not a
by birth Citizen Citizen by birth Citizen Citizen Occupation
---------- ---------- ---------- ---------- ---------- ---------- ----------
51.3 25.7 23.0 40.0 34.5 25.5 Computer and Information Systems Managers (MGR)
30.7 27.3 42.0 24.8 26.0 49.2 Software Developers, Applications and Systems Software (CMM)
47.8 35.9 16.2 33.1 35.3 31.6 Computer Programmers (CMM)
54.0 25.7 20.4 40.9 29.6 29.5 Other Computer and Mathematical (CMM)
---------- ---------- ---------- ---------- ---------- ---------- ----------
41.2 26.9 31.9 30.7 28.2 41.1 Total Computer and Mathematical (CMM & MGR)
21.9 59.5 18.6 36.1 42.4 21.5 Architectural and Engineering Managers (MGR)
48.8 27.4 23.8 35.5 35.5 28.9 Architectural and Engineering (ENG)
NaN NaN NaN 77.6 14.3 8.1 Natural Sciences Managers (MGR)
66.0 18.5 15.5 53.6 20.1 26.4 Life, physical, and social science (SCI)
59.9 40.1 0.0 66.9 27.9 5.2 Medical and Health Services Managers (MGR)
59.9 29.0 11.2 49.4 40.6 9.9 Medical and Health Services (MED & HLS)
67.7 20.1 12.2 63.4 26.9 9.7 Financial Managers (MGR)
51.1 37.8 11.1 46.2 42.1 11.6 Accountants and Auditors (FIN)
64.3 25.6 10.1 60.1 33.9 6.0 Other Financial (FIN)
69.7 20.3 10.0 61.4 24.6 14.0 Other Managers (MGR)
63.6 19.3 17.2 57.4 22.8 19.8 Other Workers
---------- ---------- ---------- ---------- ---------- ---------- ----------
61.2 21.4 17.4 52.2 26.2 21.6 TOTAL (all occupations)
Source: Integrated Public Use Microdata Series (IPUMS), United States Census Bureau
Create extract with variables STATEFIP, COUNTY, MET2013, PUMA, CITIZEN, EMPSTAT, and OCC.
The variables YEAR, DATANUM, SERIAL, HHWT, GQ, PERNUM, and PERWT are automatically preselected.
For samples, select ACS for 2016. For data format, select STATA. For structure, select rectangular.
For more information, see IPUMS Documentation: User's Guide
Note: Citizen by birth = born in U.S., Guam, Puerto Rico, U.S. Virgin Islands or
Northern Marianas, or born abroad of American parent(s);
Tables and plots generated with R source code linked below.
North Bay Workforce: 2016
            Employed Population by Citizenship Status, 2016

San Mateo county                     San Francisco county
-----------------------------------  ----------------------------------
    Citizen  Naturalized      Not a     Citizen  Naturalized      Not a
   by birth     Citizen     Citizen    by birth     Citizen     Citizen  Occupation
 ----------  ----------  ----------  ----------  ----------  ----------  ----------
      2,822         649         424       2,477         468         758  Computer and Information Systems Managers (MGR)
      5,436       2,014       6,369      12,177       2,874       5,248  Software Developers, Applications and Systems Software (CMM)
      1,473         545         363       2,168         307         536  Computer Programmers (CMM)
      3,908       1,692       1,627      10,467       2,173       1,660  Other Computer and Mathematical (CMM)
 ----------  ----------  ----------  ----------  ----------  ----------  ----------
     13,639       4,900       8,783      27,289       5,822       8,202  Total Computer and Mathematical (CMM & MGR)
        896         277         260       1,317           0           0  Architectural and Engineering Managers (MGR)
      7,453       2,832       2,080       9,974       2,147       3,211  Architectural and Engineering (ENG)
         29         104          75           0           0           0  Natural Sciences Managers (MGR)
      4,318       2,035       1,284       6,028       1,444       2,160  Life, physical, and social science (SCI)
        939         688          42         912         804           0  Medical and Health Services Managers (MGR)
     18,305       9,441       1,557      21,448      11,192       2,442  Medical and Health Services (MED & HLS)
      4,841         834         387       4,418       1,041         336  Financial Managers (MGR)
      4,223       2,056       1,359       7,189       2,637       1,064  Accountants and Auditors (FIN)
      3,054       1,123         346      10,200       1,164         927  Other Financial (FIN)
     31,391       8,838       6,324      47,220      10,019       6,329  Other Managers (MGR)
    151,177      59,760      57,715     192,969      72,404      46,390  Other Workers
 ----------  ----------  ----------  ----------  ----------  ----------  ----------
    240,265      92,888      80,212     328,964     108,674      71,061  TOTAL (all occupations)
===================================================================================
      Percent of Employed Population by Citizenship Status, 2016

San Mateo county                     San Francisco county
-----------------------------------  ----------------------------------
    Citizen  Naturalized      Not a     Citizen  Naturalized      Not a
   by birth     Citizen     Citizen    by birth     Citizen     Citizen  Occupation
 ----------  ----------  ----------  ----------  ----------  ----------  ----------
       72.5        16.7        10.9        66.9        12.6        20.5  Computer and Information Systems Managers (MGR)
       39.3        14.6        46.1        60.0        14.2        25.9  Software Developers, Applications and Systems Software (CMM)
       61.9        22.9        15.2        72.0        10.2        17.8  Computer Programmers (CMM)
       54.1        23.4        22.5        73.2        15.2        11.6  Other Computer and Mathematical (CMM)
 ----------  ----------  ----------  ----------  ----------  ----------  ----------
       49.9        17.9        32.1        66.1        14.1        19.9  Total Computer and Mathematical (CMM & MGR)
       62.5        19.3        18.1       100.0         0.0         0.0  Architectural and Engineering Managers (MGR)
       60.3        22.9        16.8        65.1        14.0        20.9  Architectural and Engineering (ENG)
       13.9        50.0        36.1         NaN         NaN         NaN  Natural Sciences Managers (MGR)
       56.5        26.6        16.8        62.6        15.0        22.4  Life, physical, and social science (SCI)
       56.3        41.2         2.5        53.1        46.9         0.0  Medical and Health Services Managers (MGR)
       62.5        32.2         5.3        61.1        31.9         7.0  Medical and Health Services (MED & HLS)
       79.9        13.8         6.4        76.2        18.0         5.8  Financial Managers (MGR)
       55.3        26.9        17.8        66.0        24.2         9.8  Accountants and Auditors (FIN)
       67.5        24.8         7.6        83.0         9.5         7.5  Other Financial (FIN)
       67.4        19.0        13.6        74.3        15.8        10.0  Other Managers (MGR)
       56.3        22.2        21.5        61.9        23.2        14.9  Other Workers
 ----------  ----------  ----------  ----------  ----------  ----------  ----------
       58.1        22.5        19.4        64.7        21.4        14.0  TOTAL (all occupations)

Source: Integrated Public Use Microdata Series (IPUMS), United States Census Bureau
        Create extract with variables STATEFIP, COUNTY, MET2013, PUMA, CITIZEN, EMPSTAT, and OCC.
        The variables YEAR, DATANUM, SERIAL, HHWT, GQ, PERNUM, and PERWT are automatically preselected.
        For samples, select ACS for 2016. For data format, select STATA. For structure, select rectangular.
        For more information, see IPUMS Documentation: User's Guide
Note: Citizen by birth = born in U.S., Guam, Puerto Rico, U.S. Virgin Islands or
      Northern Marianas, or born abroad of American parent(s);
      Tables and plots generated with R source code linked below.