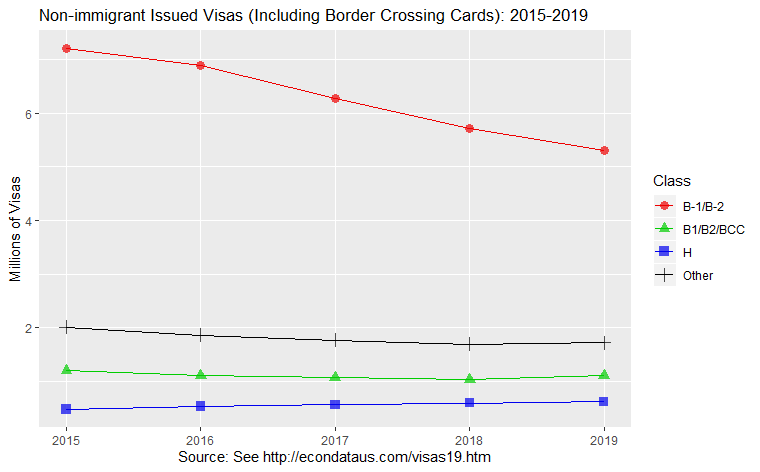
Classes of Nonimmigrants Issued Visas (B-1/B-2, H, and Other), Fiscal Years 2015-2019

      2015       2016      2017      2018      2019  Class     Description
---------- ---------- --------- --------- ---------  --------- -----------
 7,199,807  6,881,797 6,276,851 5,708,278 5,297,439  B-1/B-2   Temporary Visitor for Business and Pleasure
 1,203,876  1,106,723 1,073,915 1,032,467 1,106,852  B1/B2/BCC Combination B1/B2 and Border Crossing Card
   477,780    532,832   563,248   593,191   619,305  H         Temporary Worker and Trainee
 2,010,282  1,860,139 1,767,899 1,694,090 1,718,472  Other     Other Visa Classes (see below)
---------- ---------- --------- --------- ---------  ---------
10,891,745 10,381,491 9,681,913 9,028,026 8,742,068  Totals

Classes of Nonimmigrants Issued Visas (Including Border Crossing Cards), Fiscal Years 2015-2019

      2015       2016      2017      2018      2019  Class     Description
---------- ---------- --------- --------- ---------  --------- -----------
   112,585    113,581   109,913   113,820   110,028  A         Foreign Government Official
    43,421     40,105    39,712    38,705    37,841  B-1       Temporary Visitor for Business
 7,199,807  6,881,797 6,276,851 5,708,278 5,297,439  B-1/B-2   Temporary Visitor for Business and Pleasure
 1,203,876  1,106,723 1,073,915 1,032,467 1,106,852  B1/B2/BCC Combination B1/B2 and Border Crossing Card
    63,387     43,564    42,037    32,428    28,829  B-2       Temporary Visitor for Pleasure
    21,540     21,080    19,335    15,652    14,344  C         Transit
   280,664    295,140   293,285   288,957   285,477  C-1/D     Combination Transit/Crew Member
     3,737      8,972     6,846     3,550     3,787  CW        Commonwealth of Northern Mariana Islands Transitional Worker
     6,339      6,322     7,202     6,689     8,133  D         Crew Member
    59,221     64,329    62,974    60,438    63,178  E         Treaty Trader or Investor
   677,928    502,214   421,008   389,579   388,839  F         Student
    44,616     44,814    45,316    46,169    47,489  G         Representative/Staff of International Organization
   477,780    532,832   563,248   593,191   619,305  H         Temporary Worker and Trainee
    14,447     14,536    14,126    11,874    11,312  I         Representative of Foreign Information Media
   374,829    380,120   383,165   382,219   391,561  J         Exchange Visitor
    35,559     44,252    40,208    28,662    41,087  K         Fiance(e) of U.S. Citizen
   164,604    165,178   163,432   153,099   157,708  L         Intracompany Transferee
    11,462     10,694     9,982     9,683     9,518  M         Vocational Student
        18         21         9        22        24  N         Certain Relatives of SK Special immigrants
    21,608     24,530    25,731    28,189    32,233  NAFTA     NAFTA Professional
     6,247      6,336     6,588     7,398     7,954  NATO      NATO Official
    23,680     28,171    30,038    30,259    31,831  O         Person With Extraordinary Ability in the Sciences, Arts, Education, Business, or Athletics
    33,978     35,695    36,196    36,075    36,957  P         Athlete, Artist or Entertainer
     1,901      2,025     1,935     1,997     2,029  Q         International Cultural Exchange Program Participant
     6,256      6,424     6,831     6,307     6,288  R         Person in a Religious Occupation
         0          1         0         0         0  S         Informant Possessing Information on Criminal Activity or Terrorism
       508        472       473       435       386  T         Victim of Severe Form of Trafficking in Persons
     1,747      1,563     1,557     1,884     1,639  U         Victim of Criminal Activity
---------- ---------- --------- --------- ---------  ---------
10,891,745 10,381,491 9,681,913 9,028,026 8,742,068  Totals

Source: Table XVI(A) Classes of Nonimmigrants Issued Visas, Travel.State.Gov, U.S. Department of State - Bureau of Consular Affairs
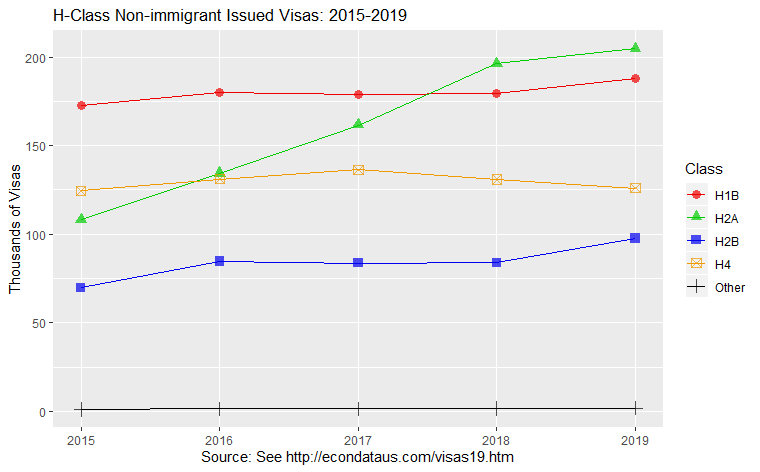
H-Class Non-immigrant Issued Visas, 2015-2019
H-Class Non-immigrant Issued Visas, Fiscal Years 2015-2019

     2015     2016     2017     2018     2019  Class  Description
 -------- -------- -------- -------- --------  -----  -----------
  172,748  180,057  179,049  179,660  188,123  H1B    Temporary worker of distinguished merit and ability performing services other than as a registered nurse
    1,051    1,294    1,391    1,498    1,724  H1B1   Free Trade Agreement Professional
        0        0        0        0        0  H1C    Shortage area nurse
  108,144  134,368  161,583  196,409  204,801  H2A    Temporary worker performing agricultural services
   69,684   84,627   83,600   83,774   97,623  H2B    Temporary worker performing other services
    1,669    1,435    1,232    1,036    1,035  H3     Trainee
  124,484  131,051  136,393  130,814  125,999  H4     Spouse or child of H1B/B1/C, H2A/B, or H3
 -------- -------- -------- -------- --------  ------
  477,780  532,832  563,248  593,191  619,305  Totals

Source: Table XVI(B) Nonimmigrant Visas Issued by Classification, Travel.State.Gov, U.S. Department of State - Bureau of Consular Affairs
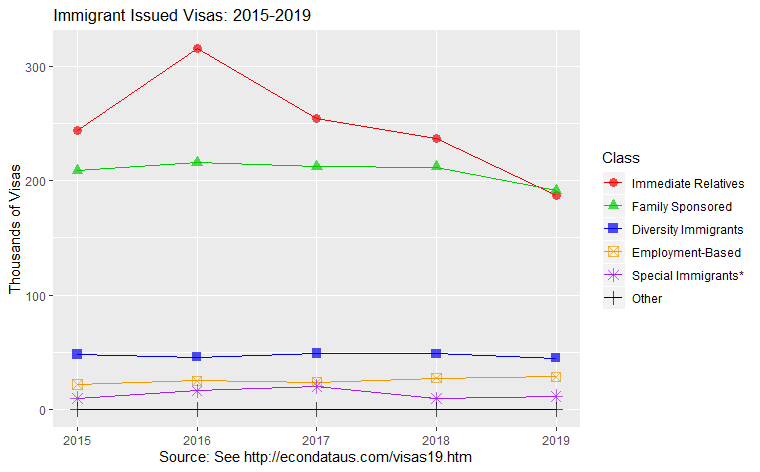
Immigrant Issued Visas, 2015-2019
Immigrant Visas Issued at Foreign Service Posts, by Category, Fiscal Years 2015-2019

     2015     2016     2017     2018     2019  Category
 -------- -------- -------- -------- --------  --------------------
  243,432  315,352  254,430  236,526  186,584  Immediate Relatives
  208,840  215,498  212,155  211,641  190,938  Family Sponsored
   48,097   45,664   49,067   48,578   44,882  Diversity Immigrants
   21,613   25,056   23,814   27,345   28,538  Employment-Based
    9,468   16,176   20,034    9,375   11,384  Special Immigrants*
       13        6       36       92       96  Vietnam Amerasian
        0        0        0        0        0  Armed Forces Special
  531,463  617,752  559,536  533,557  462,422  Total

* Special Immigrant totals include returning residents, Iraqi and Afghan translators, certain Iraqis or Afghans
  employed by or on behalf of the U.S. Government, and certain family members of U1 Nonimmigrants.

Source: Table I Immigrant and Nonimmigrant Visas Issued at Foreign Service Posts, Travel.State.Gov, U.S. Department of State - Bureau of Consular Affairs