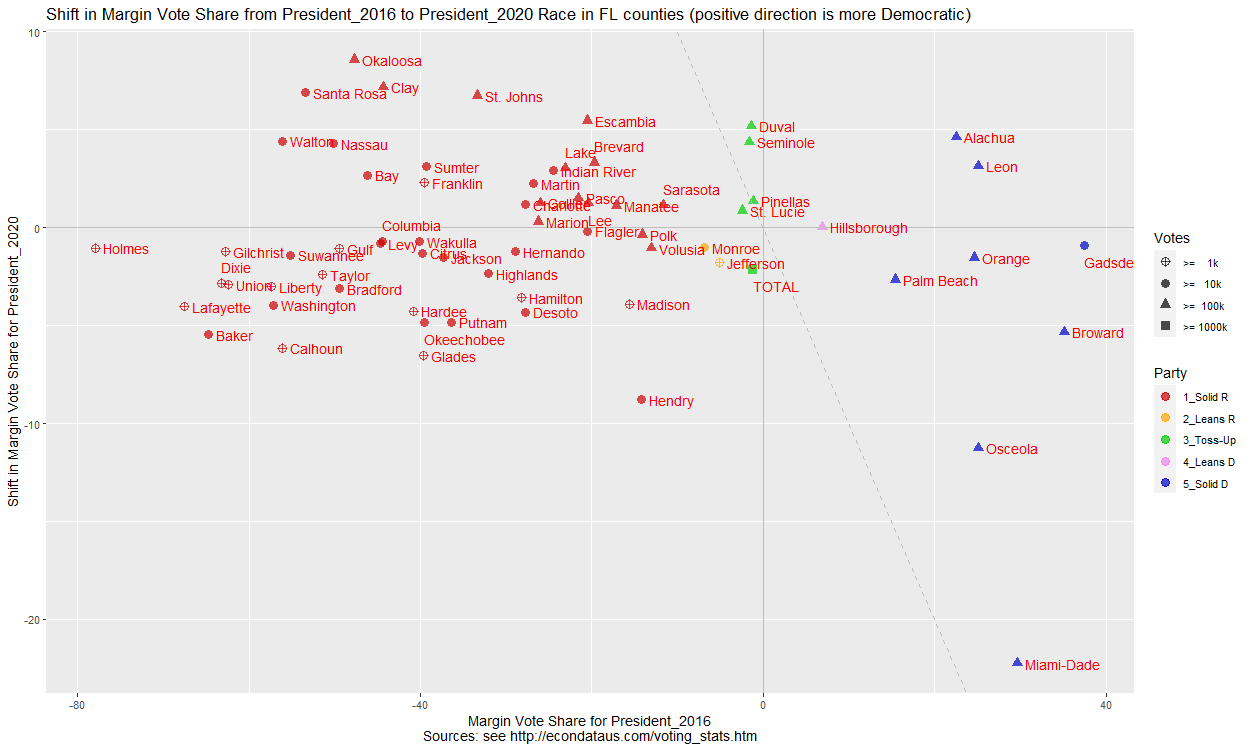
Shift in Vote Share from President_2016 to President_2020 Race in FL counties (Percent)

         COUNTY DEM.x REP.x MARGIN1 TOTAL1 DEM.y REP.y MARGIN2 TOTAL2 DEM_SH REP_SH MAR_SH TOT_SH
1       Alachua 58.97 36.43   22.54  95.40 62.90 35.74   27.16  98.65   3.93  -0.68   4.62   3.25
2         Baker 16.72 81.48  -64.76  98.20 14.49 84.72  -70.23  99.21  -2.23   3.24  -5.47   1.02
3           Bay 24.92 71.12  -46.19  96.04 27.53 71.05  -43.52  98.59   2.61  -0.06   2.67   2.55
4      Bradford 24.17 73.67  -49.50  97.84 23.18 75.81  -52.63  98.99  -0.99   2.13  -3.12   1.15
5       Brevard 38.02 57.78  -19.75  95.80 41.18 57.62  -16.45  98.80   3.15  -0.15   3.30   3.00
6       Broward 66.51 31.37   35.14  97.87 64.61 34.81   29.80  99.42  -1.90   3.45  -5.35   1.55
7       Calhoun 20.41 76.55  -56.14  96.96 18.53 80.82  -62.29  99.34  -1.88   4.27  -6.15   2.38
8     Charlotte 34.70 62.48  -27.78  97.19 36.34 62.96  -26.62  99.29   1.63   0.47   1.16   2.10
9        Citrus 28.59 68.33  -39.73  96.92 29.07 70.11  -41.05  99.18   0.47   1.79  -1.32   2.26
10         Clay 26.13 70.40  -44.27  96.53 30.80 67.91  -37.11  98.71   4.67  -2.49   7.16   2.18
11      Collier 35.77 61.73  -25.96  97.49 37.35 62.05  -24.70  99.40   1.58   0.32   1.26   1.91
12     Columbia 26.48 70.95  -44.47  97.43 26.98 72.14  -45.16  99.12   0.50   1.19  -0.69   1.69
13       Desoto 34.95 62.65  -27.70  97.61 33.64 65.67  -32.02  99.31  -1.31   3.01  -4.32   1.71
14        Dixie 17.63 80.84  -63.20  98.47 16.71 82.76  -66.05  99.47  -0.92   1.92  -2.84   1.00
15        Duval 47.54 48.92   -1.38  96.46 51.25 47.43    3.81  98.68   3.71  -1.49   5.19   2.22
16     Escambia 37.69 58.25  -20.56  95.93 41.63 56.74  -15.11  98.37   3.94  -1.50   5.45   2.44
17      Flagler 38.30 58.87  -20.56  97.17 39.27 60.02  -20.75  99.29   0.96   1.15  -0.19   2.12
18     Franklin 28.99 68.58  -39.58  97.57 30.95 68.26  -37.30  99.21   1.96  -0.32   2.28   1.64
19      Gadsden 67.92 30.43   37.50  98.35 67.98 31.42   36.56  99.39   0.05   0.99  -0.94   1.04
20    Gilchrist 17.32 80.05  -62.73  97.36 17.55 81.52  -63.96  99.07   0.24   1.47  -1.23   1.71
21       Glades 29.20 68.83  -39.63  98.02 26.67 72.83  -46.16  99.50  -2.53   4.00  -6.53   1.47
22         Gulf 23.58 73.07  -49.49  96.65 24.32 74.89  -50.57  99.20   0.73   1.82  -1.08   2.55
23     Hamilton 34.87 63.06  -28.19  97.93 33.67 65.44  -31.77  99.11  -1.20   2.38  -3.58   1.18
24       Hardee 28.34 69.13  -40.79  97.47 27.08 72.15  -45.07  99.23  -1.26   3.02  -4.28   1.77
25       Hendry 41.52 55.74  -14.22  97.26 38.09 61.10  -23.01  99.19  -3.43   5.36  -8.79   1.93
26     Hernando 33.90 62.87  -28.97  96.77 34.45 64.64  -30.20  99.09   0.55   1.77  -1.23   2.32
27    Highlands 32.69 64.71  -32.02  97.41 32.47 66.84  -34.38  99.31  -0.23   2.13  -2.36   1.90
28 Hillsborough 51.52 44.65    6.86  96.17 52.86 45.98    6.88  98.83   1.34   1.33   0.01   2.67
29       Holmes 10.02 87.89  -77.87  97.91 10.19 89.10  -78.91  99.29   0.17   1.21  -1.04   1.38
30 Indian River 36.30 60.77  -24.47  97.07 38.82 60.39  -21.57  99.21   2.52  -0.38   2.90   2.14
31      Jackson 30.40 67.76  -37.36  98.16 30.18 69.08  -38.90  99.26  -0.22   1.33  -1.55   1.10
32    Jefferson 46.32 51.41   -5.09  97.72 46.11 53.00   -6.89  99.11  -0.20   1.59  -1.80   1.39
33    Lafayette 15.27 82.81  -67.54  98.08 13.94 85.51  -71.57  99.45  -1.33   2.70  -4.03   1.37
34         Lake 36.86 59.95  -23.08  96.81 39.52 59.56  -20.04  99.08   2.65  -0.39   3.04   2.27
35          Lee 38.27 58.68  -20.42  96.95 40.03 59.21  -19.18  99.25   1.77   0.53   1.24   2.30
36         Leon 60.52 35.38   25.14  95.90 63.54 35.26   28.27  98.80   3.02  -0.12   3.13   2.90
37         Levy 26.30 71.02  -44.72  97.32 26.81 72.37  -45.56  99.17   0.51   1.34  -0.83   1.85
38      Liberty 19.75 77.15  -57.40  96.91 19.49 79.92  -60.43  99.41  -0.26   2.77  -3.03   2.50
39      Madison 41.46 57.04  -15.58  98.50 39.95 59.45  -19.50  99.39  -1.51   2.41  -3.92   0.90
40      Manatee 39.80 56.97  -17.17  96.76 41.56 57.61  -16.05  99.17   1.76   0.64   1.12   2.40
41       Marion 35.51 61.72  -26.21  97.24 36.63 62.54  -25.92  99.17   1.11   0.82   0.29   1.93
42       Martin 35.18 62.02  -26.83  97.20 37.37 61.96  -24.59  99.33   2.19  -0.06   2.24   2.13
43   Miami-Dade 63.68 34.07   29.60  97.75 53.41 46.06    7.35  99.47 -10.26  11.99 -22.25   1.72
44       Monroe 44.66 51.57   -6.90  96.23 45.56 53.49   -7.94  99.05   0.90   1.93  -1.03   2.83
45       Nassau 23.32 73.52  -50.20  96.84 26.46 72.38  -45.91  98.84   3.14  -1.14   4.29   2.00
46     Okaloosa 23.58 71.28  -47.71  94.86 29.43 68.57  -39.14  98.00   5.85  -2.71   8.56   3.14
47   Okeechobee 29.00 68.53  -39.53  97.52 27.52 71.89  -44.38  99.41  -1.48   3.37  -4.85   1.89
48       Orange 60.39 35.74   24.65  96.13 61.02 37.90   23.11  98.92   0.63   2.17  -1.54   2.79
49      Osceola 60.95 35.88   25.08  96.83 56.42 42.61   13.81  99.04  -4.53   6.74 -11.26   2.21
50   Palm Beach 56.57 41.13   15.44  97.70 56.08 43.29   12.79  99.37  -0.49   2.16  -2.65   1.67
51        Pasco 37.38 58.93  -21.55  96.31 39.43 59.48  -20.05  98.92   2.05   0.55   1.50   2.60
52     Pinellas 47.46 48.58   -1.12  96.04 49.57 49.35    0.22  98.92   2.11   0.77   1.34   2.88
53         Polk 41.30 55.37  -14.07  96.68 42.26 56.69  -14.43  98.95   0.95   1.32  -0.36   2.27
54       Putnam 30.48 66.85  -36.37  97.33 28.94 70.15  -41.20  99.09  -1.54   3.30  -4.84   1.76
55   Santa Rosa 21.04 74.46  -53.42  95.51 25.82 72.37  -46.55  98.19   4.78  -2.09   6.87   2.69
56     Sarasota 42.73 54.32  -11.60  97.05 44.39 54.84  -10.44  99.23   1.66   0.51   1.15   2.17
57     Seminole 47.09 48.66   -1.57  95.76 50.81 48.02    2.79  98.83   3.72  -0.64   4.36   3.07
58    St. Johns 31.57 64.96  -33.39  96.53 36.15 62.82  -26.66  98.97   4.58  -2.15   6.73   2.43
59    St. Lucie 47.48 49.90   -2.42  97.39 48.87 50.43   -1.56  99.30   1.38   0.53   0.85   1.91
60       Sumter 29.53 68.78  -39.25  98.31 31.73 67.86  -36.14  99.59   2.20  -0.92   3.12   1.28
61     Suwannee 21.20 76.43  -55.22  97.63 21.30 77.93  -56.63  99.23   0.09   1.51  -1.41   1.60
62       Taylor 23.16 74.60  -51.43  97.76 22.70 76.54  -53.84  99.24  -0.46   1.94  -2.40   1.48
63        Union 17.81 80.22  -62.42  98.03 16.86 82.19  -65.33  99.06  -0.95   1.97  -2.92   1.02
64      Volusia 41.82 54.82  -13.00  96.64 42.47 56.54  -14.07  99.01   0.65   1.72  -1.07   2.37
65      Wakulla 28.32 68.48  -40.15  96.80 29.08 69.95  -40.88  99.03   0.75   1.47  -0.72   2.23
66       Walton 20.44 76.57  -56.13  97.01 23.65 75.37  -51.72  99.03   3.21  -1.20   4.40   2.01
67   Washington 20.29 77.42  -57.13  97.71 19.04 80.12  -61.08  99.16  -1.25   2.70  -3.95   1.44
68        TOTAL 47.82 49.02   -1.20  96.85 47.86 51.22   -3.36  99.08   0.04   2.20  -2.16   2.24

Source: Florida Department of State, Select Election: 2020 General Election
        Download Results: November 3, 2020 General Election
        Florida Department of State, Select Election: 2016 General Election
        Download Results: November 8, 2016 General Election
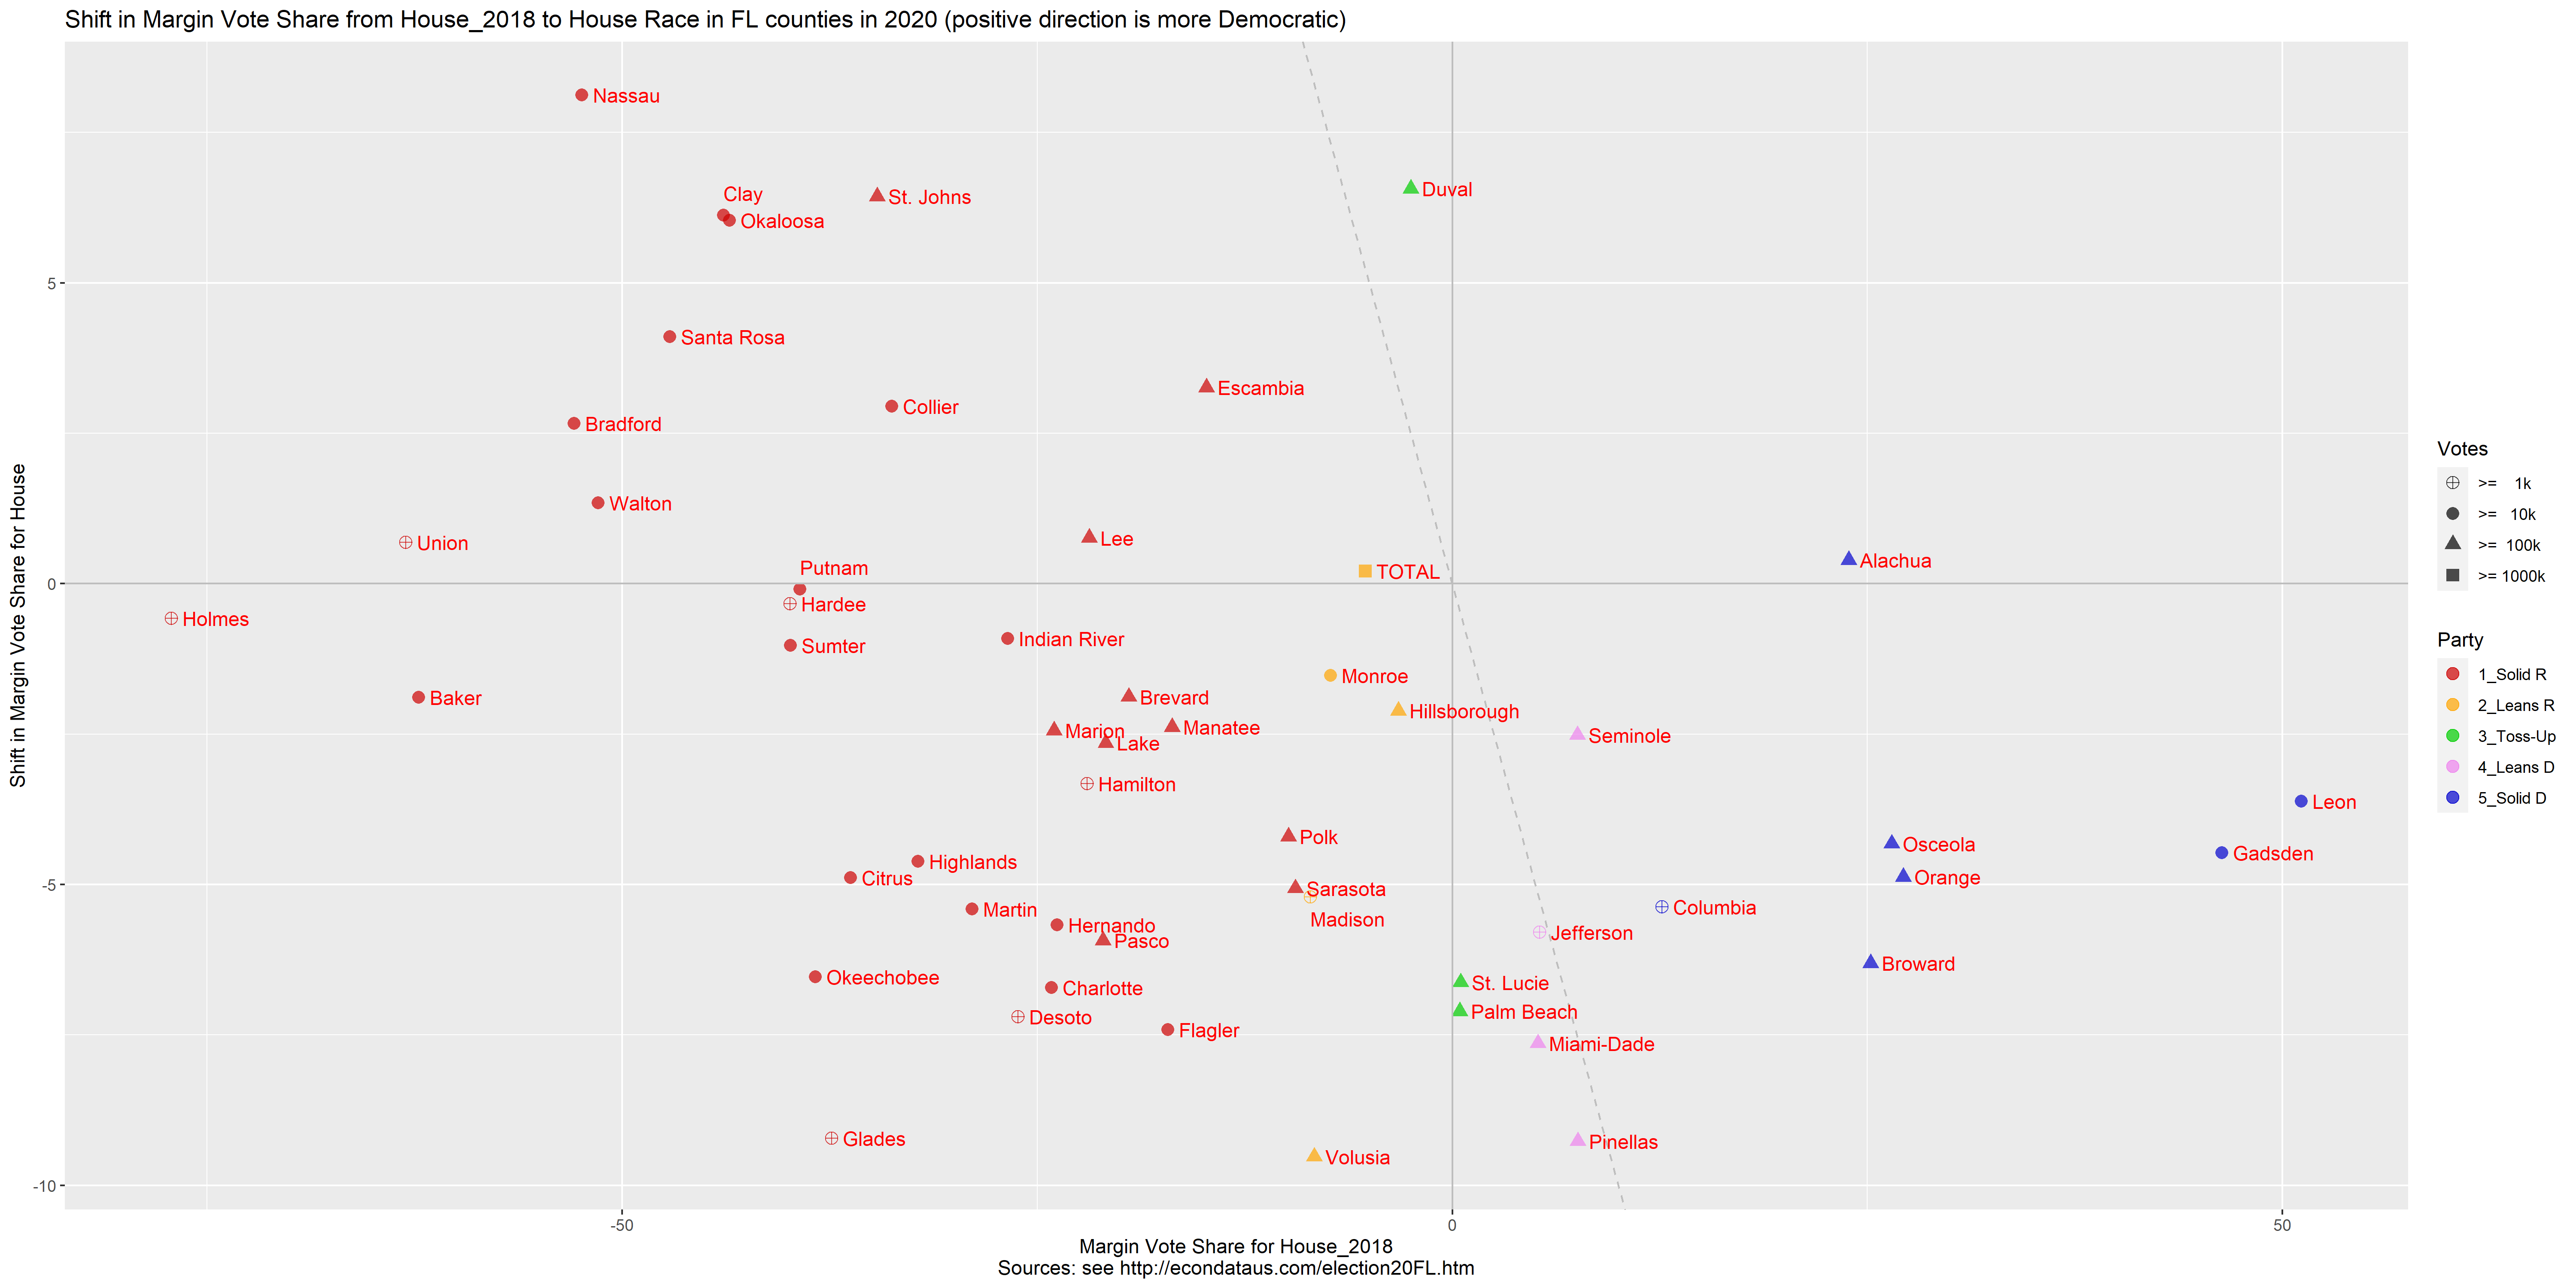
Shift in Vote Share from House_2018 to House Race in FL counties in 2020 (Percent)

         COUNTY DEM.x REP.x MARGIN1 TOTAL1 DEM.y REP.y MARGIN2 TOTAL2 DEM_SH REP_SH MAR_SH TOT_SH
1       Alachua 61.95 38.05   23.89 100.00 62.14 37.86   24.28 100.00   0.20  -0.20   0.39   0.00
2         Baker 18.88 81.12  -62.24 100.00 17.94 82.06  -64.13 100.00  -0.94   0.94  -1.89   0.00
3      Bradford 23.56 76.44  -52.89 100.00 24.89 75.11  -50.22 100.00   1.33  -1.33   2.66   0.00
4       Brevard 40.26 59.74  -19.48 100.00 39.32 60.68  -21.36 100.00  -0.94   0.94  -1.88   0.00
5       Broward 61.12 35.93   25.20  97.05 59.44 40.55   18.89  99.99  -1.68   4.62  -6.31   2.94
6     Charlotte 37.92 62.08  -24.15 100.00 33.90 64.76  -30.86  98.66  -4.03   2.69  -6.71  -1.34
7        Citrus 31.87 68.12  -36.25  99.99 29.43 70.57  -41.13 100.00  -2.43   2.45  -4.88   0.01
8          Clay 28.05 71.95  -43.90 100.00 31.11 68.89  -37.77 100.00   3.06  -3.06   6.12   0.00
9       Collier 33.12 66.88  -33.76 100.00 34.59 65.41  -30.82 100.00   1.47  -1.47   2.95   0.00
10     Columbia 56.31 43.69   12.62 100.00 53.63 46.37    7.25 100.00  -2.68   2.68  -5.37   0.00
11       Desoto 36.92 63.08  -26.15 100.00 32.77 66.12  -33.35  98.90  -4.15   3.05  -7.20  -1.10
12        Duval 47.95 50.45   -2.50  98.40 52.03 47.96    4.07 100.00   4.08  -2.49   6.57   1.59
13     Escambia 42.60 57.40  -14.80 100.00 43.56 55.10  -11.54  98.66   0.96  -2.30   3.26  -1.34
14      Flagler 41.43 58.57  -17.14 100.00 37.72 62.26  -24.55  99.98  -3.72   3.70  -7.41  -0.02
15      Gadsden 73.18 26.82   46.35 100.00 70.94 29.06   41.88 100.00  -2.24   2.24  -4.47   0.00
16       Glades 31.31 68.69  -37.39 100.00 25.98 72.58  -46.60  98.56  -5.33   3.89  -9.21  -1.44
17     Hamilton 39.00 61.00  -21.99 100.00 37.34 62.66  -25.32 100.00  -1.66   1.66  -3.32   0.00
18       Hardee 30.06 69.94  -39.88 100.00 29.09 69.30  -40.22  98.39  -0.97  -0.64  -0.34  -1.61
19     Hernando 38.10 61.89  -23.79  99.98 35.27 64.73  -29.46 100.00  -2.83   2.85  -5.67   0.02
20    Highlands 33.92 66.08  -32.17 100.00 31.03 67.81  -36.78  98.85  -2.88   1.73  -4.61  -1.15
21 Hillsborough 48.35 51.60   -3.24  99.95 47.32 52.68   -5.36 100.00  -1.03   1.08  -2.11   0.05
22       Holmes 11.43 88.57  -77.14 100.00 10.36 88.07  -77.72  98.43  -1.07  -0.50  -0.58  -1.57
23 Indian River 36.62 63.38  -26.77 100.00 36.16 63.84  -27.68 100.00  -0.46   0.46  -0.91   0.00
24    Jefferson 52.63 47.37    5.26 100.00 49.73 50.27   -0.54 100.00  -2.90   2.90  -5.79   0.00
25         Lake 39.56 60.43  -20.87  99.99 38.24 61.75  -23.52  99.99  -1.32   1.32  -2.65   0.00
26          Lee 39.06 60.93  -21.87  99.99 39.36 60.46  -21.10  99.82   0.30  -0.46   0.76  -0.17
27         Leon 75.57 24.43   51.15 100.00 73.76 26.24   47.53 100.00  -1.81   1.81  -3.62   0.00
28      Madison 45.73 54.27   -8.54 100.00 43.13 56.87  -13.74 100.00  -2.60   2.60  -5.20   0.00
29      Manatee 41.56 58.44  -16.88 100.00 40.37 59.63  -19.26 100.00  -1.19   1.19  -2.38   0.00
30       Marion 38.00 61.98  -23.98  99.99 36.79 63.21  -26.42 100.00  -1.21   1.23  -2.44   0.01
31       Martin 35.54 64.46  -28.93 100.00 31.82 66.15  -34.33  97.97  -3.72   1.69  -5.41  -2.03
32   Miami-Dade 51.82 46.67    5.15  98.49 48.75 51.24   -2.49  99.99  -3.07   4.57  -7.64   1.50
33       Monroe 46.34 53.66   -7.33 100.00 45.57 54.43   -8.85 100.00  -0.76   0.76  -1.53   0.00
34       Nassau 22.88 75.32  -52.44  98.20 27.84 72.16  -44.31 100.00   4.96  -3.16   8.13   1.80
35     Okaloosa 28.24 71.76  -43.53 100.00 30.44 67.93  -37.49  98.37   2.20  -3.84   6.04  -1.63
36   Okeechobee 30.82 69.18  -38.36 100.00 26.66 71.55  -44.89  98.21  -4.16   2.37  -6.53  -1.79
37       Orange 63.58 36.42   27.16 100.00 60.71 38.42   22.29  99.14  -2.87   2.00  -4.87  -0.86
38      Osceola 63.23 36.77   26.46 100.00 61.06 38.93   22.14  99.99  -2.16   2.16  -4.32  -0.01
39   Palm Beach 50.23 49.77    0.46 100.00 45.96 52.60   -6.64  98.56  -4.27   2.83  -7.11  -1.44
40        Pasco 38.25 59.28  -21.03  97.53 36.52 63.48  -26.96 100.00  -1.73   4.20  -5.93   2.47
41     Pinellas 53.52 45.97    7.55  99.50 49.14 50.86   -1.71 100.00  -4.38   4.88  -9.27   0.50
42         Polk 45.06 54.93   -9.87  99.99 42.86 56.94  -14.07  99.80  -2.20   2.00  -4.20  -0.20
43       Putnam 30.35 69.65  -39.29 100.00 30.31 69.69  -39.39 100.00  -0.05   0.05  -0.09   0.00
44   Santa Rosa 26.43 73.57  -47.14 100.00 27.83 70.87  -43.04  98.70   1.40  -2.70   4.10  -1.30
45     Sarasota 45.27 54.73   -9.45 100.00 42.50 57.01  -14.51  99.51  -2.78   2.29  -5.06  -0.49
46     Seminole 53.77 46.23    7.54 100.00 51.83 46.80    5.03  98.62  -1.95   0.57  -2.52  -1.38
47    St. Johns 31.63 66.27  -34.64  97.90 35.90 64.10  -28.20 100.00   4.27  -2.17   6.44   2.10
48    St. Lucie 50.26 49.74    0.51 100.00 45.77 51.89   -6.11  97.66  -4.48   2.14  -6.63  -2.34
49       Sumter 30.07 69.92  -39.85  99.99 29.56 70.44  -40.88 100.00  -0.51   0.52  -1.03   0.01
50        TOTAL 47.10 52.35   -5.24  99.45 47.23 52.26   -5.03  99.49   0.13  -0.08   0.21   0.04
51        Union 18.49 81.51  -63.03 100.00 18.83 81.17  -62.34 100.00   0.34  -0.34   0.68   0.00
52      Volusia 45.85 54.15   -8.31 100.00 41.06 58.89  -17.83  99.96  -4.78   4.74  -9.52  -0.04
53       Walton 24.28 75.72  -51.45 100.00 24.46 74.56  -50.10  99.02   0.18  -1.17   1.35  -0.98

Source: Florida Department of State, Select Election: 2020 General Election
        Download Results: November 3, 2020 General Election
        Florida Department of State, Select Election: 2018 General Election
        Download Results: November 6, 2018 General Election
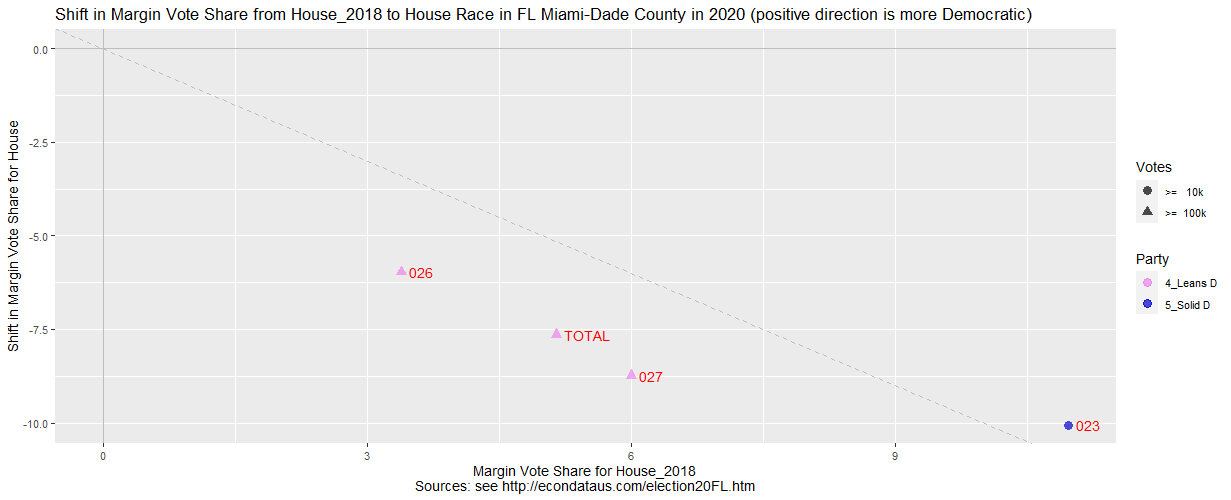
Shift in Vote Share from House_2018 to House_2020 Race in FL Miami-Dade County (Percent)
Shift in Vote Share from House_2018 to House Race in FL counties in 2020 (Percent)

       COUNTY DISTRICT DEM.x REP.x MARGIN1 TOTAL1 DEM.y REP.y MARGIN2   TOT2 DEM_SH REP_SH MAR_SH TOT_SH
60 Miami-Dade      023 53.51 42.54   10.96  96.05 50.44 49.53    0.91  99.98  -3.07   6.99 -10.06   3.93
61 Miami-Dade      024    NA    NA      NA     NA 76.65 19.36   57.29  96.01     NA     NA     NA     NA
62 Miami-Dade      025 39.70 60.30  -20.60 100.00    NA    NA      NA     NA     NA     NA     NA     NA
63 Miami-Dade      026 51.69 48.31    3.39 100.00 48.70 51.30   -2.59 100.00  -2.99   2.99  -5.98   0.00
64 Miami-Dade      027 51.76 45.76    6.00  97.52 48.62 51.36   -2.74  99.98  -3.14   5.59  -8.74   2.45

Source: Florida Department of State, Select Election: 2020 General Election
        Download Results: November 3, 2020 General Election
        Florida Department of State, Select Election: 2018 General Election
        Download Results: November 6, 2018 General Election