Computer Workforce by Age: 2012
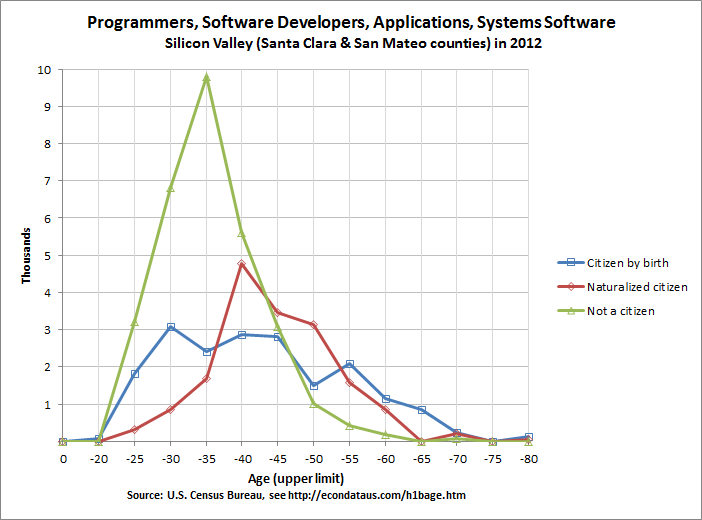
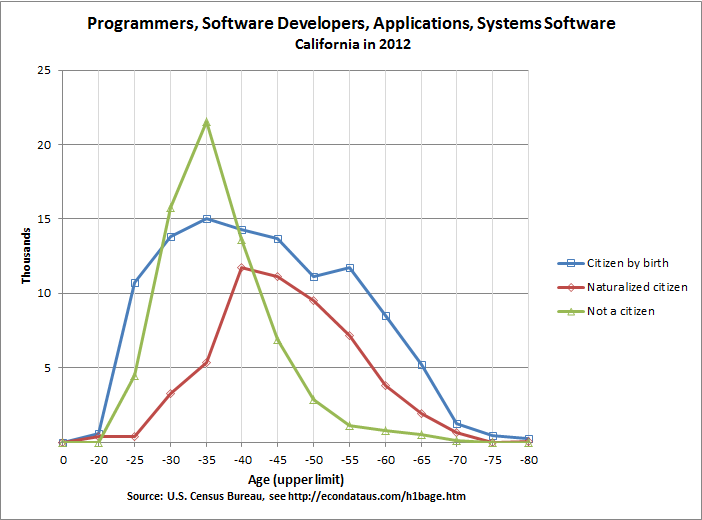
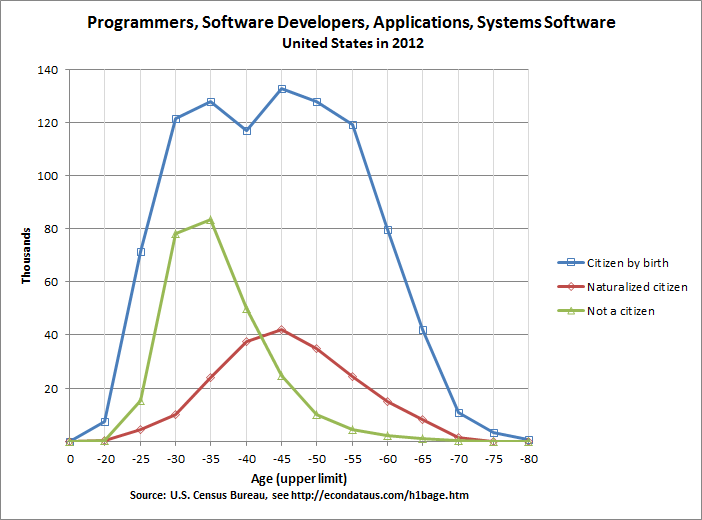
Programmers, Software Developers, Applications and Systems Software by Age, 2012
Silicon Valley California United States
---------------------------------- ---------------------------------- ----------------------------------
Citizen Naturalized Not a Citizen Naturalized Not a Citizen Naturalized Not a
Age by birth Citizen Citizen by birth Citizen Citizen by birth Citizen Citizen
------ ---------- ---------- ---------- ---------- ---------- ---------- ---------- ---------- ----------
0-15 0 0 0 0 0 0 0 0 0
16-20 79 0 0 619 380 0 7,327 455 142
21-25 1,829 328 3,229 10,762 363 4,504 71,218 4,361 15,398
26-30 3,074 854 6,819 13,844 3,263 15,765 121,470 10,051 78,223
31-35 2,416 1,691 9,814 15,060 5,340 21,565 127,987 24,091 83,253
36-40 2,869 4,781 5,621 14,281 11,725 13,624 116,754 37,717 50,101
41-45 2,815 3,473 3,082 13,698 11,131 6,936 132,544 42,206 24,825
46-50 1,495 3,139 1,010 11,115 9,532 2,905 127,822 34,871 10,151
51-55 2,099 1,572 425 11,750 7,191 1,131 119,117 24,178 4,572
56-60 1,161 841 184 8,538 3,835 769 79,591 14,958 1,995
61-65 841 0 0 5,207 1,900 488 41,964 8,207 939
66-70 238 218 86 1,258 631 86 11,005 1,512 467
71-75 0 0 0 450 0 0 3,217 58 0
76-80 116 51 0 247 51 0 781 51 76
81-85 0 0 0 0 0 0 154 0 0
86-90 0 0 0 0 0 0 66 0 0
91-99 0 0 0 0 0 0 70 0 0
------ ---------- ---------- ---------- ---------- ---------- ---------- ---------- ---------- ----------
TOTAL 19,032 16,948 30,270 106,829 55,342 67,773 961,087 202,716 270,142
==================================================================================================================
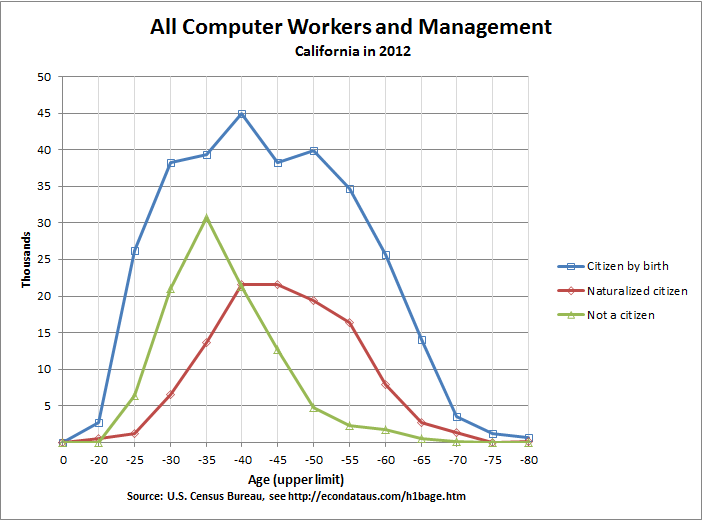
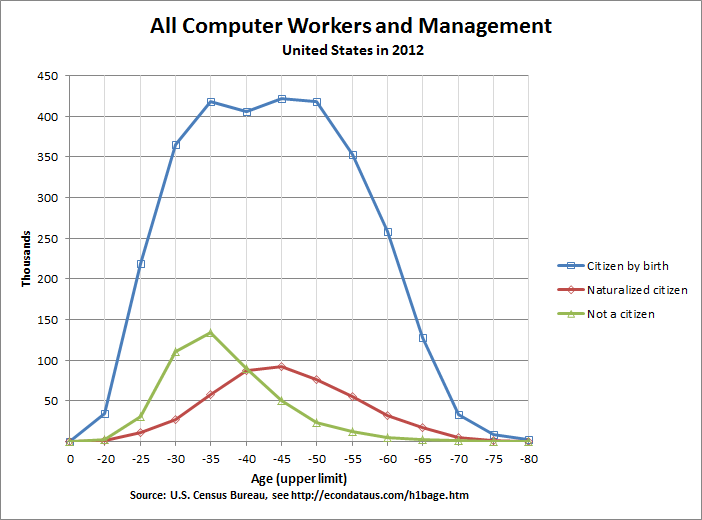
All Computer Workers and Management by Age, 2012
Silicon Valley California United States
Citizen Naturalized Not a Citizen Naturalized Not a Citizen Naturalized Not a
Age by birth Citizen Citizen by birth Citizen Citizen by birth Citizen Citizen
------ ---------- ---------- ---------- ---------- ---------- ---------- ---------- ---------- ----------
0-15 0 0 0 0 0 0 0 0 0
16-20 79 0 0 2,654 508 0 34,151 1,214 2,217
21-25 3,338 427 3,346 26,161 1,198 6,415 218,645 10,991 30,096
26-30 6,639 1,593 7,542 38,313 6,539 21,087 365,055 26,868 110,769
31-35 5,067 3,450 12,405 39,348 13,610 30,776 418,453 57,497 133,483
36-40 6,592 6,018 8,557 44,990 21,582 21,298 405,661 87,195 89,468
41-45 5,261 5,519 4,198 38,284 21,573 12,625 422,100 92,603 50,314
46-50 4,397 5,328 1,343 39,938 19,368 4,792 417,910 75,936 22,548
51-55 4,261 3,993 875 34,712 16,318 2,301 353,060 55,321 11,459
56-60 2,498 1,714 184 25,683 7,864 1,704 258,229 31,855 4,490
61-65 1,572 363 0 13,992 2,690 488 127,487 16,325 1,570
66-70 380 273 86 3,548 1,366 86 32,750 4,090 1,247
71-75 0 0 0 1,168 0 0 8,513 323 62
76-80 116 113 0 584 113 0 1,861 199 184
81-85 0 0 0 62 0 0 624 52 0
86-90 0 0 0 0 209 0 66 209 0
91-99 0 0 0 0 0 0 70 0 0
------ ---------- ---------- ---------- ---------- ---------- ---------- ---------- ---------- ----------
TOTAL 40,200 28,791 38,536 309,437 112,938 101,572 3,064,635 460,678 457,907
Source: American Community Survey, Public Use Microdata Sample (PUMS) on DataFerrett,
United States Census Bureau (Instructions for Generating Data)
Note: Employed = Civilian employed, at work (series ESR);
Citizen by birth = born in U.S., Guam, Puerto Rico, U.S. Virgin Islands or
Northern Marianas, or born abroad of American parent(s) (series CIT);
Programmers, Software Developers, Applications and Systems Software = OCCP codes 1010 and 1020;
All Computer Workers and Management = all following codes except last 3 (1200, 1220, and 1240)
Code Computer And Mathematics Job Categories
---- ---------------------------------------
0110 MGR-Computer and Information Systems Managers
1005 CMM-Computer and Information Research Scientists
1006 CMM-Computer Systems Analysts
1007 CMM-Information Security Analysts
1010 CMM-Computer Programmers
1020 CMM-Software Developers, Applications and Systems Software
1030 CMM-Web Developers
1050 CMM-Computer Support Specialists
1060 CMM-Database Administrators
1105 CMM-Network and Computer Systems Administrators
1106 CMM-Computer Network Architects
1107 CMM-Computer Occupations, All Other
1200 CMM-Actuaries
1220 CMM-Operations Research Analysts
1240 CMM-Miscellaneous Mathematical Science Occupations, Including Mathematicians and Statisticians
All Computer Workers and Management by OCCP Occupation in Silicon Valley (total count)
Citizen Naturalized Not a Total
Code by birth Citizen Citizen Employed OCCP Occupation Category
---- ---------- ---------- ---------- ---------- ----------------------------------------------------------
0110 3,994 4,606 2,285 10,885 MGR-Computer and Information Systems Managers
1005 269 0 0 269 CMM-Computer and Information Research Scientists
1006 2,673 1,374 2,527 6,574 CMM-Computer Systems Analysts
1007 550 77 389 1,016 CMM-Information Security Analysts
1010 4,296 2,252 3,349 9,897 CMM-Computer Programmers
1020 14,736 14,696 26,921 56,353 CMM-Software Developers, Applications and Systems Software
1030 2,207 364 314 2,885 CMM-Web Developers
1050 5,070 2,640 1,279 8,989 CMM-Computer Support Specialists
1060 629 460 278 1,367 CMM-Database Administrators
1105 2,497 477 494 3,468 CMM-Network and Computer Systems Administrators
1106 1,143 310 376 1,829 CMM-Computer Network Architects
1107 2,136 1,535 324 3,995 CMM-Computer Occupations, All Other
---- ---------- ---------- ---------- ---------- ----------------------------------------------------------
40,200 28,791 38,536 78,736 TOTAL COMPUTER
All Computer Workers and Management by OCCP Occupation in Silicon Valley (percent of employed)
Citizen Naturalized Not a Total
Code by birth Citizen Citizen Employed OCCP Occupation Category
---- ---------- ---------- ---------- ---------- ----------------------------------------------------------
0110 36.7 42.3 21.0 100.0 MGR-Computer and Information Systems Managers
1005 100.0 0.0 0.0 100.0 CMM-Computer and Information Research Scientists
1006 40.7 20.9 38.4 100.0 CMM-Computer Systems Analysts
1007 54.1 7.6 38.3 100.0 CMM-Information Security Analysts
1010 43.4 22.8 33.8 100.0 CMM-Computer Programmers
1020 26.1 26.1 47.8 100.0 CMM-Software Developers, Applications and Systems Software
1030 76.5 12.6 10.9 100.0 CMM-Web Developers
1050 56.4 29.4 14.2 100.0 CMM-Computer Support Specialists
1060 46.0 33.7 20.3 100.0 CMM-Database Administrators
1105 72.0 13.8 14.2 100.0 CMM-Network and Computer Systems Administrators
1106 62.5 16.9 20.6 100.0 CMM-Computer Network Architects
1107 53.5 38.4 8.1 100.0 CMM-Computer Occupations, All Other
---- ---------- ---------- ---------- ---------- ----------------------------------------------------------
Silicon Valley Workforce Statistics
Information on H-1B Visas
Commentary on the Skills Gap
Go to Budget Home Page