Employed Population by Citizenship Status, 2014
Silicon Valley Area San Francisco Area
----------------------------------- ----------------------------------
Santa Clara & San Mateo counties Alameda & San Francisco counties
----------------------------------- ----------------------------------
Citizen Naturalized Not a Citizen Naturalized Not a
by birth Citizen Citizen by birth Citizen Citizen Occupation
---------- ---------- ---------- ---------- ---------- ---------- ----------
4,411 3,807 2,341 6,921 3,616 992 Computer and Information Systems Managers (MGR)
20,619 20,376 39,551 17,529 8,361 15,687 Software Developers, Applications and Systems Software (CMM)
2,389 2,691 2,412 5,496 2,004 1,616 Computer Programmers (CMM)
15,514 9,801 7,844 23,245 9,147 6,100 Other Computer and Mathematical (CMM)
---------- ---------- ---------- ---------- ---------- ---------- ----------
42,933 36,675 52,148 53,191 23,128 24,395 Total Computer and Mathematical (CMM & MGR)
2,145 2,188 1,566 2,092 591 542 Architectural and Engineering Managers (MGR)
26,143 24,311 16,369 18,896 11,248 6,518 Architectural and Engineering (ENG)
238 49 38 166 0 0 Natural Sciences Managers (MGR)
11,511 5,117 5,722 20,343 5,463 4,010 Life, physical, and social science (SCI)
3,654 572 260 3,059 934 562 Medical and Health Services Managers (MGR)
49,198 28,782 7,957 54,898 25,325 8,859 Medical and Health Services (MED & HLS)
9,066 4,127 1,126 7,084 2,886 1,067 Financial Managers (MGR)
12,300 9,738 3,292 13,461 7,303 2,098 Accountants and Auditors (FIN)
10,739 3,582 791 9,758 4,402 1,321 Other Financial (FIN)
83,172 33,998 18,094 96,905 20,733 14,602 Other Managers (MGR)
482,554 192,940 171,171 536,702 166,558 143,623 Other Workers
---------- ---------- ---------- ---------- ---------- ---------- ----------
733,653 342,079 278,534 816,555 268,571 207,597 TOTAL (all occupations)
==================================================================================
Percent of Employed Population by Citizenship Status, 2014
Silicon Valley Area San Francisco Area
----------------------------------- ----------------------------------
Santa Clara & San Mateo counties Alameda & San Francisco counties
----------------------------------- ----------------------------------
Citizen Naturalized Not a Citizen Naturalized Not a
by birth Citizen Citizen by birth Citizen Citizen Occupation
---------- ---------- ---------- ---------- ---------- ---------- ----------
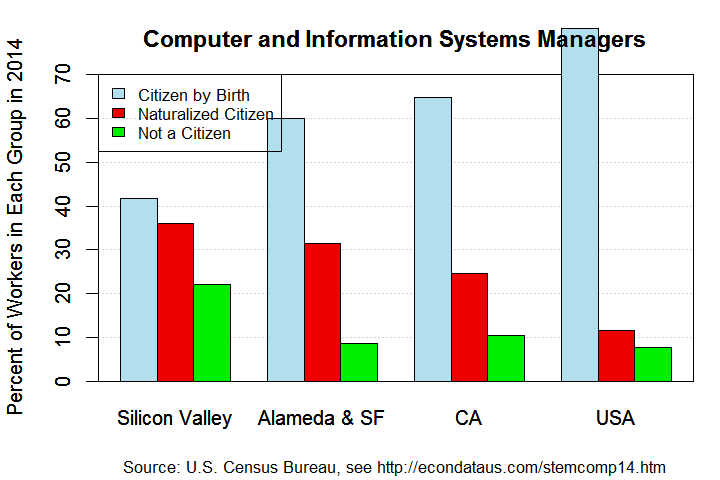
41.8 36.1 22.2 60.0 31.4 8.6 Computer and Information Systems Managers (MGR)
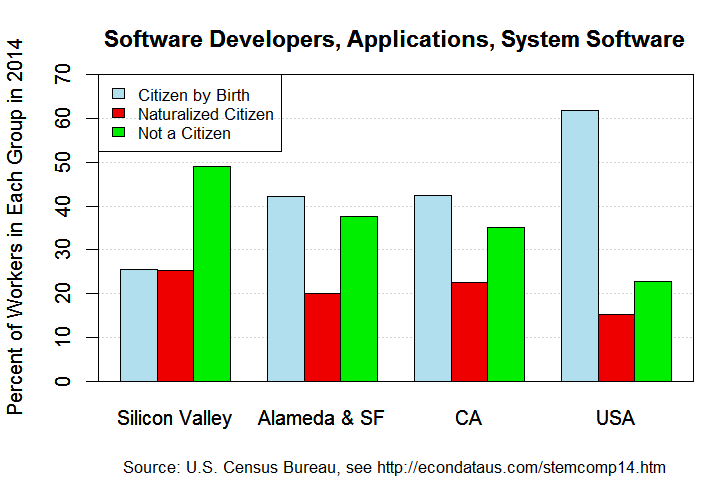
25.6 25.3 49.1 42.2 20.1 37.7 Software Developers, Applications and Systems Software (CMM)
31.9 35.9 32.2 60.3 22.0 17.7 Computer Programmers (CMM)
46.8 29.6 23.7 60.4 23.8 15.8 Other Computer and Mathematical (CMM)
---------- ---------- ---------- ---------- ---------- ---------- ----------
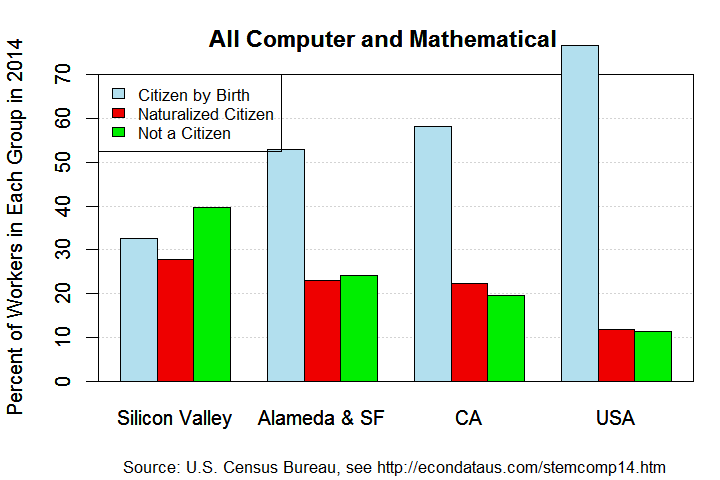
32.6 27.8 39.6 52.8 23.0 24.2 Total Computer and Mathematical (CMM & MGR)
36.4 37.1 26.5 64.9 18.3 16.8 Architectural and Engineering Managers (MGR)
39.1 36.4 24.5 51.5 30.7 17.8 Architectural and Engineering (ENG)
73.2 15.1 11.7 100.0 0.0 0.0 Natural Sciences Managers (MGR)
51.5 22.9 25.6 68.2 18.3 13.4 Life, physical, and social science (SCI)
81.5 12.8 5.8 67.2 20.5 12.3 Medical and Health Services Managers (MGR)
57.2 33.5 9.3 61.6 28.4 9.9 Medical and Health Services (MED & HLS)
63.3 28.8 7.9 64.2 26.1 9.7 Financial Managers (MGR)
48.6 38.4 13.0 58.9 31.9 9.2 Accountants and Auditors (FIN)
71.1 23.7 5.2 63.0 28.4 8.5 Other Financial (FIN)
61.5 25.1 13.4 73.3 15.7 11.0 Other Managers (MGR)
57.0 22.8 20.2 63.4 19.7 17.0 Other Workers
---------- ---------- ---------- ---------- ---------- ---------- ----------
54.2 25.3 20.6 63.2 20.8 16.1 TOTAL (all occupations)
Source: Integrated Public Use Microdata Series (IPUMS), United States Census Bureau
Create extract with variables STATEFIP, COUNTY, MET2013, PUMA, CITIZEN, EMPSTAT, and OCC.
The variables YEAR, DATANUM, SERIAL, HHWT, GQ, PERNUM, and PERWT are automatically preselected.
For samples, select ACS for 2014. For data format, select STATA. For structure, select rectangular.
For more information, see IPUMS Documentation: User's Guide
Note: Citizen by birth = born in U.S., Guam, Puerto Rico, U.S. Virgin Islands or
Northern Marianas, or born abroad of American parent(s);
Tables and plots generated with R source code linked below.
United States and California Workforce: 2014
            Employed Population by Citizenship Status, 2014

United States                        California
-----------------------------------  ----------------------------------
    Citizen  Naturalized      Not a     Citizen  Naturalized      Not a
   by birth     Citizen     Citizen    by birth     Citizen     Citizen  Occupation
 ----------  ----------  ----------  ----------  ----------  ----------  ----------
    441,878      64,532      43,054      43,393      16,496       7,043  Computer and Information Systems Managers (MGR)
    683,103     168,669     252,071      95,793      51,249      79,414  Software Developers, Applications and Systems Software (CMM)
    329,688      63,902      50,051      33,584      14,106       9,046  Computer Programmers (CMM)
  2,130,276     262,369     191,819     192,194      58,367      28,121  Other Computer and Mathematical (CMM)
 ----------  ----------  ----------  ----------  ----------  ----------  ----------
  3,584,945     559,472     536,995     364,964     140,218     123,624  Total Computer and Mathematical (CMM & MGR)
    117,628      19,192       9,582      14,929       6,063       3,098  Architectural and Engineering Managers (MGR)
  2,176,049     311,699     188,718     220,682      96,912      46,898  Architectural and Engineering (ENG)
     14,568       1,508         950       1,681         158          38  Natural Sciences Managers (MGR)
  1,017,212     132,487     139,218     129,080      31,187      27,241  Life, physical, and social science (SCI)
    557,527      58,110      16,553      51,798      13,408       3,331  Medical and Health Services Managers (MGR)
 10,218,893   1,402,472     575,421     812,093     313,794     102,740  Medical and Health Services (MED & HLS)
    969,500     107,948      47,635      93,011      26,174       9,345  Financial Managers (MGR)
  1,591,756     219,914      91,943     149,231      65,347      22,466  Accountants and Auditors (FIN)
  1,233,520     113,612      45,986     125,702      30,593       9,813  Other Financial (FIN)
 10,887,821     957,951     629,450   1,143,802     248,371     137,668  Other Managers (MGR)
 91,560,452   8,193,781  10,671,546   8,539,866   2,081,198   2,559,597  Other Workers
 ----------  ----------  ----------  ----------  ----------  ----------  ----------
123,929,871  12,078,146  12,953,997  11,646,839   3,053,423   3,045,859  TOTAL (all occupations)
===================================================================================
      Percent of Employed Population by Citizenship Status, 2014

United States                        California
-----------------------------------  ----------------------------------
    Citizen  Naturalized      Not a     Citizen  Naturalized      Not a
   by birth     Citizen     Citizen    by birth     Citizen     Citizen  Occupation
 ----------  ----------  ----------  ----------  ----------  ----------  ----------
       80.4        11.7         7.8        64.8        24.6        10.5  Computer and Information Systems Managers (MGR)
       61.9        15.3        22.8        42.3        22.6        35.1  Software Developers, Applications and Systems Software (CMM)
       74.3        14.4        11.3        59.2        24.9        15.9  Computer Programmers (CMM)
       82.4        10.2         7.4        69.0        20.9        10.1  Other Computer and Mathematical (CMM)
 ----------  ----------  ----------  ----------  ----------  ----------  ----------
       76.6        12.0        11.5        58.0        22.3        19.7  Total Computer and Mathematical (CMM & MGR)
       80.3        13.1         6.5        62.0        25.2        12.9  Architectural and Engineering Managers (MGR)
       81.3        11.6         7.1        60.5        26.6        12.9  Architectural and Engineering (ENG)
       85.6         8.9         5.6        89.6         8.4         2.0  Natural Sciences Managers (MGR)
       78.9        10.3        10.8        68.8        16.6        14.5  Life, physical, and social science (SCI)
       88.2         9.2         2.6        75.6        19.6         4.9  Medical and Health Services Managers (MGR)
       83.8        11.5         4.7        66.1        25.5         8.4  Medical and Health Services (MED & HLS)
       86.2         9.6         4.2        72.4        20.4         7.3  Financial Managers (MGR)
       83.6        11.6         4.8        63.0        27.6         9.5  Accountants and Auditors (FIN)
       88.5         8.2         3.3        75.7        18.4         5.9  Other Financial (FIN)
       87.3         7.7         5.0        74.8        16.2         9.0  Other Managers (MGR)
       82.9         7.4         9.7        64.8        15.8        19.4  Other Workers
 ----------  ----------  ----------  ----------  ----------  ----------  ----------
       83.2         8.1         8.7        65.6        17.2        17.2  TOTAL (all occupations)

Source: Integrated Public Use Microdata Series (IPUMS), United States Census Bureau
        Create extract with variables STATEFIP, COUNTY, MET2013, PUMA, CITIZEN, EMPSTAT, and OCC.
        The variables YEAR, DATANUM, SERIAL, HHWT, GQ, PERNUM, and PERWT are automatically preselected.
        For samples, select ACS for 2014. For data format, select STATA. For structure, select rectangular.
        For more information, see IPUMS Documentation: User's Guide
Note: Citizen by birth = born in U.S., Guam, Puerto Rico, U.S. Virgin Islands or
      Northern Marianas, or born abroad of American parent(s);
      Tables and plots generated with R source code linked below.