Texas Workforce: 2013
Employed Population by Citizenship Status, 2013
Austin-Round Rock Dallas-Fort Worth-Arlington
----------------------------------- ----------------------------------
Citizen Naturalized Not a Citizen Naturalized Not a
by birth Citizen Citizen by birth Citizen Citizen Occupation
---------- ---------- ---------- ---------- ---------- ---------- ----------
6,827 840 902 16,542 2,016 1,767 Computer and Information Systems Managers (MGR)
11,330 1,987 5,113 16,358 6,707 9,336 Software Developers, Applications and Systems Software (CMM)
3,949 622 384 9,703 1,912 2,314 Computer Programmers (CMM)
22,851 1,721 2,240 58,171 6,772 7,851 Other Computer and Mathematical (CMM)
---------- ---------- ---------- ---------- ---------- ---------- ----------
44,957 5,170 8,639 100,774 17,407 21,268 Total Computer and Mathematical (CMM & MGR)
896 199 0 2,137 1,185 433 Architectural and Engineering Managers (MGR)
17,274 2,459 4,284 50,259 9,291 7,213 Architectural and Engineering (ENG)
121 0 0 152 0 0 Natural Sciences Managers (MGR)
6,120 781 275 12,492 2,187 2,145 Life, physical, and social science (SCI)
3,839 202 0 9,130 1,984 683 Medical and Health Services Managers (MGR)
53,094 5,441 5,997 174,028 28,025 12,983 Medical and Health Services (MED & HLS)
8,445 250 373 29,700 1,812 1,638 Financial Managers (MGR)
12,888 1,174 490 50,150 5,626 3,906 Accountants and Auditors (FIN)
9,184 1,051 132 33,248 1,833 1,070 Other Financial (FIN)
85,649 6,353 3,776 248,337 19,254 20,308 Other Managers (MGR)
567,210 41,119 101,262 1,813,164 183,574 412,956 Other Workers
---------- ---------- ---------- ---------- ---------- ---------- ----------
809,677 64,199 125,228 2,523,571 272,178 484,603 TOTAL (all occupations)
==================================================================================
Percent of Employed Population by Citizenship Status, 2013
Austin-Round Rock Dallas-Fort Worth-Arlington
----------------------------------- ----------------------------------
Citizen Naturalized Not a Citizen Naturalized Not a
by birth Citizen Citizen by birth Citizen Citizen Occupation
---------- ---------- ---------- ---------- ---------- ---------- ----------
79.7 9.8 10.5 81.4 9.9 8.7 Computer and Information Systems Managers (MGR)
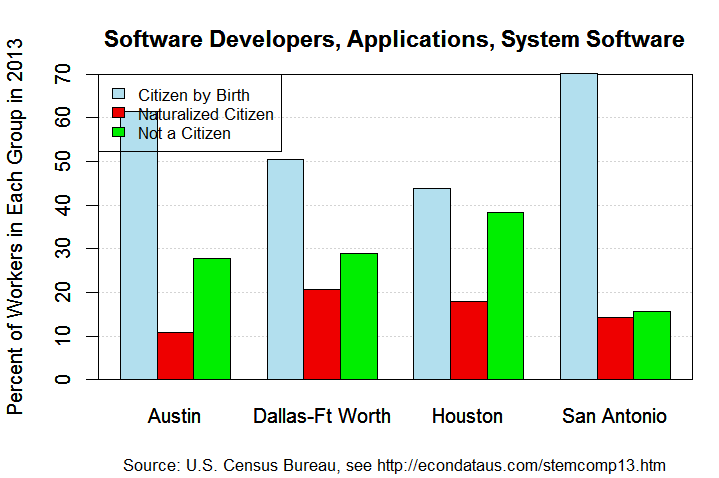
61.5 10.8 27.7 50.5 20.7 28.8 Software Developers, Applications and Systems Software (CMM)
79.7 12.6 7.7 69.7 13.7 16.6 Computer Programmers (CMM)
85.2 6.4 8.4 79.9 9.3 10.8 Other Computer and Mathematical (CMM)
---------- ---------- ---------- ---------- ---------- ---------- ----------
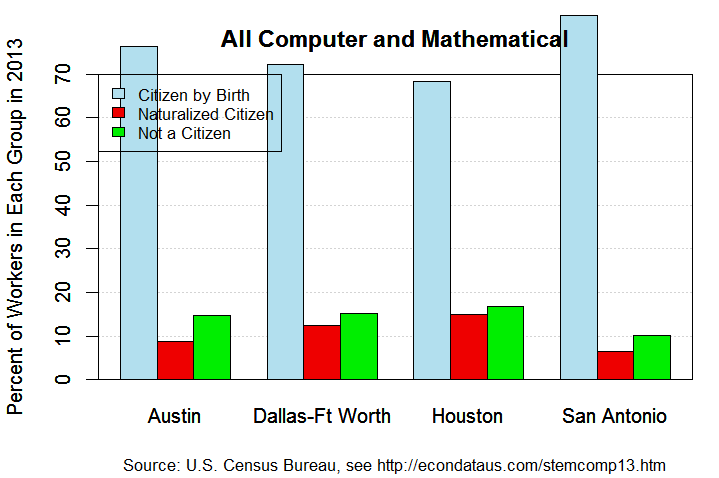
76.5 8.8 14.7 72.3 12.5 15.3 Total Computer and Mathematical (CMM & MGR)
81.8 18.2 0.0 56.9 31.6 11.5 Architectural and Engineering Managers (MGR)
71.9 10.2 17.8 75.3 13.9 10.8 Architectural and Engineering (ENG)
100.0 0.0 0.0 100.0 0.0 0.0 Natural Sciences Managers (MGR)
85.3 10.9 3.8 74.3 13.0 12.7 Life, physical, and social science (SCI)
95.0 5.0 0.0 77.4 16.8 5.8 Medical and Health Services Managers (MGR)
82.3 8.4 9.3 80.9 13.0 6.0 Medical and Health Services (MED & HLS)
93.1 2.8 4.1 89.6 5.5 4.9 Financial Managers (MGR)
88.6 8.1 3.4 84.0 9.4 6.5 Accountants and Auditors (FIN)
88.6 10.1 1.3 92.0 5.1 3.0 Other Financial (FIN)
89.4 6.6 3.9 86.3 6.7 7.1 Other Managers (MGR)
79.9 5.8 14.3 75.2 7.6 17.1 Other Workers
---------- ---------- ---------- ---------- ---------- ---------- ----------
81.0 6.4 12.5 76.9 8.3 14.8 TOTAL (all occupations)
Source: Integrated Public Use Microdata Series (IPUMS), United States Census Bureau
Create extract with variables STATEFIP, COUNTY, MET2013, PUMA, CITIZEN, EMPSTAT, and OCC.
The variables YEAR, DATANUM, SERIAL, HHWT, GQ, PERNUM, and PERWT are automatically preselected.
For samples, select ACS for 2013. For data format, select STATA. For structure, select rectangular.
For more information, see IPUMS Documentation: User's Guide
Note: Citizen by birth = born in U.S., Guam, Puerto Rico, U.S. Virgin Islands or
Northern Marianas, or born abroad of American parent(s);
Tables and plots generated with R source code linked below.
Texas Workforce: 2013
            Employed Population by Citizenship Status, 2013

Houston-The Woodlands-Sugar Land     San Antonio-New Braunfels
-----------------------------------  ----------------------------------
    Citizen  Naturalized      Not a     Citizen  Naturalized      Not a
   by birth     Citizen     Citizen    by birth     Citizen     Citizen  Occupation
 ----------  ----------  ----------  ----------  ----------  ----------  ----------
      9,721       1,679         934       2,660          50         357  Computer and Information Systems Managers (MGR)
      7,501       3,047       6,569       3,417         694         758  Software Developers, Applications and Systems Software (CMM)
      5,118       1,769       1,021       2,579          93         526  Computer Programmers (CMM)
     35,350       6,043       5,568      17,532       1,186       1,496  Other Computer and Mathematical (CMM)
 ----------  ----------  ----------  ----------  ----------  ----------  ----------
     57,690      12,538      14,092      26,188       2,023       3,137  Total Computer and Mathematical (CMM & MGR)
      4,382         396       1,092         281           0           0  Architectural and Engineering Managers (MGR)
     63,483      13,637      12,014      11,964       1,439         327  Architectural and Engineering (ENG)
          0           0         201           0           0           0  Natural Sciences Managers (MGR)
     21,081       4,772       8,837       5,629         211         225  Life, physical, and social science (SCI)
     13,597       2,639          50       5,301         305           0  Medical and Health Services Managers (MGR)
    157,349      36,902      14,390      73,561       6,368       3,235  Medical and Health Services (MED & HLS)
     19,590       2,277       2,547       7,719         317           0  Financial Managers (MGR)
     42,669       9,576       3,735      12,127       1,308         149  Accountants and Auditors (FIN)
     19,859       2,590         879       8,497         494         468  Other Financial (FIN)
    193,108      29,006      25,308      63,706       3,008       3,724  Other Managers (MGR)
  1,477,064     234,757     468,316     664,912      41,554      76,054  Other Workers
 ----------  ----------  ----------  ----------  ----------  ----------  ----------
  2,069,872     349,090     551,461     879,885      57,027      87,319  TOTAL (all occupations)
===================================================================================
      Percent of Employed Population by Citizenship Status, 2013

Houston-The Woodlands-Sugar Land     San Antonio-New Braunfels
-----------------------------------  ----------------------------------
    Citizen  Naturalized      Not a     Citizen  Naturalized      Not a
   by birth     Citizen     Citizen    by birth     Citizen     Citizen  Occupation
 ----------  ----------  ----------  ----------  ----------  ----------  ----------
       78.8        13.6         7.6        86.7         1.6        11.6  Computer and Information Systems Managers (MGR)
       43.8        17.8        38.4        70.2        14.3        15.6  Software Developers, Applications and Systems Software (CMM)
       64.7        22.4        12.9        80.6         2.9        16.4  Computer Programmers (CMM)
       75.3        12.9        11.9        86.7         5.9         7.4  Other Computer and Mathematical (CMM)
 ----------  ----------  ----------  ----------  ----------  ----------  ----------
       68.4        14.9        16.7        83.5         6.5        10.0  Total Computer and Mathematical (CMM & MGR)
       74.7         6.7        18.6       100.0         0.0         0.0  Architectural and Engineering Managers (MGR)
       71.2        15.3        13.5        87.1        10.5         2.4  Architectural and Engineering (ENG)
        0.0         0.0       100.0         NaN         NaN         NaN  Natural Sciences Managers (MGR)
       60.8        13.8        25.5        92.8         3.5         3.7  Life, physical, and social science (SCI)
       83.5        16.2         0.3        94.6         5.4         0.0  Medical and Health Services Managers (MGR)
       75.4        17.7         6.9        88.5         7.7         3.9  Medical and Health Services (MED & HLS)
       80.2         9.3        10.4        96.1         3.9         0.0  Financial Managers (MGR)
       76.2        17.1         6.7        89.3         9.6         1.1  Accountants and Auditors (FIN)
       85.1        11.1         3.8        89.8         5.2         4.9  Other Financial (FIN)
       78.0        11.7        10.2        90.4         4.3         5.3  Other Managers (MGR)
       67.8        10.8        21.5        85.0         5.3         9.7  Other Workers
 ----------  ----------  ----------  ----------  ----------  ----------  ----------
       69.7        11.8        18.6        85.9         5.6         8.5  TOTAL (all occupations)

Source: Integrated Public Use Microdata Series (IPUMS), United States Census Bureau
        Create extract with variables STATEFIP, COUNTY, MET2013, PUMA, CITIZEN, EMPSTAT, and OCC.
        The variables YEAR, DATANUM, SERIAL, HHWT, GQ, PERNUM, and PERWT are automatically preselected.
        For samples, select ACS for 2013. For data format, select STATA. For structure, select rectangular.
        For more information, see IPUMS Documentation: User's Guide
Note: Citizen by birth = born in U.S., Guam, Puerto Rico, U.S. Virgin Islands or
      Northern Marianas, or born abroad of American parent(s);
      Tables and plots generated with R source code linked below.
Source code for acs_stem.R (common code for creating htm and pngs)
Source code for acs_stem_sv13.R (specific code for Silicon Valley)
Source code for acs_stem_tx13.R (specific code for Texas)
Silicon Valley Workforce Statistics
Information on H-1B Visas
Commentary on the Skills Gap
Go to Budget Home Page