Employed Population by Citizenship Status, 2013
Silicon Valley Area San Francisco Area
----------------------------------- ----------------------------------
Santa Clara & San Mateo counties Alameda & San Francisco counties
----------------------------------- ----------------------------------
Citizen Naturalized Not a Citizen Naturalized Not a
by birth Citizen Citizen by birth Citizen Citizen Occupation
---------- ---------- ---------- ---------- ---------- ---------- ----------
5,078 4,133 2,662 4,910 1,750 1,634 Computer and Information Systems Managers (MGR)
18,465 17,371 29,740 15,544 8,424 14,692 Software Developers, Applications and Systems Software (CMM)
4,069 2,701 1,839 3,370 1,522 1,808 Computer Programmers (CMM)
16,660 8,032 8,037 23,173 5,874 3,253 Other Computer and Mathematical (CMM)
---------- ---------- ---------- ---------- ---------- ---------- ----------
44,272 32,237 42,278 46,997 17,570 21,387 Total Computer and Mathematical (CMM & MGR)
3,443 3,159 1,216 1,388 673 285 Architectural and Engineering Managers (MGR)
26,681 25,970 14,487 21,651 12,376 7,280 Architectural and Engineering (ENG)
39 128 88 342 37 0 Natural Sciences Managers (MGR)
10,951 5,337 4,504 16,957 4,807 4,275 Life, physical, and social science (SCI)
3,043 1,234 155 3,514 488 114 Medical and Health Services Managers (MGR)
45,616 31,872 7,780 49,408 24,950 7,724 Medical and Health Services (MED & HLS)
6,851 3,958 1,164 7,433 2,133 1,458 Financial Managers (MGR)
14,084 9,320 3,169 14,819 9,888 2,516 Accountants and Auditors (FIN)
7,422 2,635 1,356 9,655 3,216 1,042 Other Financial (FIN)
85,947 33,432 16,668 90,625 21,346 11,377 Other Managers (MGR)
458,536 185,222 167,645 520,223 167,807 144,340 Other Workers
---------- ---------- ---------- ---------- ---------- ---------- ----------
706,885 334,504 260,510 783,012 265,291 201,798 TOTAL (all occupations)
==================================================================================
Percent of Employed Population by Citizenship Status, 2013
Silicon Valley Area San Francisco Area
----------------------------------- ----------------------------------
Santa Clara & San Mateo counties Alameda & San Francisco counties
----------------------------------- ----------------------------------
Citizen Naturalized Not a Citizen Naturalized Not a
by birth Citizen Citizen by birth Citizen Citizen Occupation
---------- ---------- ---------- ---------- ---------- ---------- ----------
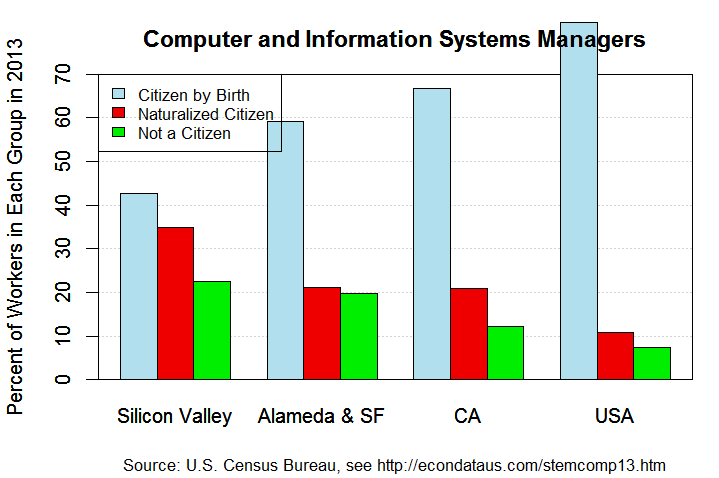
42.8 34.8 22.4 59.2 21.1 19.7 Computer and Information Systems Managers (MGR)
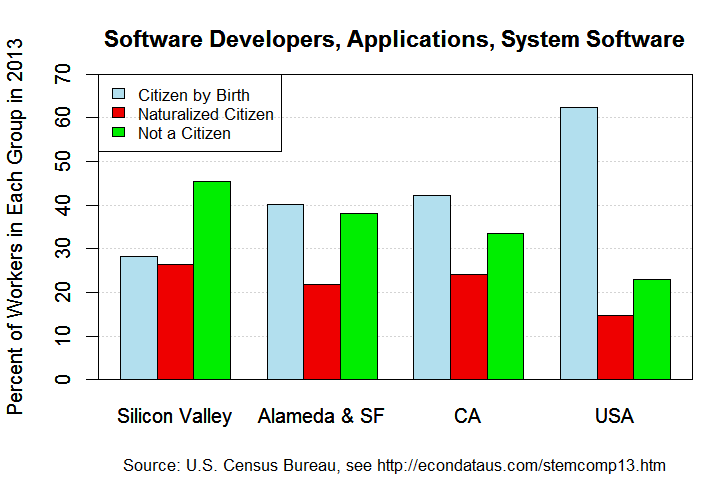
28.2 26.5 45.4 40.2 21.8 38.0 Software Developers, Applications and Systems Software (CMM)
47.3 31.4 21.4 50.3 22.7 27.0 Computer Programmers (CMM)
50.9 24.5 24.6 71.7 18.2 10.1 Other Computer and Mathematical (CMM)
---------- ---------- ---------- ---------- ---------- ---------- ----------
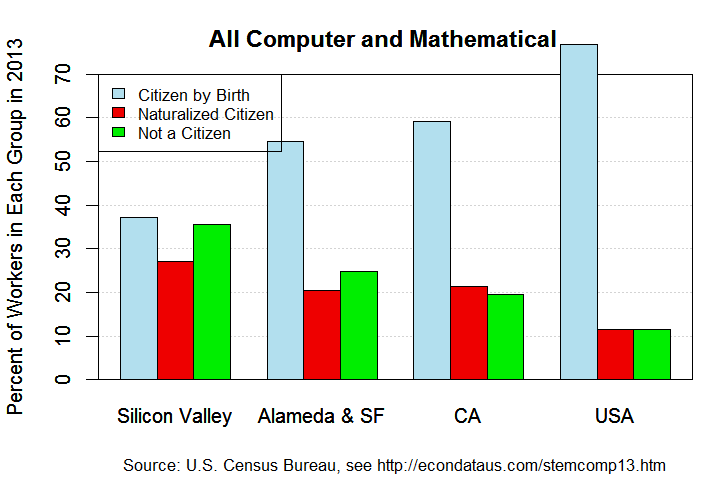
37.3 27.1 35.6 54.7 20.4 24.9 Total Computer and Mathematical (CMM & MGR)
44.0 40.4 15.6 59.2 28.7 12.1 Architectural and Engineering Managers (MGR)
39.7 38.7 21.6 52.4 30.0 17.6 Architectural and Engineering (ENG)
15.3 50.2 34.5 90.2 9.8 0.0 Natural Sciences Managers (MGR)
52.7 25.7 21.7 65.1 18.5 16.4 Life, physical, and social science (SCI)
68.7 27.8 3.5 85.4 11.9 2.8 Medical and Health Services Managers (MGR)
53.5 37.4 9.1 60.2 30.4 9.4 Medical and Health Services (MED & HLS)
57.2 33.1 9.7 67.4 19.3 13.2 Financial Managers (MGR)
53.0 35.1 11.9 54.4 36.3 9.2 Accountants and Auditors (FIN)
65.0 23.1 11.9 69.4 23.1 7.5 Other Financial (FIN)
63.2 24.6 12.3 73.5 17.3 9.2 Other Managers (MGR)
56.5 22.8 20.7 62.5 20.2 17.3 Other Workers
---------- ---------- ---------- ---------- ---------- ---------- ----------
54.3 25.7 20.0 62.6 21.2 16.1 TOTAL (all occupations)
Source: Integrated Public Use Microdata Series (IPUMS), United States Census Bureau
Create extract with variables STATEFIP, COUNTY, MET2013, PUMA, CITIZEN, EMPSTAT, and OCC.
The variables YEAR, DATANUM, SERIAL, HHWT, GQ, PERNUM, and PERWT are automatically preselected.
For samples, select ACS for 2013. For data format, select STATA. For structure, select rectangular.
For more information, see IPUMS Documentation: User's Guide
Note: Citizen by birth = born in U.S., Guam, Puerto Rico, U.S. Virgin Islands or
Northern Marianas, or born abroad of American parent(s);
Tables and plots generated with R source code linked below.
United States and California Workforce: 2013
            Employed Population by Citizenship Status, 2013

United States                        California
-----------------------------------  ----------------------------------
    Citizen  Naturalized      Not a     Citizen  Naturalized      Not a
   by birth     Citizen     Citizen    by birth     Citizen     Citizen  Occupation
 ----------  ----------  ----------  ----------  ----------  ----------  ----------
    434,048      57,539      38,833      41,572      13,024       7,572  Computer and Information Systems Managers (MGR)
    651,172     153,066     238,824      82,020      46,946      64,988  Software Developers, Applications and Systems Software (CMM)
    332,341      57,950      48,970      33,052      11,563       9,891  Computer Programmers (CMM)
  1,979,834     243,103     180,095     187,141      51,804      30,112  Other Computer and Mathematical (CMM)
 ----------  ----------  ----------  ----------  ----------  ----------  ----------
  3,397,395     511,658     506,722     343,785     123,337     112,563  Total Computer and Mathematical (CMM & MGR)
    114,088      19,532       9,367      12,947       7,212       3,055  Architectural and Engineering Managers (MGR)
  2,174,071     308,420     193,798     225,196     103,415      49,541  Architectural and Engineering (ENG)
     15,336       2,643       1,882       1,403         835         389  Natural Sciences Managers (MGR)
    982,481     125,630     137,382     113,686      31,270      23,335  Life, physical, and social science (SCI)
    537,048      56,043      17,007      49,123      12,354       3,032  Medical and Health Services Managers (MGR)
  9,963,522   1,360,329     592,065     764,846     302,700     102,225  Medical and Health Services (MED & HLS)
    937,461      97,059      47,452      89,919      24,747       8,848  Financial Managers (MGR)
  1,677,108     233,961      92,430     156,009      68,162      19,533  Accountants and Auditors (FIN)
  1,099,000      93,066      42,376     111,040      28,537       8,050  Other Financial (FIN)
 10,468,530     881,325     597,408   1,095,614     238,829     132,542  Other Managers (MGR)
 90,567,060   7,920,122  10,443,313   8,345,356   2,044,228   2,518,590  Other Workers
-----------  ----------  ----------  ----------  ----------  ----------  ----------
121,933,100  11,609,788  12,681,202  11,308,924   2,985,626   2,981,703  TOTAL (all occupations)
===================================================================================
      Percent of Employed Population by Citizenship Status, 2013

United States                        California
-----------------------------------  ----------------------------------
    Citizen  Naturalized      Not a     Citizen  Naturalized      Not a
   by birth     Citizen     Citizen    by birth     Citizen     Citizen  Occupation
 ----------  ----------  ----------  ----------  ----------  ----------  ----------
       81.8        10.8         7.3        66.9        20.9        12.2  Computer and Information Systems Managers (MGR)
       62.4        14.7        22.9        42.3        24.2        33.5  Software Developers, Applications and Systems Software (CMM)
       75.7        13.2        11.1        60.6        21.2        18.1  Computer Programmers (CMM)
       82.4        10.1         7.5        69.6        19.3        11.2  Other Computer and Mathematical (CMM)
 ----------  ----------  ----------  ----------  ----------  ----------  ----------
       76.9        11.6        11.5        59.3        21.3        19.4  Total Computer and Mathematical (CMM & MGR)
       79.8        13.7         6.6        55.8        31.1        13.2  Architectural and Engineering Managers (MGR)
       81.2        11.5         7.2        59.6        27.3        13.1  Architectural and Engineering (ENG)
       77.2        13.3         9.5        53.4        31.8        14.8  Natural Sciences Managers (MGR)
       78.9        10.1        11.0        67.6        18.6        13.9  Life, physical, and social science (SCI)
       88.0         9.2         2.8        76.1        19.2         4.7  Medical and Health Services Managers (MGR)
       83.6        11.4         5.0        65.4        25.9         8.7  Medical and Health Services (MED & HLS)
       86.6         9.0         4.4        72.8        20.0         7.2  Financial Managers (MGR)
       83.7        11.7         4.6        64.0        28.0         8.0  Accountants and Auditors (FIN)
       89.0         7.5         3.4        75.2        19.3         5.5  Other Financial (FIN)
       87.6         7.4         5.0        74.7        16.3         9.0  Other Managers (MGR)
       83.1         7.3         9.6        64.7        15.8        19.5  Other Workers
 ----------  ----------  ----------  ----------  ----------  ----------  ----------
       83.4         7.9         8.7        65.5        17.3        17.3  TOTAL (all occupations)

Source: Integrated Public Use Microdata Series (IPUMS), United States Census Bureau
        Create extract with variables STATEFIP, COUNTY, MET2013, PUMA, CITIZEN, EMPSTAT, and OCC.
        The variables YEAR, DATANUM, SERIAL, HHWT, GQ, PERNUM, and PERWT are automatically preselected.
        For samples, select ACS for 2013. For data format, select STATA. For structure, select rectangular.
        For more information, see IPUMS Documentation: User's Guide
Note: Citizen by birth = born in U.S., Guam, Puerto Rico, U.S. Virgin Islands or
      Northern Marianas, or born abroad of American parent(s);
      Tables and plots generated with R source code linked below.