The analysis at http://econdataus.com/amjobs1.htm looked at a specific claim made in a study titled "Immigration and American Jobs", written by economist Madeline Zavodny and published by the American Enterprise Institute and the Partnership For A New American Economy. The claim is made on page 4 of the study as follows:
During 2000– 2007, a 10 percent increase in the share of such workers boosted the US-born employment rate by 0.04 percent. Evaluating this at the average numbers of foreign- and US-born workers during that period, this implies that every additional 100 foreign- born workers who earned an advanced degree in the United States and then worked in STEM fields led to an additional 262 jobs for US natives. (See Table 2)
The prior analysis came to a number of conclusions, including the following:
This paper uses data from the US Census Bureau’s Current Population Survey (CPS) covering all fifty states and the District of Columbia, focusing on the periods 2000–2007 and 2000–2010. The former represents a period of economic recovery and growth while the latter period includes the recent recession, during which the US-born employment rate fell by more than two percentage points. The analysis begins in 2000 to avoid including the hightech bubble of the late 1990s.
In fact, the claim being looked at comes from the period 2000-2007. However, there is now data available through 2013 which includes several years of recovery. Hence, it would be instructive to update the data through 2013. Unfortunately, the prior analysis used the author's data file which only includes data through 2010. In addition, that data file only contains the data needed to calculate the author's version of the employment rate and contains no missing values as they appear to have been converted to zeroes when the file was created. Hence, there is no way to modify these values using the author's data.
20. Replicating and Extending the Study's Data
Fortunately, the study does state in note 28 on page 23 that the data are from http://nber.org/morg/annual (accessed March 17, 2011). In addition, the author supplied the executable files with which she extracted her data from the original data files. Using that information, I've been able to almost exactly replicate the author's data using the original data files. This is important in that it verifies the author's data. However, it is also important in that it allows the data to be updated and for additional variables to be derived.
The R program used to replicate the author's data for the 2000-2007 period can be found at http://econdataus.com/morg07R.htm. Following is the output from the program in bold with comments added:
> source("morg07.R")
[1] "START READ OF morg00.dta"
[1] "PROCESS morg00.dta"
[1] " 237059 TOTAL ROWS"
[1] "    987 NAs in emp"
[1] "  46002 NAs in stem"
[1] "    987 NAs in lfsr94"
[1] "    987 NAs in stem, lfsr94==NA"
[1] "    513 NAs in stem, lfsr94==4 (Unemployed-Looking)"
[1] "   8655 NAs in stem, lfsr94==5 (Retired-Not In Labor Force)"
[1] "   9538 NAs in stem, lfsr94==6 (Disabled-Not In Labor Force)"
[1] "  26309 NAs in stem, lfsr94==7 (Other-Not In Labor Force)"
The above output is from reading the MORG (Merged Outgoing Rotation Groups) file for year 2000 from the CPS data. As explained at this link, the CPS data comes from a monthly household survey of 50-60,000 households. The data is weighted so that all the persons in the sample sum to the total population 16 years of age or greater. But only one fourth of the sample is in an outgoing rotation group. So 12 months of data sums to three times the total population.
As can be seen, there were 237,059 total records for 2000. Underneath that is listed the number of NAs (missing data points) for all of the variables derived from the CPS data for the study that had one or more missing data points. In this case, just emp (employed) and stem had missing data. The number of NAs in the CPS variable lfsr94 is also listed because emp is derived from it. The fact that they are equal shows that these NAs are in the same rows as the emp NAs. The NAs in stem are then broken down by the values of lfsr94. As can be seen, all NAs in stem corresponded to values of lfsr94 that were missing or between 4 and 7. They did not correspond to any values of lfsr94 equal to 1 (Employed-At Work), 2 (Employed-Absent), or 3 (Unemployed-On Layoff). In any case, the following output shows similar output for the reading of the MORG file for 2001 (morg01.dta) through 2007 (morg07.dta):
[1] "START READ OF morg01.dta"
[1] "PROCESS morg01.dta"
[1] " 253569 TOTAL ROWS"
[1] "   1083 NAs in emp"
[1] "  49385 NAs in stem"
[1] "   1083 NAs in lfsr94"
[1] "   1083 NAs in stem, lfsr94==NA"
[1] "    560 NAs in stem, lfsr94==4 (Unemployed-Looking)"
[1] "   9386 NAs in stem, lfsr94==5 (Retired-Not In Labor Force)"
[1] "  10242 NAs in stem, lfsr94==6 (Disabled-Not In Labor Force)"
[1] "  28114 NAs in stem, lfsr94==7 (Other-Not In Labor Force)"
[1] "START READ OF morg02.dta"
[1] "PROCESS morg02.dta"
[1] " 275892 TOTAL ROWS"
[1] "   1295 NAs in emp"
[1] "  55179 NAs in stem"
[1] "   1295 NAs in lfsr94"
[1] "   1295 NAs in stem, lfsr94==NA"
[1] "    681 NAs in stem, lfsr94==4 (Unemployed-Looking)"
[1] "  10116 NAs in stem, lfsr94==5 (Retired-Not In Labor Force)"
[1] "  11543 NAs in stem, lfsr94==6 (Disabled-Not In Labor Force)"
[1] "  31544 NAs in stem, lfsr94==7 (Other-Not In Labor Force)"
[1] "START READ OF morg03.dta"
[1] "PROCESS morg03.dta"
[1] " 274965 TOTAL ROWS"
[1] "   1314 NAs in emp"
[1] "  57385 NAs in stem"
[1] "   1314 NAs in lfsr94"
[1] "   1314 NAs in stem, lfsr94==NA"
[1] "    809 NAs in stem, lfsr94==4 (Unemployed-Looking)"
[1] "  10459 NAs in stem, lfsr94==5 (Retired-Not In Labor Force)"
[1] "  12085 NAs in stem, lfsr94==6 (Disabled-Not In Labor Force)"
[1] "  32718 NAs in stem, lfsr94==7 (Other-Not In Labor Force)"
[1] "START READ OF morg04.dta"
[1] "PROCESS morg04.dta"
[1] " 270181 TOTAL ROWS"
[1] "   1393 NAs in emp"
[1] "  57319 NAs in stem"
[1] "   1393 NAs in lfsr94"
[1] "   1393 NAs in stem, lfsr94==NA"
[1] "    804 NAs in stem, lfsr94==4 (Unemployed-Looking)"
[1] "  10411 NAs in stem, lfsr94==5 (Retired-Not In Labor Force)"
[1] "  12430 NAs in stem, lfsr94==6 (Disabled-Not In Labor Force)"
[1] "  32281 NAs in stem, lfsr94==7 (Other-Not In Labor Force)"
[1] "START READ OF morg05.dta"
[1] "PROCESS morg05.dta"
[1] " 269864 TOTAL ROWS"
[1] "   1415 NAs in emp"
[1] "  57136 NAs in stem"
[1] "      3 NAs in ageimmig"
[1] "      1 NAs in educus"
[1] "   1415 NAs in lfsr94"
[1] "   1415 NAs in stem, lfsr94==NA"
[1] "    798 NAs in stem, lfsr94==4 (Unemployed-Looking)"
[1] "  10319 NAs in stem, lfsr94==5 (Retired-Not In Labor Force)"
[1] "  12609 NAs in stem, lfsr94==6 (Disabled-Not In Labor Force)"
[1] "  31995 NAs in stem, lfsr94==7 (Other-Not In Labor Force)"
[1] "START READ OF morg06.dta"
[1] "PROCESS morg06.dta"
[1] " 267694 TOTAL ROWS"
[1] "   1324 NAs in emp"
[1] "  56933 NAs in stem"
[1] "   1324 NAs in lfsr94"
[1] "   1324 NAs in stem, lfsr94==NA"
[1] "    728 NAs in stem, lfsr94==4 (Unemployed-Looking)"
[1] "  10331 NAs in stem, lfsr94==5 (Retired-Not In Labor Force)"
[1] "  12363 NAs in stem, lfsr94==6 (Disabled-Not In Labor Force)"
[1] "  32187 NAs in stem, lfsr94==7 (Other-Not In Labor Force)"
[1] "START READ OF morg07.dta"
[1] "PROCESS morg07.dta"
[1] " 265016 TOTAL ROWS"
[1] "   1262 NAs in emp"
[1] "  57031 NAs in stem"
[1] "   1262 NAs in lfsr94"
[1] "   1262 NAs in stem, lfsr94==NA"
[1] "    734 NAs in stem, lfsr94==4 (Unemployed-Looking)"
[1] "  10239 NAs in stem, lfsr94==5 (Retired-Not In Labor Force)"
[1] "  12455 NAs in stem, lfsr94==6 (Disabled-Not In Labor Force)"
[1] "  32341 NAs in stem, lfsr94==7 (Other-Not In Labor Force)"
[1] "ALL MORG FILE READ"
As can be seen, the data for each year was surprisingly similar, at least according to the output. Each year has a similar number of rows and NAs in emp and stem. In fact, even the number of rows in the breakdown of NAs in stem by lfsr94 look to be similar. One minor exception is that in 2005, ageimmig and educus have 3 and 1 NAs, respectively whereas they have no NAs in the other years.
21. Source of Missing Values that were Converted to Zero
In order to duplicate the author's data, it was found to be necessary to set all of the stem NAs to zero. This is likely not a huge problem since the great majority of these NAs are not in the labor force. Still, it is a point to remember. In any case, the output continues below to a list of the number of NAs in all of the final variables that were in the author's data file:
[1] "START OF AGGREGATE AND MERGE INTO FINAL FILES"
[1] "    408 : TOTAL ROWS"
[1] "     64 : pop_nedus_stem_grad"
[1] "     78 : emp_nedus_stem_grad"
[1] "     37 : pop_nedus_stem_coll"
[1] "     45 : emp_nedus_stem_coll"
[1] "     92 : pop_edus_stem_grad"
[1] "    103 : emp_edus_stem_grad"
[1] "     60 : pop_edus_stem_coll"
[1] "     68 : emp_edus_stem_coll"
[1] "      4 : pop_nedus_grad"
[1] "      6 : pop_edus_grad"
[1] "     10 : emp_nedus_grad"
[1] "     12 : emp_edus_grad"
[1] "      1 : emp_nedus_coll"
[1] "      2 : emp_edus_coll"
[1] "      4 : emp_immig_grad"
[1] "      1 : pop_immig_grad"
[1] "    587 : TOTAL MISSING"
[1] ""
In red is the one of the four variables that the author used to compute the claim in question that had missing values (NAs). As can be seen, there were 103 NAs for emp_edus_stem_grad, the same number mentioned in the prior analysis. These 103 NAs mean that 103 of the 408 data points (8 years multiplied by 50 states plus D.C.) had no samples that fell in the category of emp_edus_stem_grad (foreign-born workers who earned an advanced degree in the United States and then worked in STEM fields). One could argue that it therefore makes sense to set these missing values to zero. However, there is one problem with this. Zero is the absolute lowest possible number for the actual number of such workers whereas the estimates based on existing samples are probably as likely to be high as to be low. Hence, it may make sense to either drop these data points or come up with a better estimate. As there is no easy way to compute a better estimate, it's likely best to just drop these samples. In order to duplicate the author's numbers, however, it was found to be necessary to set these value to zero.
22. Comparison of Extracted Data to Study's Data
The following output then shows the number of data points that differed signicantly (by more than a tenth of a percent) from the author's data:
[1] "    MAX    408 : TOTAL ROWS"
[1] "405.814      1 : pop_nedus_stem_coll"
[1] "405.814      1 : pop_edus_stem_coll"
[1] "1129.25      1 : pop_nedus_grad"
[1] "1129.25      1 : pop_edus_grad"
[1] "1129.25      4 : pop_nedus_coll"
[1] "1129.25      4 : pop_edus_coll"
[1] "1129.25      1 : emp_nedus_grad"
[1] "1129.25      1 : emp_edus_grad"
[1] "1129.25      3 : emp_nedus_coll"
[1] "1129.25      3 : emp_edus_coll"
[1] "1136.34      1 : emp_native_coll"
[1] "1136.34      1 : emp_total_coll"
[1] "1136.34      1 : emp_native"
[1] "1136.34      1 : emp_total"
[1] "1136.34      1 : pop_native_coll"
[1] "1136.34      1 : pop_native"
[1] "1136.34      1 : pop_total"
[1] "1136.34     27 : TOTAL DIFFERENCES"
[1] "CREATE FINAL FILES morg07.txt and morg07.csv"
>
In red are the three out of four variables that the author used to compute the claim in question that differed from the author's data. In fact, the difference in all three appear to have been the same point which differed by 1136.34. This was likely a missing value in the author's data which has since been updated. In any case, the last line indicates that the data has been saved in the space-delimited file morg07.txt and the comma-delimited file morg07.csv.
23. Output Using Extracted Data instead of Author's Data
The minimal difference of one point causes all of the following values to be calculated to be nearly identical. Following is the output of the R program amjobs07.R which is identical to amjobs.R except that it reads data from morg07.txt instead of the author's data file.
> source("amjobs07.R")
[1] "dim(dd10) and dim(dd)"
[1] 408 36
[1] 408 36
[1] "ADDITIONAL JOBS AMONG US NATIVE CREATED BY 100 FOREIGN-BORN WORKERS IN..."
[1] " 262.9854 STEM fields with advanced degrees from US universities"
[1] " 86.1244 STEM fields with advanced degrees from any universities"
[1] " 44.4545 any field with advanced degrees from any universities"
[1] "dim(ddnz) and dim(ddz1)"
[1] 305 40
[1] 408 40
[1] "dim(ddca)"
[1] 8 40
[1] "Minimum non-zero count of foreign-born workers in STEM fields with advanced degrees from US universities"
[1] 73.52493
[1] " CORREL "
[1] "INTERCEPT SLOPE COEF P-VALUE Y VARIABLE ~ X VARIABLE [, WEIGHTS]"
[1] "--------- -------- ------- ------- -----------------------------------"
[1] "2000-2007, ALL DATA"
[1] " 65.2319 1.0080 0.0310 0.5326 emprate_native ~ immshare_emp_stem_e_grad"
[1] "2000-2007, EXCLUDING POINTS WITH ZERO FOREIGN WORKERS IN STEM WITH ADVANCED US DEGREES"
[1] " 65.9622 -2.4104 -0.0774 0.1776 emprate_native ~ immshare_emp_stem_e_grad"
[1] " 4.1709 -0.0053 -0.0796 0.1653 lnemprate_native ~ lnimmshare_emp_stem_e_grad"
[1] " 4.1436 -0.0130 -0.0796 0.0002 lnemprate_native ~ lnimmshare_emp_stem_e_grad, weights=weight_native"
[1] "2000-2007, FOR VALUES OF ZERO FOREIGN WORKERS IN STEM, CHANGE ZERO TO ONE"
[1] " 65.2318 1.0083 0.0310 0.5327 emprate_native ~ immshare_emp_stem_e_grad"
[1] " 4.1888 0.0027 0.1521 0.0021 lnemprate_native ~ lnimmshare_emp_stem_e_grad"
[1] " 4.1724 0.0006 0.1521 0.4884 lnemprate_native ~ lnimmshare_emp_stem_e_grad, weights=weight_native"
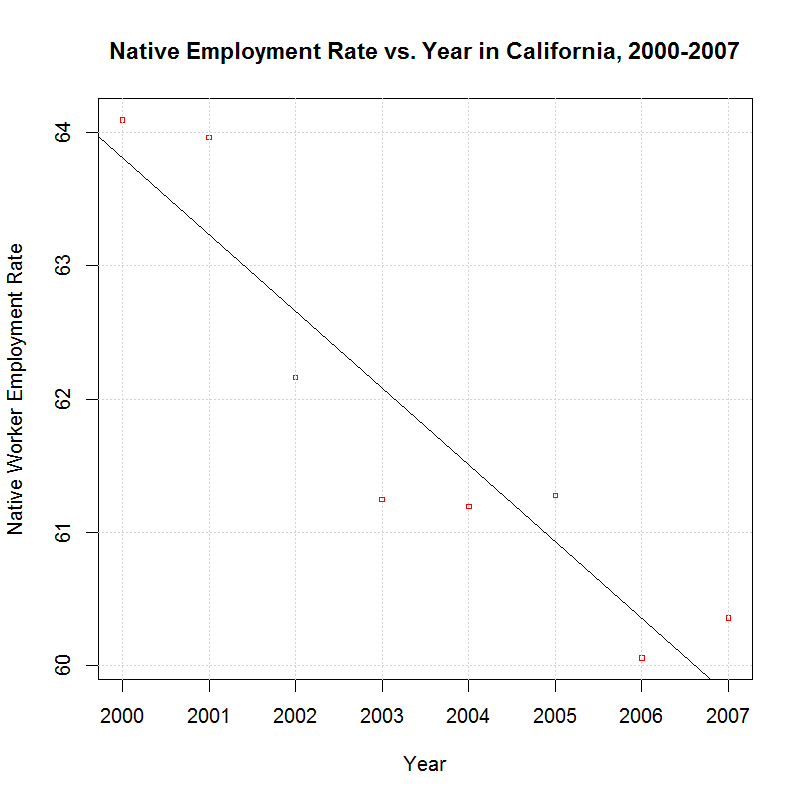
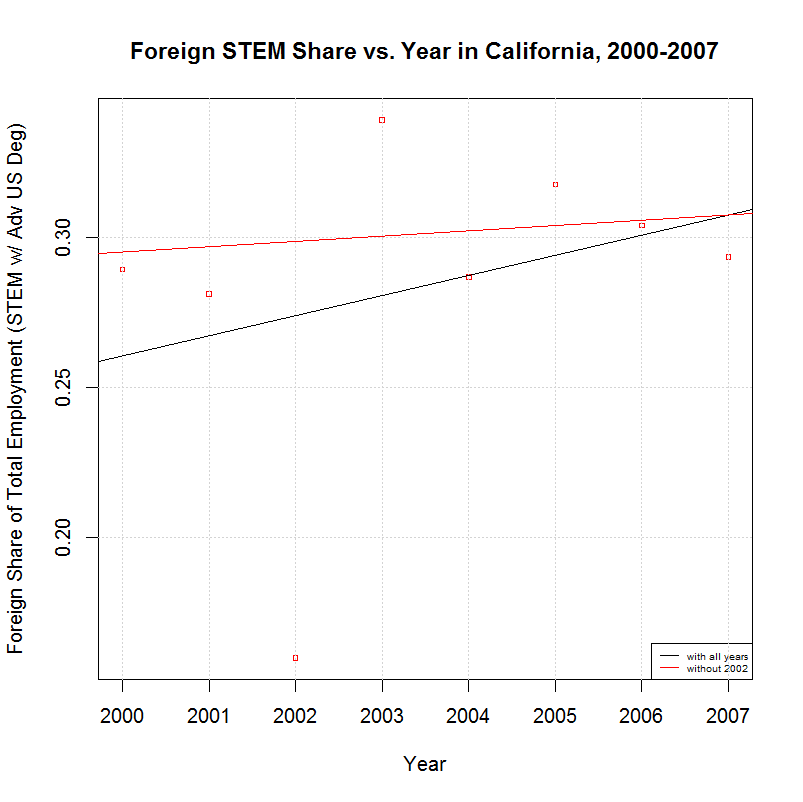
[1] "2000-2007, CALIFORNIA"
[1] " 63.7272 -6.8044 -0.2404 0.5663 emprate_native ~ immshare_emp_stem_e_grad"
[1] " 4.0949 -0.0224 -0.2127 0.6131 lnemprate_native ~ lnimmshare_emp_stem_e_grad"
[1] "1216.5880 -0.5764 -0.9294 0.0008 emprate_native ~ year"
[1] " 22.7217 -0.0093 -0.9310 0.0008 lnemprate_native ~ year"
[1] " -13.1893 0.0067 0.3069 0.4597 immshare_emp_stem_e_grad ~ year"
[1] " -58.1477 0.0284 0.2993 0.4714 lnimmshare_emp_stem_e_grad ~ year"
Press enter to continue, escape to exit
Press enter to continue, escape to exit
Press enter to continue, escape to exit
Press enter to continue, escape to exit
Press enter to continue, escape to exit
>
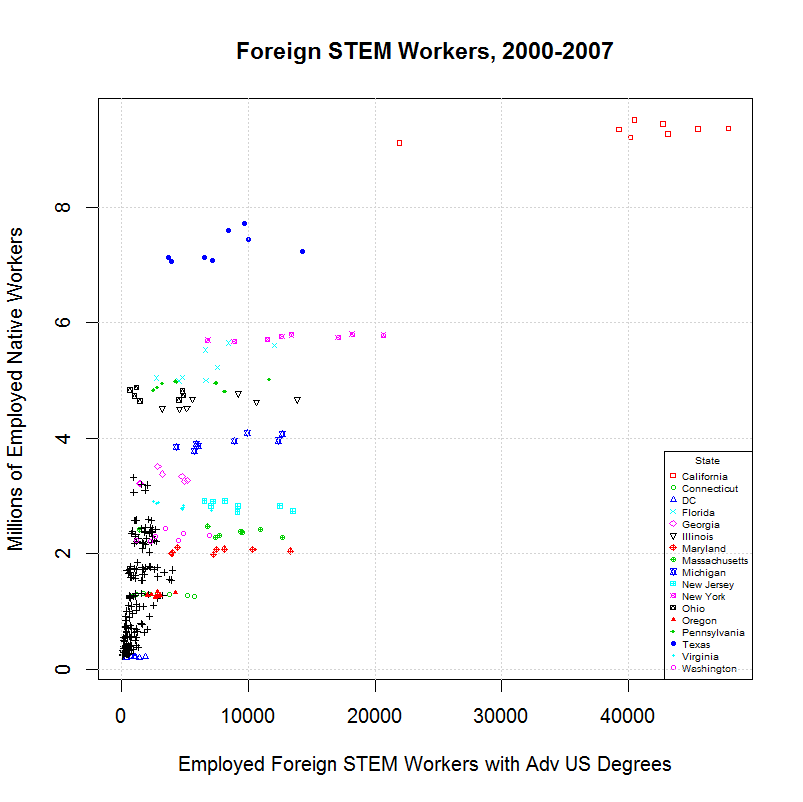
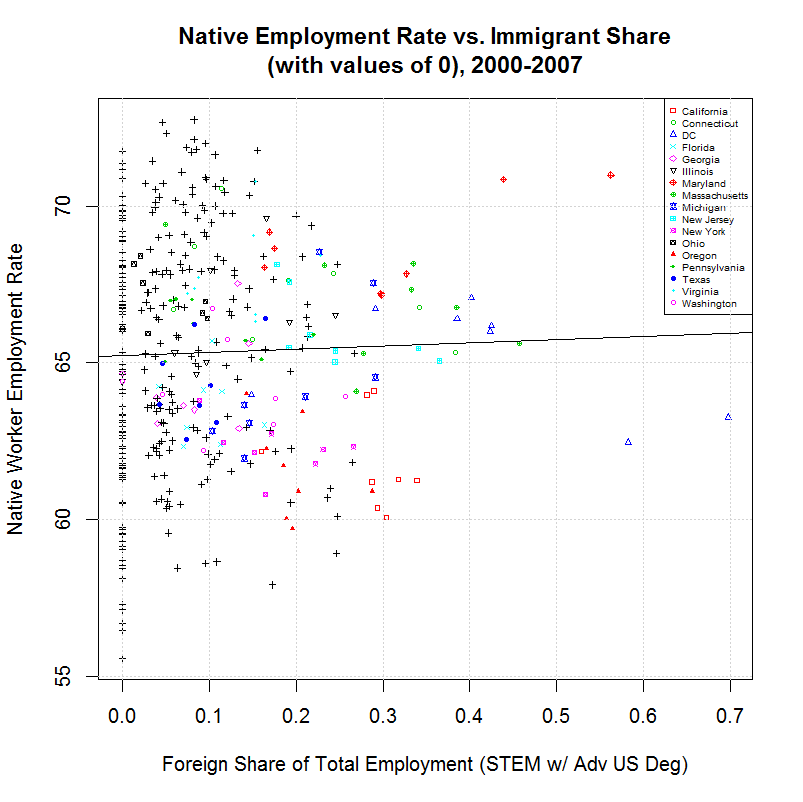
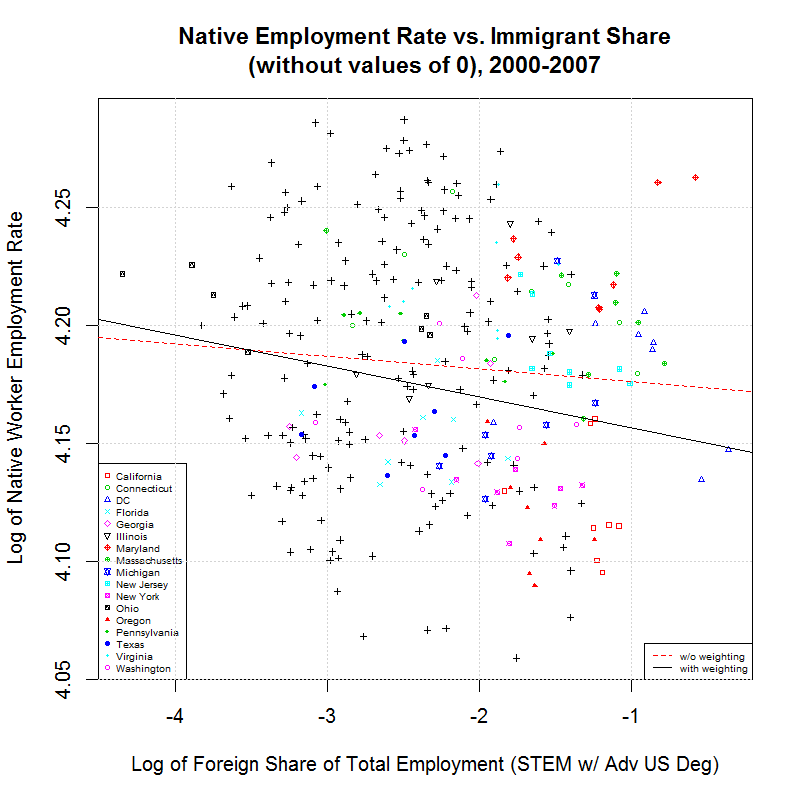
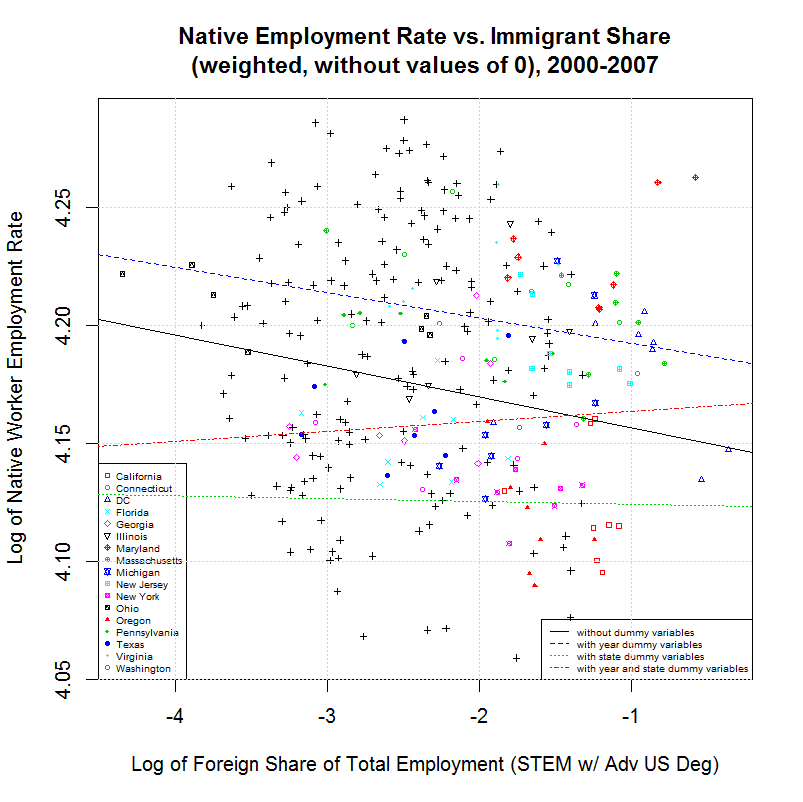
Comparing this to the output from amjobs.R (here) shows virtually no difference. Other than the number of variables which increased by one, the largest percentage change was from 0.1522 to 0.1521, a change of less than one fifteenth of one percent. Following are the graphs that are generated:
As can be seen, these graphs are indistinquishable from those generated by amjobs.R. For that reason, the same descriptions there can be used to describe these graphs.