Non-citizen Percentage of Various Occupations by U.S. State
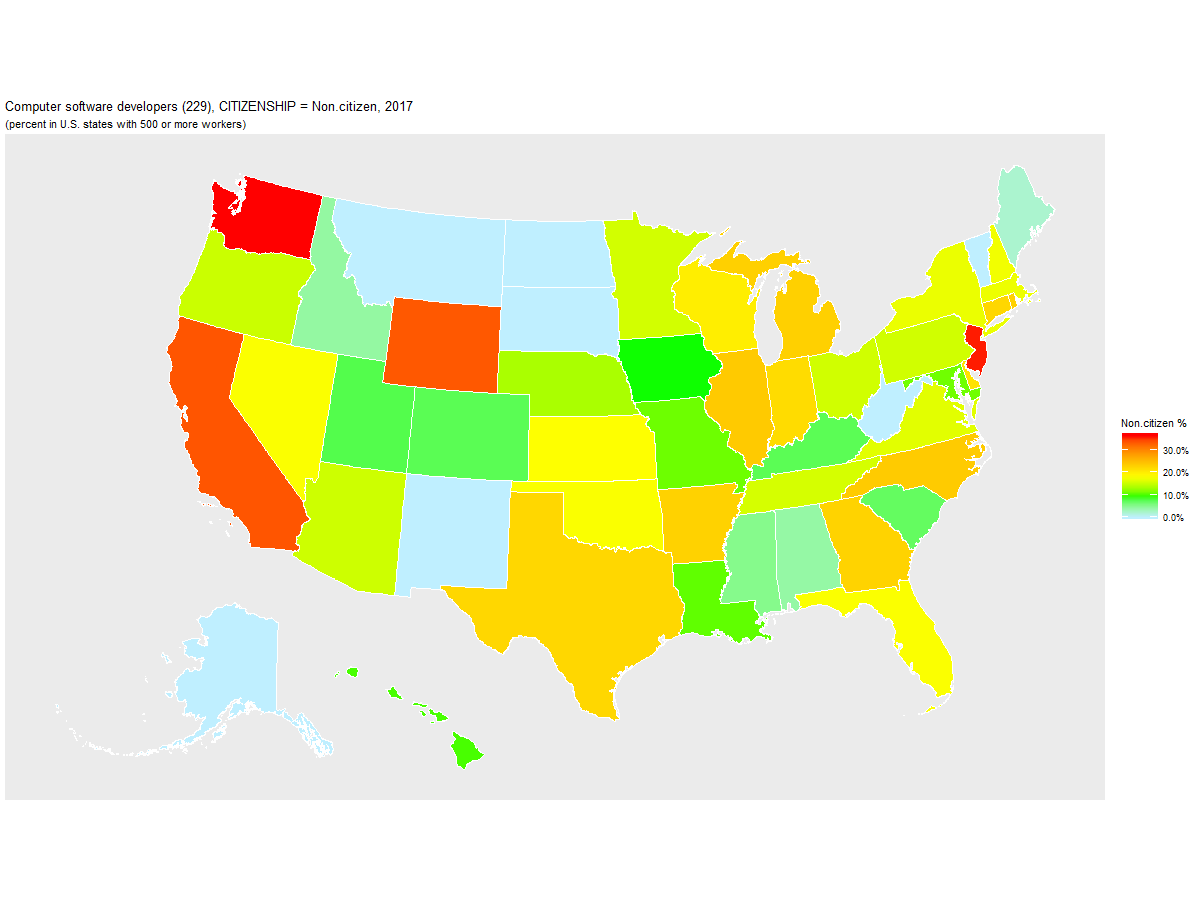
Non-citizen Percentage of Computer Software Developers (229) by U.S. State, 2017
Computer software developers (229): 2017, grouped by CITIZENSHIP (percent)

   Year STATE   Count Non.citizen Naturalized U.S._Born
1  2017    WA  94,231        36.4        10.5      53.0
2  2017    NJ  70,269        36.1        24.7      39.3
3  2017    CA 340,950        33.6        21.1      45.3
4  2017    WY     877        33.4         0.0      66.6
5  2017    IL  66,867        23.6        15.8      60.6
6  2017    NC  54,871        23.6        10.8      65.7
7  2017    MI  41,988        23.0        11.4      65.6
8  2017    RI   5,858        22.9         5.1      72.0
9  2017    AR   9,064        22.9         4.2      72.9
10 2017    GA  51,081        22.7        15.7      61.6
11 2017    TX 133,351        22.4        16.8      60.8
12 2017    CT  18,030        22.3        11.2      66.5
13 2017    IN  20,973        21.9         5.7      72.5
14 2017    DE   3,662        21.2        14.7      64.1
15 2017    WI  29,884        20.0         6.8      73.3
16 2017    KS  14,361        18.2         5.9      75.9
17 2017    NV   6,256        18.0        14.2      67.8
18 2017    FL  73,765        18.0        15.9      66.1
19 2017    OK   9,088        17.9         7.8      74.3
20 2017    NH  13,140        17.4        11.1      71.5
21 2017    MA  70,723        17.1        19.9      63.0
22 2017    NY  92,198        17.0        17.8      65.2
23 2017    VA  78,219        16.5        19.2      64.3
24 2017    TN  22,638        15.7         5.8      78.4
25 2017    MN  40,479        15.6        10.4      74.0
26 2017    OH  44,869        15.5         8.9      75.6
27 2017    PA  62,516        15.4         9.8      74.8
28 2017    AZ  28,209        15.3        10.8      74.0
29 2017    OR  25,863        15.1         9.0      75.8
30 2017    NE  10,468        13.5         7.1      79.4
31 2017    MD  58,240        11.1        15.1      73.8
32 2017    MO  24,758        10.9         6.2      82.8
33 2017    LA   7,395        10.5         3.6      85.9
34 2017    DC   6,818         9.9         9.3      80.8
35 2017    HI   2,935         9.9         4.2      85.9
36 2017    IA  14,940         9.2         7.1      83.7
37 2017    UT  27,182         7.7         3.6      88.6
38 2017    CO  50,474         7.4         8.4      84.1
39 2017    KY  14,512         7.4         4.5      88.1
40 2017    SC  14,240         7.1         3.1      89.9
41 2017    MS   4,546         5.2         3.3      91.4
42 2017    ID   5,281         4.3         6.4      89.3
43 2017    AL  16,830         4.1         4.4      91.4
44 2017    ME   3,541         2.2         3.0      94.8
45 2017    AK     806         0.0         0.0     100.0
46 2017    MT   2,241         0.0         0.0     100.0
47 2017    ND   1,623         0.0         0.0     100.0
48 2017    NM   5,047         0.0        16.4      83.6
49 2017    SD   1,739         0.0         0.0     100.0
50 2017    VT   2,563         0.0         8.7      91.3
51 2017    WV   2,847         0.0         2.1      97.9

URL parameters (short)=
?STATE=&geo=STATE&occ=Computer%20software%20developers%20(229)&group=CITIZENSHIP&sortn=4&mincount=500
Source: Census Bureau, AMERICAN COMMUNITY SURVEY 2017 SAMPLE
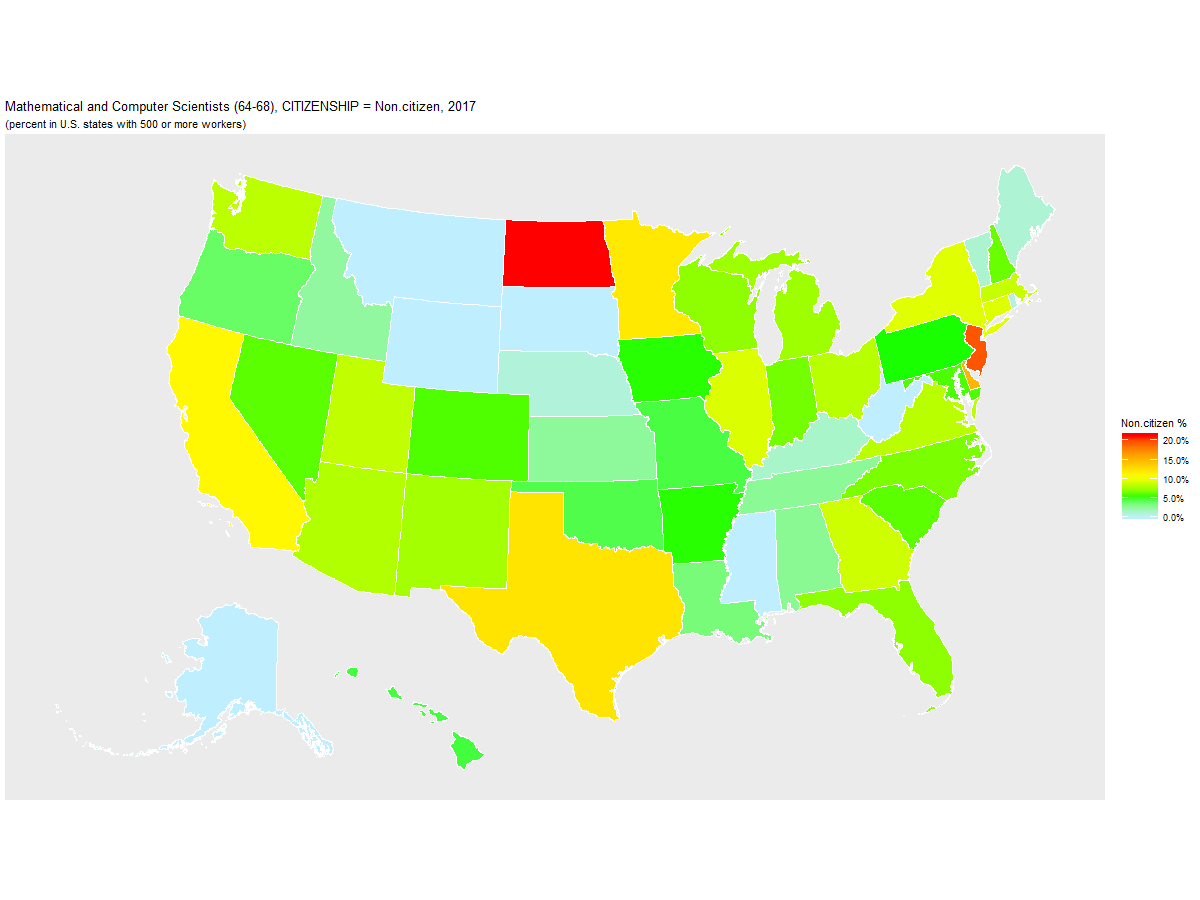
Non-citizen Percentage of Mathematical and Computer Scientists (64-68) by U.S. State, 2017
Mathematical and Computer Scientists (64-68): 2017, grouped by CITIZENSHIP (percent)

   Year STATE   Count Non.citizen Naturalized U.S._Born
1  2017    ND   5,410        21.4         0.0      78.6
2  2017    NJ 117,737        19.7        21.4      58.9
3  2017    DE   9,630        15.2        11.8      73.0
4  2017    DC  17,775        13.0         7.6      79.4
5  2017    TX 269,663        12.3        10.8      76.9
6  2017    MN  69,888        12.0         4.6      83.4
7  2017    CA 333,695        11.1        19.4      69.5
8  2017    NY 159,591         9.6        16.3      74.1
9  2017    CT  35,557         9.5         9.8      80.7
10 2017    IL 141,515         9.5         9.9      80.6
11 2017    GA 109,153         9.0         8.9      82.1
12 2017    MA  80,199         8.8        11.4      79.8
13 2017    UT  33,546         8.6         2.3      89.1
14 2017    WA  84,078         8.4         7.4      84.2
15 2017    VA 162,254         8.4        12.6      79.0
16 2017    OH 104,437         8.3         5.4      86.3
17 2017    AZ  61,841         8.1         6.1      85.8
18 2017    NM  15,486         7.7         1.8      90.5
19 2017    MI  83,988         7.6         7.1      85.4
20 2017    WI  61,976         7.2         4.6      88.2
21 2017    FL 154,482         7.2        15.8      77.0
22 2017    NC 100,068         6.7         5.8      87.5
23 2017    IN  48,597         6.6         5.2      88.3
24 2017    NH  14,208         6.4         4.0      89.6
25 2017    SC  32,805         6.1         3.0      90.9
26 2017    NV  19,274         6.1         8.2      85.7
27 2017    CO  70,901         5.9         5.3      88.7
28 2017    MD 115,123         5.9        14.8      79.3
29 2017    IA  29,177         5.5         2.6      91.9
30 2017    AR  15,204         5.5         5.0      89.5
31 2017    PA 122,949         5.4         7.3      87.3
32 2017    HI   9,721         4.8        13.5      81.7
33 2017    MO  55,827         4.7         3.9      91.4
34 2017    OK  26,513         4.6         0.0      95.4
35 2017    OR  37,994         4.0         7.5      88.5
36 2017    LA  20,985         3.6         1.4      95.1
37 2017    AL  28,991         2.9         1.5      95.6
38 2017    TN  56,134         2.8         2.6      94.6
39 2017    KS  28,557         2.7         3.4      93.9
40 2017    ID  10,995         2.6         0.8      96.6
41 2017    KY  25,579         1.5         4.1      94.5
42 2017    VT   5,311         1.3         4.4      94.3
43 2017    ME  10,031         1.2         0.0      98.8
44 2017    NE  20,707         1.0         2.8      96.2
45 2017    RI   9,554         0.9         6.2      92.9
46 2017    AK   7,622         0.0         7.7      92.3
47 2017    MS  12,395         0.0         0.2      99.8
48 2017    MT   7,504         0.0         2.8      97.2
49 2017    SD   6,729         0.0         0.0     100.0
50 2017    WV   9,845         0.0         2.7      97.3
51 2017    WY   3,991         0.0         0.0     100.0

URL parameters (short)=
?STATE=&geo=STATE&occ=Mathematical%20and%20Computer%20Scientists%20(64-68)&group=CITIZENSHIP&sortn=4&mincount=500
Source: Census Bureau, AMERICAN COMMUNITY SURVEY 2017 SAMPLE
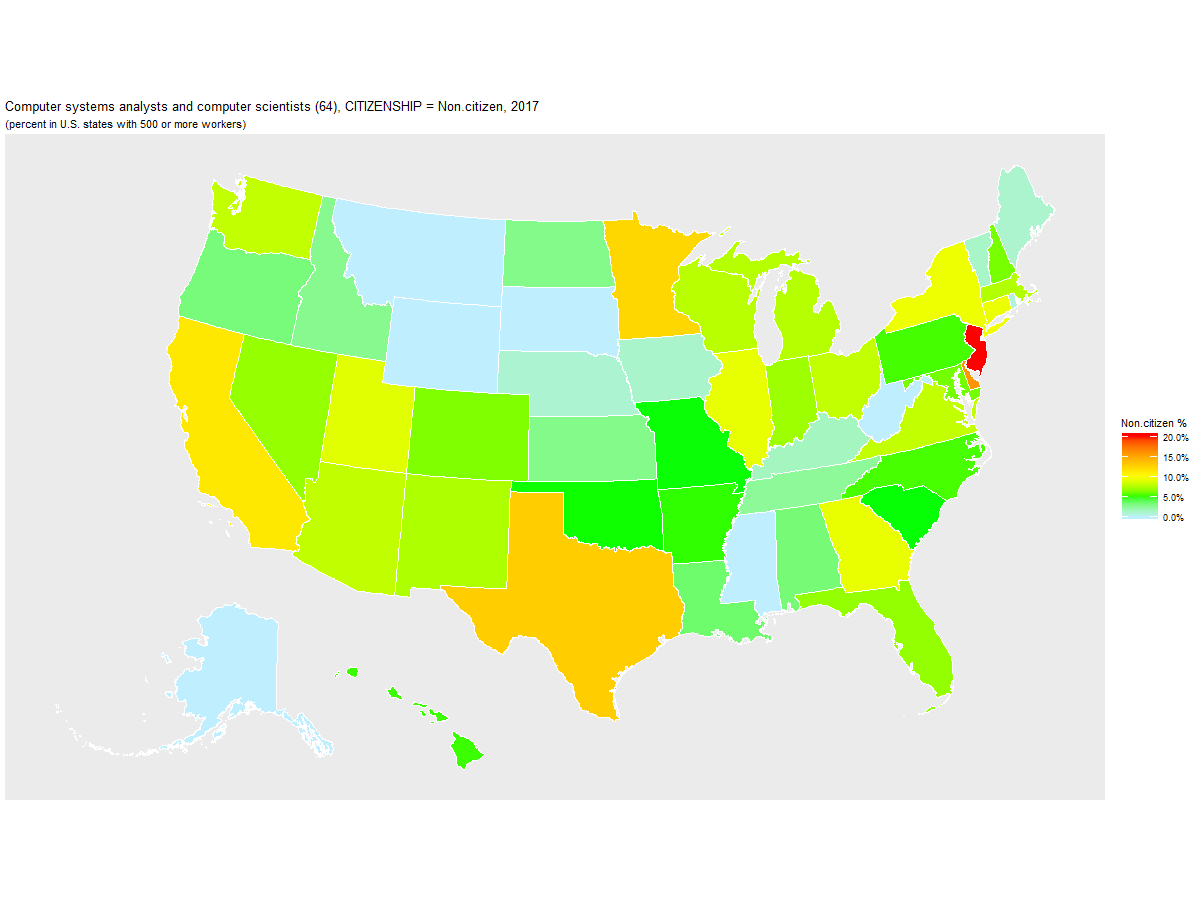
Non-citizen Percentage of Computer systems analysts and computer scientists (64) by U.S. State, 2017
Computer systems analysts and computer scientists (64): 2017, grouped by CITIZENSHIP (percent)

   Year STATE   Count Non.citizen Naturalized U.S._Born
1  2017    NJ 101,240        20.4        22.3      57.3
2  2017    DE   8,539        16.1        13.3      70.6
3  2017    DC  11,466        15.1         7.4      77.6
4  2017    TX 237,951        13.1        10.1      76.7
5  2017    MN  62,814        12.5         4.8      82.6
6  2017    CA 287,986        11.5        19.8      68.7
7  2017    NY 145,078         9.6        16.1      74.3
8  2017    CT  31,586         9.6         9.9      80.6
9  2017    GA  97,486         9.5         9.2      81.3
10 2017    IL 125,741         9.4        10.1      80.5
11 2017    UT  29,865         9.2         2.6      88.2
12 2017    VA 130,974         8.3        13.6      78.2
13 2017    WA  73,401         8.2         7.7      84.1
14 2017    OH  94,319         8.2         5.6      86.1
15 2017    AZ  55,350         8.2         6.8      85.0
16 2017    WI  54,080         8.0         4.3      87.7
17 2017    MI  72,447         7.9         6.6      85.5
18 2017    MA  70,993         7.8        11.8      80.4
19 2017    NM  14,103         7.7         1.9      90.4
20 2017    IN  41,702         7.2         3.6      89.2
21 2017    NV  16,687         7.0         8.3      84.6
22 2017    FL 137,090         7.0        16.5      76.5
23 2017    CO  62,404         6.5         5.6      87.9
24 2017    NH  12,732         6.4         4.2      89.4
25 2017    MD  89,818         6.3        16.5      77.2
26 2017    NC  89,192         5.6         5.8      88.7
27 2017    PA 108,829         5.5         6.7      87.7
28 2017    HI   8,623         5.4        11.6      83.0
29 2017    AR  13,646         5.3         5.5      89.2
30 2017    OK  23,509         5.1         0.0      94.9
31 2017    SC  28,912         5.1         3.4      91.5
32 2017    MO  50,887         5.1         3.3      91.6
33 2017    LA  19,012         3.7         1.5      94.8
34 2017    AL  24,429         3.4         1.8      94.7
35 2017    OR  34,403         3.4         7.0      89.7
36 2017    ND   4,064         3.0         0.0      97.0
37 2017    KS  25,990         3.0         2.8      94.2
38 2017    ID   9,821         2.9         0.9      96.2
39 2017    TN  48,720         2.6         2.9      94.4
40 2017    KY  22,991         1.6         3.5      94.8
41 2017    VT   4,866         1.4         4.8      93.8
42 2017    IA  24,998         1.3         3.1      95.6
43 2017    ME   9,122         1.3         0.0      98.7
44 2017    NE  17,523         1.2         3.3      95.5
45 2017    RI   8,681         1.0         5.5      93.5
46 2017    AK   5,452         0.0         6.5      93.5
47 2017    MS  10,989         0.0         0.2      99.8
48 2017    MT   7,332         0.0         2.9      97.1
49 2017    SD   6,481         0.0         0.0     100.0
50 2017    WV   8,789         0.0         3.1      96.9
51 2017    WY   3,453         0.0         0.0     100.0

URL parameters (short)=
?STATE=&geo=STATE&occ=Computer%20systems%20analysts%20and%20computer%20scientists%20(64)&group=CITIZENSHIP&sortn=4&mincount=500
Source: Census Bureau, AMERICAN COMMUNITY SURVEY 2017 SAMPLE
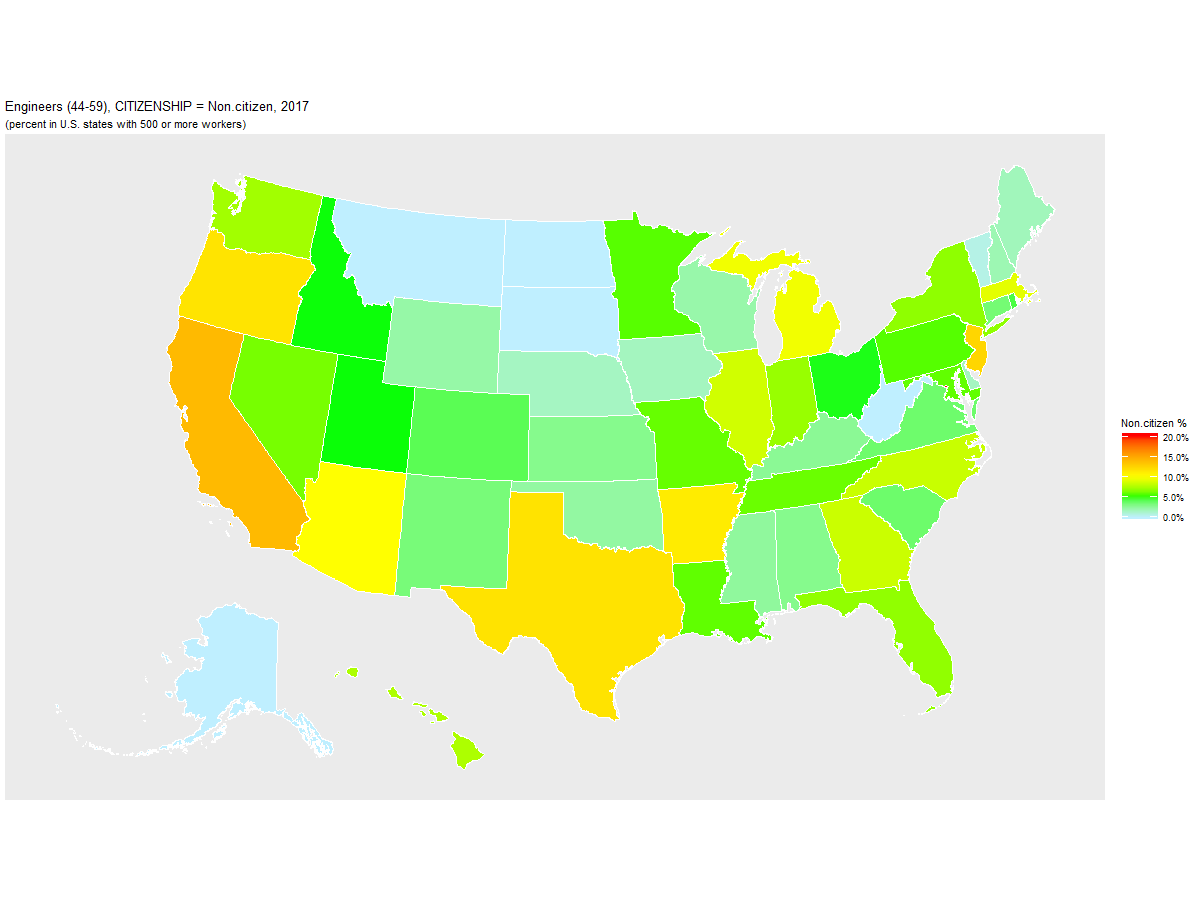
Non-citizen Percentage of Engineers (44-59) by U.S. State, 2017
Engineers (44-59): 2017, grouped by CITIZENSHIP (percent)

   Year STATE   Count Non.citizen Naturalized U.S._Born
1  2017    DC   3,951        20.5         2.8      76.7
2  2017    CA 298,302        14.2        28.6      57.2
3  2017    NJ  53,894        12.6        22.7      64.7
4  2017    TX 187,790        11.9        13.4      74.8
5  2017    OR  36,378        11.8        12.7      75.5
6  2017    AR   8,475        11.3         3.6      85.1
7  2017    AZ  43,945        10.2         9.9      79.9
8  2017    MI 105,943         9.8         9.3      80.9
9  2017    MA  62,122         9.3        12.9      77.7
10 2017    IL  66,372         8.7        14.7      76.6
11 2017    GA  43,711         8.5         9.8      81.7
12 2017    NC  47,467         8.5         7.9      83.7
13 2017    HI   6,853         7.7        11.6      80.7
14 2017    WA  64,102         7.4        14.3      78.3
15 2017    IN  44,504         7.1         2.9      90.0
16 2017    FL  84,182         6.9        17.0      76.1
17 2017    NY  91,254         6.9        15.6      77.5
18 2017    NV  11,755         6.3         6.5      87.1
19 2017    TN  33,356         6.1         4.9      89.0
20 2017    MO  25,987         6.0         4.6      89.4
21 2017    MD  46,260         5.9        14.4      79.7
22 2017    LA  18,608         5.9         4.7      89.4
23 2017    MN  36,919         5.8         5.2      89.0
24 2017    PA  71,732         5.8         7.2      87.0
25 2017    UT  18,344         5.1         5.1      89.8
26 2017    ID   8,615         5.1         7.1      87.8
27 2017    OH  80,231         5.0         8.7      86.3
28 2017    RI   7,413         4.5         8.2      87.3
29 2017    CO  50,147         4.2         7.5      88.3
30 2017    SC  30,719         3.7         7.0      89.3
31 2017    VA  61,756         3.7        13.0      83.3
32 2017    CT  28,996         3.5        15.6      80.9
33 2017    NM  11,935         3.4         4.8      91.8
34 2017    KS  20,325         2.9         4.3      92.8
35 2017    AL  30,665         2.9         2.7      94.4
36 2017    KY  17,935         2.7         2.0      95.3
37 2017    MS   9,477         2.5         5.8      91.6
38 2017    OK  15,997         2.4         7.0      90.6
39 2017    WY   4,369         2.3         0.0      97.7
40 2017    WI  38,071         2.2         5.9      91.9
41 2017    NH  13,622         2.0         1.4      96.7
42 2017    ME   6,262         1.8         0.0      98.2
43 2017    IA  17,127         1.7         5.2      93.1
44 2017    DE   4,877         1.6        21.0      77.3
45 2017    NE   6,903         1.6         0.0      98.4
46 2017    VT   4,964         0.6        15.0      84.3
47 2017    AK   3,731         0.0         0.0     100.0
48 2017    MT   3,949         0.0         0.0     100.0
49 2017    ND   6,305         0.0        18.4      81.6
50 2017    SD   3,697         0.0         9.1      90.9
51 2017    WV   7,044         0.0         2.2      97.8

URL parameters (short)=
?STATE=&geo=STATE&occ=Engineers%20(44-59)&group=CITIZENSHIP&sortn=4&mincount=500
Source: Census Bureau, AMERICAN COMMUNITY SURVEY 2017 SAMPLE
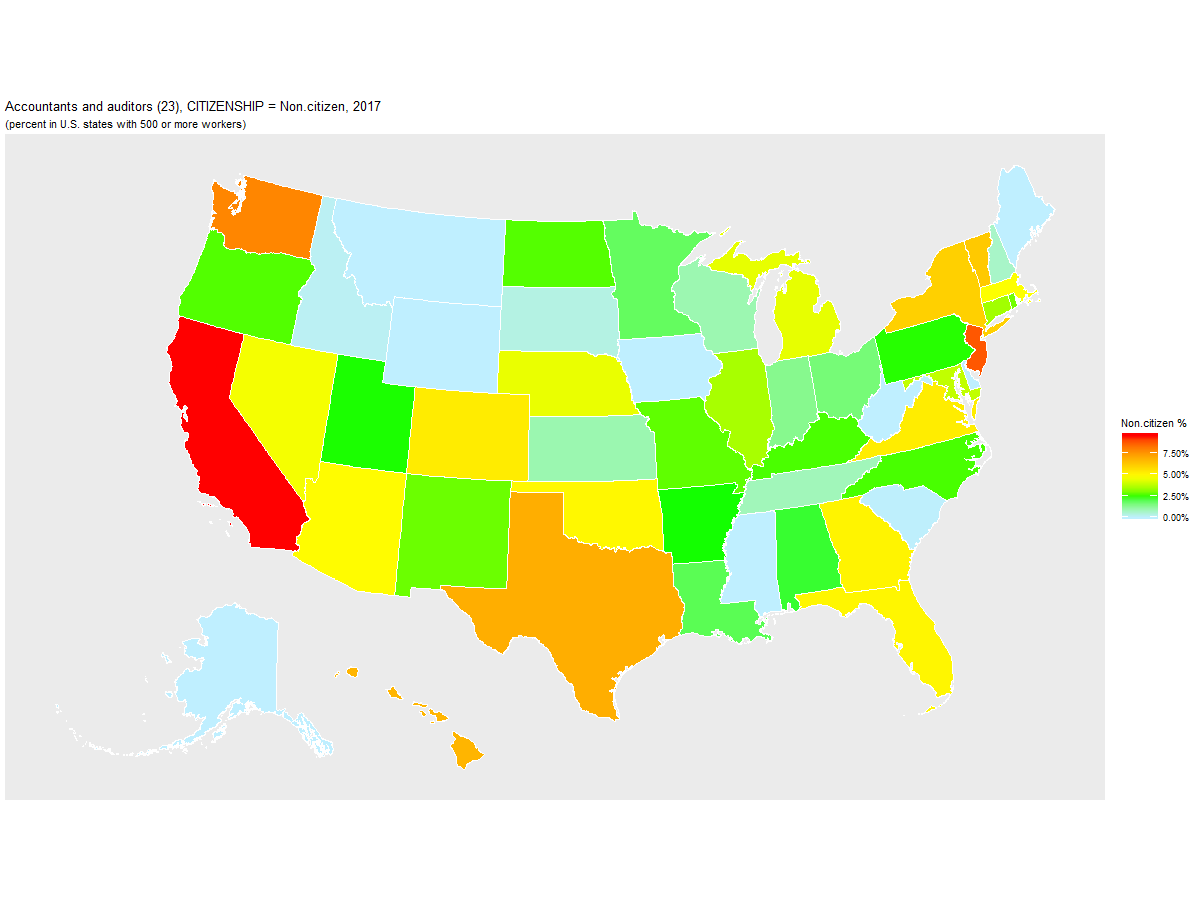
Non-citizen Percentage of Accountants and auditors (23) by U.S. State, 2017
Accountants and auditors (23): 2017, grouped by CITIZENSHIP (percent)

   Year STATE   Count Non.citizen Naturalized U.S._Born
1  2017    CA 265,853         9.5        27.7      62.7
2  2017    NJ  83,857         8.8        23.2      68.0
3  2017    WA  46,374         7.9        12.6      79.6
4  2017    TX 184,602         6.9        11.7      81.3
5  2017    HI  10,375         6.7        17.8      75.5
6  2017    VT   3,975         6.2         1.2      92.6
7  2017    NY 146,841         6.0        20.1      73.9
8  2017    DC   5,503         6.0         9.5      84.5
9  2017    CO  39,319         5.3         4.2      90.5
10 2017    VA  60,761         5.2        11.6      83.2
11 2017    GA  61,269         5.1         8.3      86.6
12 2017    FL 121,679         5.0        19.1      75.8
13 2017    OK  29,485         5.0         6.2      88.8
14 2017    AZ  41,781         4.9         7.5      87.6
15 2017    MA  60,927         4.7        12.9      82.4
16 2017    NV  15,866         4.6        14.6      80.8
17 2017    NE  14,361         4.4         1.3      94.2
18 2017    MI  53,930         4.4         5.6      90.0
19 2017    MD  51,056         3.8        15.8      80.4
20 2017    IL  87,903         3.5        15.2      81.3
21 2017    CT  31,626         3.4        12.4      84.1
22 2017    RI   7,419         2.9         0.0      97.1
23 2017    NM   9,617         2.8         4.7      92.5
24 2017    MO  38,498         2.8         4.1      93.1
25 2017    ND   6,663         2.7         0.0      97.3
26 2017    OR  22,456         2.7         7.3      90.0
27 2017    KY  20,632         2.6         2.5      94.9
28 2017    NC  62,459         2.6         2.8      94.6
29 2017    PA  87,724         2.5         5.5      92.1
30 2017    UT  18,077         2.4         3.7      93.9
31 2017    AR  11,626         2.4         1.9      95.7
32 2017    AL  21,877         2.2         1.9      95.9
33 2017    LA  25,340         2.0         1.3      96.7
34 2017    MN  37,402         1.8         6.0      92.1
35 2017    OH  73,245         1.6         4.8      93.5
36 2017    IN  37,529         1.3         3.3      95.3
37 2017    KS  20,707         1.0         0.5      98.5
38 2017    WI  32,911         0.9         1.1      97.9
39 2017    TN  38,755         0.8         4.2      95.0
40 2017    NH   8,814         0.7         4.6      94.7
41 2017    SD   5,031         0.3         0.0      99.7
42 2017    ID   6,326         0.1         1.9      98.0
43 2017    SC  22,846         0.0         7.7      92.3
44 2017    AK   3,793         0.0         0.0     100.0
45 2017    DE   6,227         0.0         5.7      94.3
46 2017    IA  21,906         0.0         2.1      97.9
47 2017    ME   6,891         0.0         0.0     100.0
48 2017    MS  10,619         0.0         1.8      98.2
49 2017    MT   4,953         0.0         0.0     100.0
50 2017    WV   6,062         0.0         0.5      99.5
51 2017    WY   2,393         0.0        16.0      84.0

URL parameters (short)=
?STATE=&geo=STATE&occ=Accountants%20and%20auditors%20(23)&group=CITIZENSHIP&sortn=4&mincount=500
Source: Census Bureau, AMERICAN COMMUNITY SURVEY 2017 SAMPLE
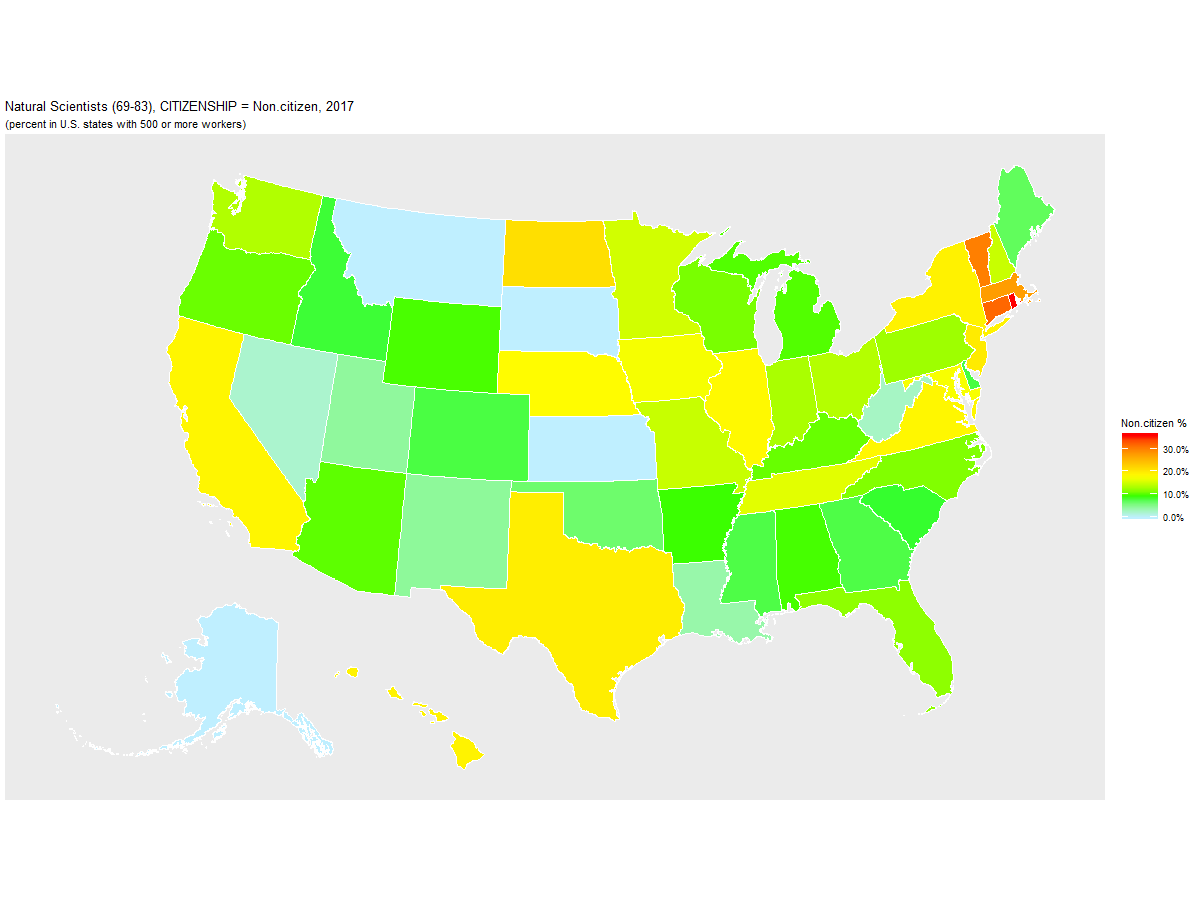
Non-citizen Percentage of Natural Scientists (69-83) by U.S. State, 2017
Natural Scientists (69-83): 2017, grouped by CITIZENSHIP (percent)

   Year STATE   Count Non.citizen Naturalized U.S._Born
1  2017    RI   2,822        35.8         4.8      59.4
2  2017    CT   8,963        31.9        13.4      54.8
3  2017    VT   2,079        30.1         0.0      69.9
4  2017    MA  44,766        27.6        17.3      55.1
5  2017    ND   1,984        21.1         3.5      75.4
6  2017    NJ  25,685        19.9        23.1      57.1
7  2017    TX  41,041        19.6        15.3      65.1
8  2017    NY  38,634        19.3        16.2      64.5
9  2017    HI   2,902        19.1         8.5      72.4
10 2017    CA 102,895        18.8        22.7      58.5
11 2017    VA  22,466        18.8         8.9      72.3
12 2017    IL  21,715        18.5        18.8      62.7
13 2017    NE   2,688        18.2        10.2      71.5
14 2017    MD  36,776        17.5        19.9      62.6
15 2017    IA   6,571        17.4         6.3      76.3
16 2017    DC   5,175        16.7         9.1      74.2
17 2017    TN   9,436        16.2        17.0      66.8
18 2017    MN  16,408        15.3        11.4      73.4
19 2017    NH   1,849        14.8         0.0      85.2
20 2017    MO  11,994        14.7        13.1      72.2
21 2017    OH  17,633        13.7         7.8      78.4
22 2017    WA  21,138        13.6         9.7      76.7
23 2017    IN  13,365        13.3        18.8      68.0
24 2017    PA  33,052        12.7        11.9      75.4
25 2017    FL  21,541        12.0        12.7      75.3
26 2017    NC  26,165        11.5         8.3      80.2
27 2017    WI  13,226        11.2         4.7      84.1
28 2017    OR  11,379        10.7         5.7      83.6
29 2017    KY   3,731        10.6         9.3      80.1
30 2017    AZ   9,722        10.3        14.4      75.4
31 2017    MI  16,312        10.0         8.5      81.5
32 2017    WY   1,155         9.8         0.0      90.2
33 2017    AL   5,486         9.7        13.4      76.9
34 2017    AR   1,830         9.5         2.6      87.9
35 2017    SC   6,083         8.4         6.0      85.6
36 2017    ID   3,085         8.2         0.0      91.8
37 2017    DE   2,676         8.0        11.2      80.9
38 2017    CO  20,510         7.9         8.0      84.2
39 2017    MS   2,039         7.7         2.3      90.0
40 2017    GA  17,415         7.7        11.4      80.8
41 2017    ME   3,820         7.0         8.9      84.1
42 2017    OK   4,759         6.5         4.6      88.9
43 2017    NM   5,711         4.6        24.2      71.2
44 2017    UT   7,099         4.4        10.9      84.7
45 2017    LA   6,458         3.9         2.5      93.6
46 2017    WV   3,029         2.7        30.1      67.2
47 2017    NV   3,378         2.2        13.6      84.1
48 2017    AK   2,431         0.0        20.3      79.7
49 2017    KS   3,699         0.0         3.3      96.7
50 2017    MT   3,818         0.0         0.0     100.0
51 2017    SD     740         0.0         0.0     100.0

URL parameters (short)=
?STATE=&geo=STATE&occ=Natural%20Scientists%20(69-83)&group=CITIZENSHIP&sortn=4&mincount=500
Source: Census Bureau, AMERICAN COMMUNITY SURVEY 2017 SAMPLE
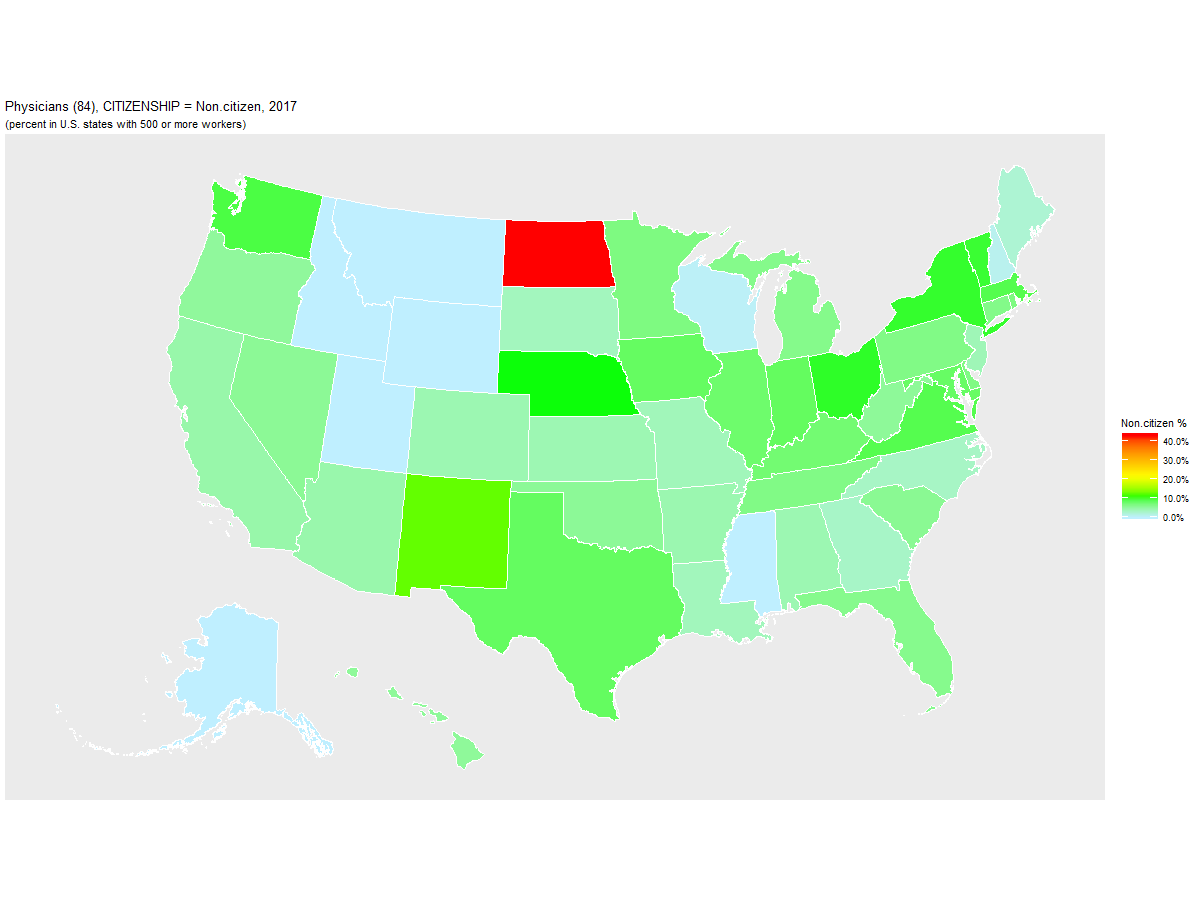
Non-citizen Percentage of Physicians (84) by U.S. State, 2017
Physicians (84): 2017, grouped by CITIZENSHIP (percent)

   Year STATE   Count Non.citizen Naturalized U.S._Born
1  2017    ND   1,887        43.2        12.8      44.0
2  2017    NM   4,686        12.6         7.3      80.1
3  2017    NE   3,319        10.7         3.9      85.4
4  2017    OH  33,939        10.3        18.3      71.5
5  2017    NY  79,723        10.1        26.8      63.1
6  2017    VT   3,263        10.0         9.0      81.0
7  2017    WA  22,125         9.4        17.6      73.0
8  2017    MA  30,649         9.1        19.9      71.1
9  2017    VA  22,160         9.0        22.0      68.9
10 2017    IN  14,572         8.4        18.5      73.2
11 2017    TX  70,465         8.3        26.6      65.0
12 2017    IA   6,282         8.3        11.6      80.1
13 2017    MD  23,137         8.2        20.9      70.9
14 2017    IL  39,527         7.8        23.7      68.5
15 2017    KY   9,492         7.5        18.0      74.5
16 2017    RI   3,617         6.8        11.6      81.6
17 2017    MN  21,443         6.8        21.5      71.7
18 2017    DE   2,770         6.6        17.6      75.8
19 2017    TN  16,229         6.5         8.7      84.7
20 2017    PA  45,401         6.5        16.7      76.8
21 2017    CT  13,860         6.4        18.3      75.3
22 2017    MI  35,584         6.3        20.0      73.7
23 2017    FL  62,028         6.2        26.7      67.1
24 2017    SC  14,970         5.8        11.0      83.1
25 2017    NV   6,282         5.7        28.8      65.5
26 2017    DC   4,135         5.7         3.8      90.5
27 2017    OK   7,384         5.7         8.4      85.9
28 2017    WV   3,918         5.5        18.9      75.5
29 2017    HI   4,219         5.5        14.4      80.1
30 2017    OR  11,962         5.4         5.5      89.1
31 2017    CA 107,729         4.7        31.3      64.0
32 2017    AZ  18,442         4.5        18.1      77.4
33 2017    AR   6,006         4.3         3.9      91.7
34 2017    AL  11,024         4.2        10.6      85.1
35 2017    CO  18,062         4.2         8.0      87.8
36 2017    KS   6,608         4.2        15.7      80.1
37 2017    NJ  29,405         4.0        34.4      61.6
38 2017    MO  16,104         3.8        20.5      75.7
39 2017    LA  13,428         3.7        14.7      81.6
40 2017    SD   3,613         3.6         5.3      91.1
41 2017    NC  28,958         3.2        11.6      85.2
42 2017    GA  23,980         3.1        22.1      74.8
43 2017    ME   3,401         2.4         0.0      97.6
44 2017    NH   4,302         0.9         9.6      89.4
45 2017    WI  17,362         0.4        12.9      86.7
46 2017    AK   2,080         0.0         7.5      92.5
47 2017    ID   1,757         0.0         0.0     100.0
48 2017    MS   4,509         0.0        14.6      85.4
49 2017    MT   2,687         0.0         0.0     100.0
50 2017    UT   7,737         0.0        10.5      89.5
51 2017    WY     916         0.0         0.0     100.0

URL parameters (short)=
?STATE=&geo=STATE&occ=Physicians%20(84)&group=CITIZENSHIP&sortn=4&mincount=500
Source: Census Bureau, AMERICAN COMMUNITY SURVEY 2017 SAMPLE
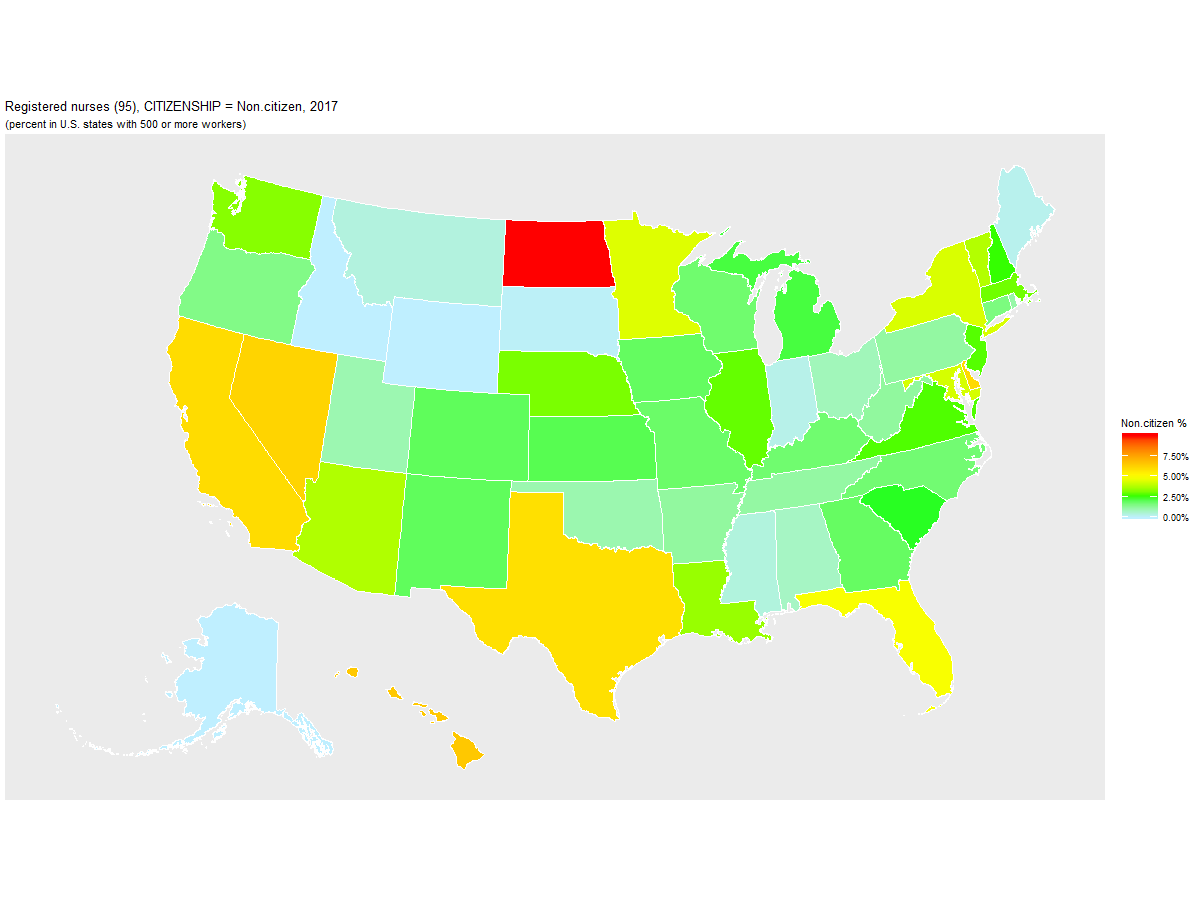
Non-citizen Percentage of Registered nurses (95) by U.S. State, 2017
Registered nurses (95): 2017, grouped by CITIZENSHIP (percent)

   Year STATE   Count Non.citizen Naturalized U.S._Born
1  2017    ND  10,297        10.0         1.8      88.2
2  2017    HI  13,428         6.5        14.2      79.3
3  2017    NV  22,888         6.2        25.2      68.6
4  2017    DE  11,584         6.0        17.6      76.3
5  2017    CA 327,190         6.0        29.6      64.4
6  2017    TX 271,029         5.9        14.2      79.9
7  2017    DC   2,557         5.0        18.0      77.0
8  2017    FL 235,273         4.9        20.3      74.8
9  2017    MN  75,062         4.5         7.7      87.8
10 2017    NY 206,757         4.4        23.8      71.8
11 2017    MD  70,572         4.3        18.4      77.3
12 2017    VT   7,340         3.8         0.5      95.7
13 2017    AZ  62,310         3.8        10.9      85.3
14 2017    LA  52,557         3.5         1.2      95.4
15 2017    WA  75,132         3.3        12.2      84.6
16 2017    NE  22,876         3.1         3.0      93.9
17 2017    MA  95,464         3.0        13.0      84.0
18 2017    IL 140,447         2.9        14.7      82.4
19 2017    NJ  94,109         2.8        27.3      69.9
20 2017    VA  80,802         2.8        10.5      86.7
21 2017    NH  17,406         2.6         4.0      93.4
22 2017    SC  48,350         2.4         2.6      95.0
23 2017    MI 104,293         2.2         6.5      91.3
24 2017    KS  39,345         2.1         1.1      96.8
25 2017    CO  52,254         2.0         6.2      91.8
26 2017    NM  21,772         2.0         5.4      92.6
27 2017    IA  41,446         1.9         1.3      96.7
28 2017    GA  94,965         1.9         8.2      89.9
29 2017    MO  67,353         1.8         3.6      94.6
30 2017    WI  74,634         1.8         3.7      94.6
31 2017    KY  51,591         1.8         0.5      97.7
32 2017    NC 112,800         1.7         4.8      93.5
33 2017    CT  44,146         1.6        10.4      88.1
34 2017    OR  41,439         1.5         5.9      92.6
35 2017    WV  20,178         1.2         1.2      97.5
36 2017    AR  35,518         1.2         0.8      97.9
37 2017    PA 162,939         1.2         5.5      93.3
38 2017    TN  75,888         1.2         2.8      96.1
39 2017    RI  13,634         1.1         4.0      94.9
40 2017    OK  32,824         1.0         3.1      95.8
41 2017    UT  23,437         1.0         3.2      95.8
42 2017    OH 157,509         0.9         2.5      96.7
43 2017    AL  53,049         0.7         1.5      97.8
44 2017    MS  38,154         0.4         1.5      98.1
45 2017    MT  10,869         0.4         0.0      99.6
46 2017    IN  81,176         0.3         2.2      97.5
47 2017    ME  16,096         0.2         4.9      94.8
48 2017    SD  13,309         0.1         0.0      99.9
49 2017    AK   9,614         0.0        19.9      80.1
50 2017    ID  14,074         0.0         2.4      97.6
51 2017    WY   5,341         0.0         1.0      99.0

URL parameters (short)=
?STATE=&geo=STATE&occ=Registered%20nurses%20(95)&group=CITIZENSHIP&sortn=4&mincount=500
Source: Census Bureau, AMERICAN COMMUNITY SURVEY 2017 SAMPLE
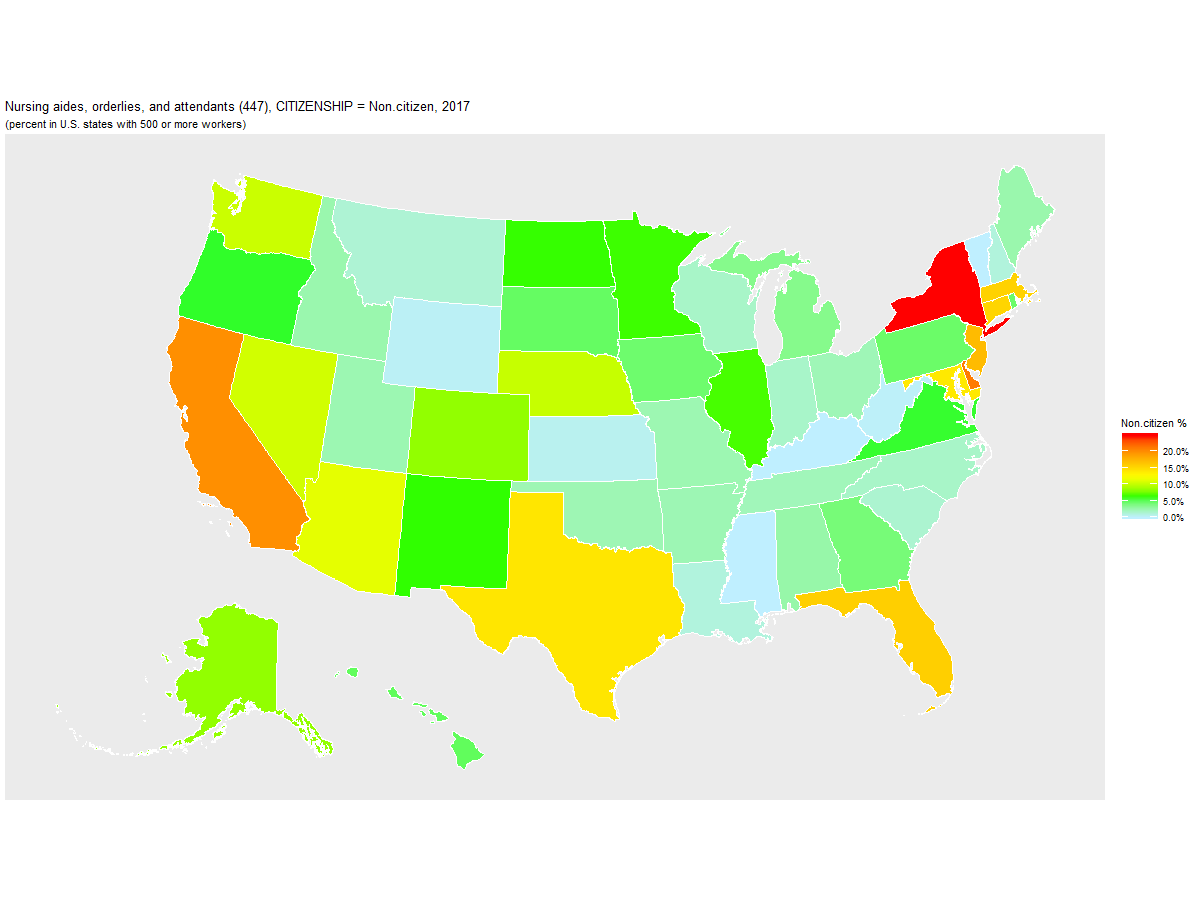
Non-citizen Percentage of Nursing aides, orderlies, and attendants (447) by U.S. State, 2017
Nursing aides, orderlies, and attendants (447): 2017, grouped by CITIZENSHIP (percent)

   Year STATE   Count Non.citizen Naturalized U.S._Born
1  2017    NY 346,883        24.8        33.0      42.2
2  2017    DE   8,236        20.9        14.9      64.1
3  2017    CA 469,262        19.9        27.7      52.4
4  2017    DC   4,590        17.2        10.1      72.6
5  2017    NJ  84,700        17.1        31.9      51.0
6  2017    FL 184,303        15.7        27.3      57.0
7  2017    MA  93,380        15.5        21.0      63.5
8  2017    CT  50,386        15.3        14.5      70.2
9  2017    TX 269,051        14.1        10.0      75.8
10 2017    MD  56,114        13.9        19.0      67.0
11 2017    AZ  58,495        11.3        14.1      74.6
12 2017    NV  16,551        10.6        15.6      73.9
13 2017    WA  69,204        10.3        16.9      72.8
14 2017    NE  22,385        10.1         1.8      88.0
15 2017    AK   6,153         8.4         1.3      90.3
16 2017    CO  44,154         8.4         5.9      85.7
17 2017    IL 139,792         6.7        11.5      81.8
18 2017    MN  82,846         6.6        15.1      78.4
19 2017    ND  12,321         6.5         0.3      93.2
20 2017    NM  25,074         6.4        11.5      82.1
21 2017    OR  59,488         5.9        12.4      81.8
22 2017    VA  73,437         5.8         9.7      84.5
23 2017    HI   8,181         4.9        38.8      56.3
24 2017    SD  11,528         4.7         0.0      95.3
25 2017    PA 161,335         4.6         8.4      87.0
26 2017    RI  15,783         4.5        28.2      67.3
27 2017    IA  32,790         4.4         1.5      94.0
28 2017    GA  68,286         4.1         7.9      88.0
29 2017    MI 116,434         3.6         4.1      92.3
30 2017    AL  39,440         2.7         0.9      96.5
31 2017    ME  23,047         2.6         5.1      92.3
32 2017    ID  17,525         2.5         5.0      92.5
33 2017    UT  18,649         2.4         9.4      88.2
34 2017    MO  74,369         2.4         3.2      94.4
35 2017    AR  31,307         2.4         0.2      97.4
36 2017    OK  31,416         2.4         4.5      93.2
37 2017    OH 133,703         2.3         3.6      94.1
38 2017    TN  56,681         2.2         1.7      96.1
39 2017    WI  78,659         1.7         2.2      96.0
40 2017    NC 101,932         1.7         4.4      93.9
41 2017    IN  61,191         1.7         1.9      96.4
42 2017    SC  45,395         1.5         3.8      94.7
43 2017    MT  13,779         1.3         0.1      98.6
44 2017    NH  13,302         1.1         8.4      90.5
45 2017    LA  45,842         1.1         0.5      98.4
46 2017    KS  29,701         0.5         2.8      96.7
47 2017    WY   6,336         0.3         4.7      95.0
48 2017    WV  20,716         0.2         0.0      99.8
49 2017    KY  35,313         0.0         2.7      97.3
50 2017    MS  26,382         0.0         0.4      99.6
51 2017    VT   5,274         0.0         5.8      94.2

URL parameters (short)=
?STATE=&geo=STATE&occ=Nursing%20aides,%20orderlies,%20and%20attendants%20(447)&group=CITIZENSHIP&sortn=4&mincount=500
Source: Census Bureau, AMERICAN COMMUNITY SURVEY 2017 SAMPLE
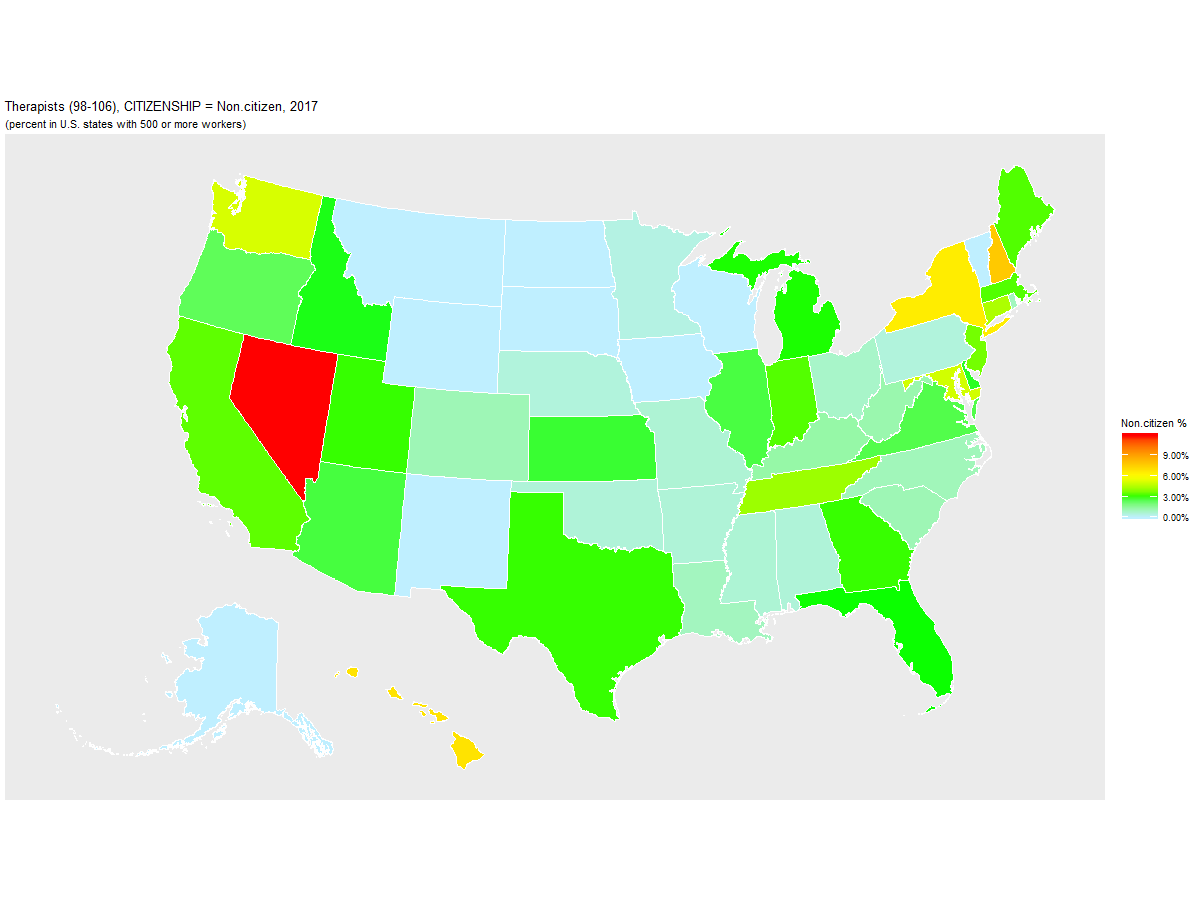
Non-citizen Percentage of Therapists (98-106) by U.S. State, 2017
Therapists (98-106): 2017, grouped by CITIZENSHIP (percent)

   Year STATE   Count Non.citizen Naturalized U.S._Born
1  2017    NV   9,600        11.9         6.6      81.5
2  2017    DC   1,627         7.9         0.0      92.1
3  2017    NH   7,337         7.8         0.0      92.2
4  2017    HI   3,435         6.9        10.3      82.8
5  2017    NY  77,889         6.6        17.0      76.4
6  2017    WA  24,198         5.2         3.8      91.0
7  2017    MD  22,370         5.1        13.8      81.1
8  2017    CT  15,525         4.5         4.6      90.9
9  2017    TN  20,456         4.2         3.5      92.3
10 2017    NJ  31,432         3.7        16.2      80.2
11 2017    CA 114,104         3.4        14.4      82.1
12 2017    IN  25,582         3.3         1.6      95.0
13 2017    MA  31,939         3.3         4.3      92.4
14 2017    ME   4,071         3.3         0.0      96.7
15 2017    GA  26,661         3.1         2.3      94.6
16 2017    UT   9,606         3.1         4.6      92.2
17 2017    TX  76,229         3.1        11.3      85.6
18 2017    MI  37,992         3.0         4.2      92.8
19 2017    FL  65,880         3.0        17.0      80.0
20 2017    ID   4,689         2.9         4.7      92.4
21 2017    DE   3,252         2.9         2.0      95.1
22 2017    KS  12,280         2.8         1.3      96.0
23 2017    AZ  22,415         2.7         7.6      89.8
24 2017    IL  47,572         2.6        15.0      82.4
25 2017    VA  27,375         2.5         7.0      90.5
26 2017    OR  11,022         2.4         6.4      91.2
27 2017    KY  13,301         1.3         1.2      97.5
28 2017    WV   8,628         1.2         0.0      98.8
29 2017    SC  14,487         1.1         1.7      97.2
30 2017    CO  23,319         1.1         2.0      96.9
31 2017    NC  29,834         1.0         5.5      93.5
32 2017    RI   4,933         1.0         9.1      89.9
33 2017    LA  14,640         1.0         1.0      98.0
34 2017    OH  43,317         0.8         1.3      97.9
35 2017    MS   8,806         0.7         0.9      98.4
36 2017    MO  20,572         0.6         1.3      98.0
37 2017    AR   8,620         0.6         0.0      99.4
38 2017    OK  12,342         0.6         4.4      95.0
39 2017    AL  15,061         0.6         1.2      98.2
40 2017    NE   7,661         0.5         4.0      95.4
41 2017    PA  63,972         0.5         3.4      96.1
42 2017    MN  25,306         0.4         5.0      94.6
43 2017    AK   3,080         0.0         0.0     100.0
44 2017    IA   9,484         0.0         0.0     100.0
45 2017    MT   3,612         0.0         3.1      96.9
46 2017    ND   2,173         0.0         0.0     100.0
47 2017    NM   5,466         0.0         2.9      97.1
48 2017    SD   3,211         0.0         0.0     100.0
49 2017    VT   2,384         0.0         0.0     100.0
50 2017    WI  22,965         0.0         0.7      99.3
51 2017    WY   1,216         0.0         0.0     100.0

URL parameters (short)=
?STATE=&geo=STATE&occ=Therapists%20(98-106)&group=CITIZENSHIP&sortn=4&mincount=500
Source: Census Bureau, AMERICAN COMMUNITY SURVEY 2017 SAMPLE
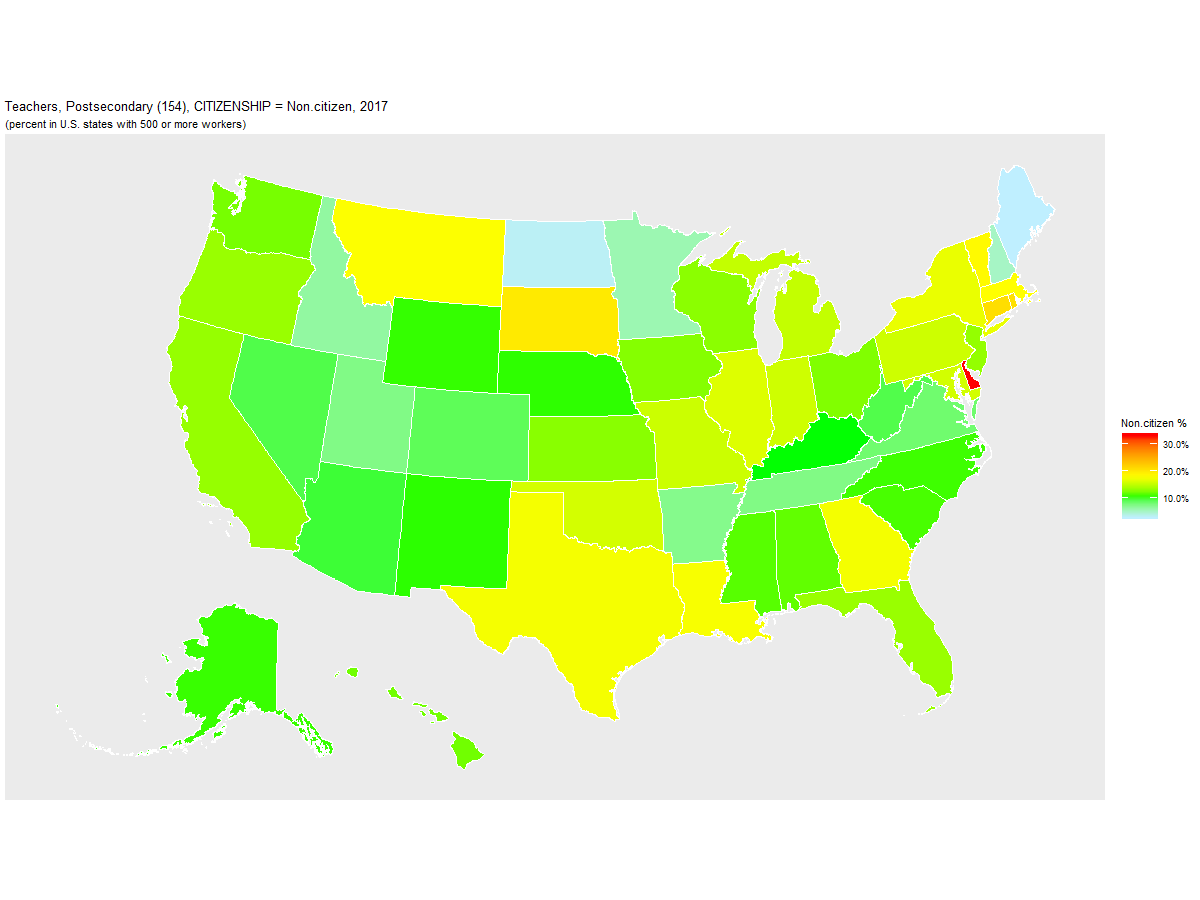
Non-citizen Percentage of Teachers, Postsecondary (154) by U.S. State, 2017
Teachers, Postsecondary (154): 2017, grouped by CITIZENSHIP (percent)

   Year STATE   Count Non.citizen Naturalized U.S._Born
1  2017    DE   6,065        33.4         6.2      60.4
2  2017    CT  19,732        21.0         8.0      71.0
3  2017    RI   9,747        20.9        10.0      69.1
4  2017    SD   3,145        20.0         4.2      75.9
5  2017    VT   5,789        18.6         1.2      80.2
6  2017    MA  58,333        18.2         8.8      73.1
7  2017    MT   4,647        18.1        10.1      71.9
8  2017    LA  17,646        17.8         3.9      78.3
9  2017    TX 107,681        17.7         9.6      72.7
10 2017    GA  44,730        17.6         9.4      73.0
11 2017    DC   6,549        17.2        10.0      72.8
12 2017    NY 112,718        17.1        15.3      67.6
13 2017    IL  67,886        16.5         9.2      74.3
14 2017    OK  17,987        16.0         0.2      83.8
15 2017    MD  36,077        16.0        14.1      69.9
16 2017    IN  39,173        15.8         3.6      80.6
17 2017    PA  75,242        15.7         9.5      74.8
18 2017    MO  33,631        15.6         6.1      78.3
19 2017    MI  55,497        15.3         7.4      77.4
20 2017    FL  76,735        13.5        15.4      71.1
21 2017    OR  21,668        13.5         8.4      78.1
22 2017    CA 164,247        13.4        16.3      70.2
23 2017    NJ  35,926        13.4        19.3      67.3
24 2017    WI  28,779        13.0         4.6      82.4
25 2017    KS  15,553        13.0         8.3      78.7
26 2017    IA  20,763        12.8         2.0      85.2
27 2017    OH  52,970        12.7         9.4      77.9
28 2017    WA  29,370        12.4         8.2      79.4
29 2017    HI   7,167        12.2        12.6      75.2
30 2017    AL  21,536        11.8         8.7      79.5
31 2017    MS   9,645        11.5         7.0      81.4
32 2017    SC  20,934        11.2         6.9      81.9
33 2017    NC  54,070        11.1         5.0      84.0
34 2017    AK   1,867        11.0         0.9      88.2
35 2017    WY   3,695        10.9         2.4      86.7
36 2017    NE  12,375        10.9         6.4      82.8
37 2017    NM   8,628        10.8         6.2      82.9
38 2017    KY  20,972        10.6         6.9      82.6
39 2017    AZ  26,464         9.9         6.2      83.8
40 2017    NV   6,904         9.5         7.9      82.6
41 2017    WV   7,066         9.4         4.2      86.4
42 2017    CO  30,180         9.1         6.7      84.2
43 2017    VA  44,592         8.4        10.3      81.3
44 2017    TN  31,076         7.6         7.6      84.9
45 2017    UT  21,309         7.6         4.4      88.0
46 2017    AR  16,455         7.3         2.3      90.4
47 2017    ID   6,666         6.6         5.4      88.0
48 2017    MN  28,019         5.9        10.6      83.5
49 2017    NH  10,548         5.2        12.2      82.6
50 2017    ND   3,839         3.4         0.0      96.6
51 2017    ME   8,468         3.0         1.2      95.8

URL parameters (short)=
?STATE=&geo=STATE&occ=Teachers,%20Postsecondary%20(154)&group=CITIZENSHIP&sortn=4&mincount=500
Source: Census Bureau, AMERICAN COMMUNITY SURVEY 2017 SAMPLE
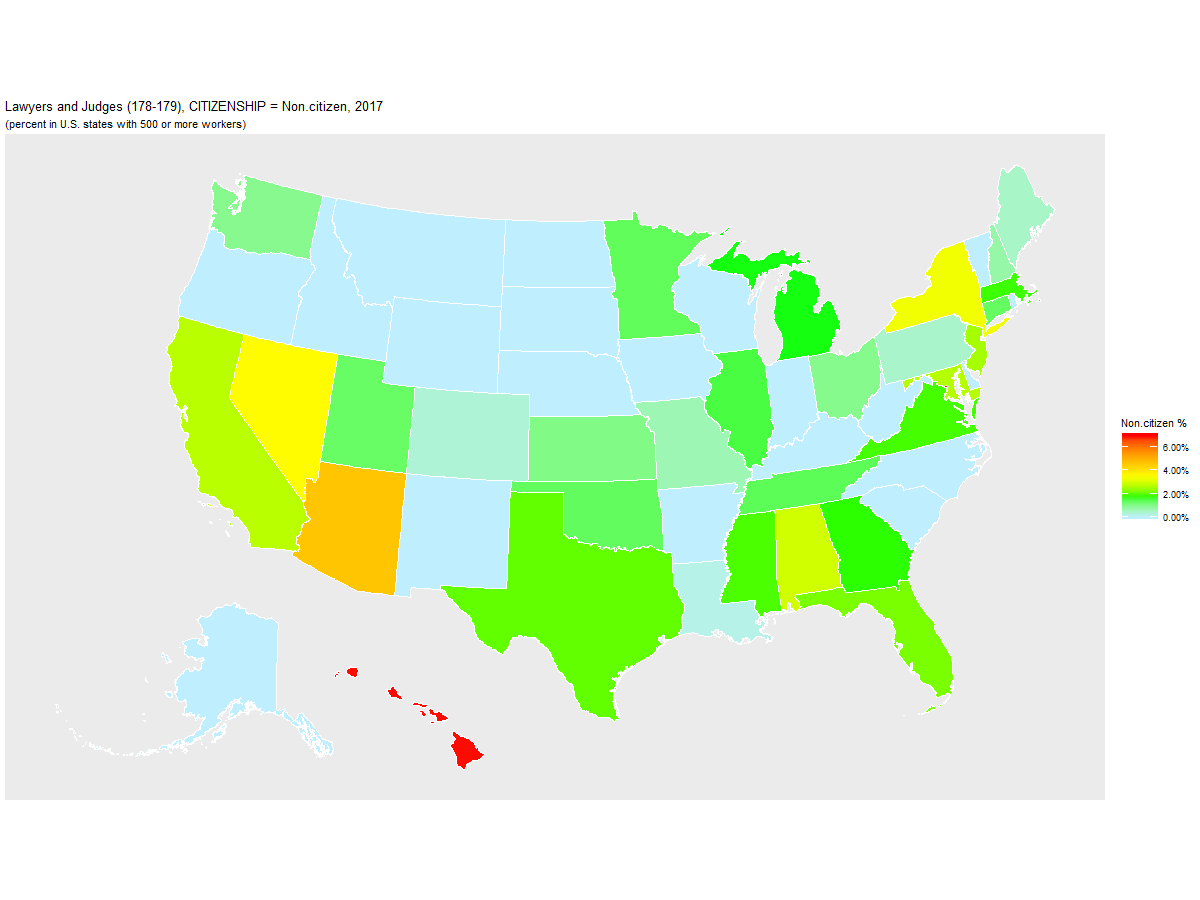
Non-citizen Percentage of Lawyers and Judges (178-179) by U.S. State, 2017
Lawyers and Judges (178-179): 2017, grouped by CITIZENSHIP (percent)

   Year STATE   Count Non.citizen Naturalized U.S._Born
1  2017    DC  22,543         7.0         7.4      85.6
2  2017    HI   4,287         7.0         7.9      85.1
3  2017    AZ  15,971         4.7         6.8      88.6
4  2017    NV   8,049         3.6         2.5      93.9
5  2017    NY 120,411         3.4         7.6      89.0
6  2017    AL  11,266         3.0         0.0      97.0
7  2017    CA 160,111         2.8        11.5      85.7
8  2017    MD  35,685         2.7         5.2      92.0
9  2017    NJ  45,553         2.6         5.8      91.6
10 2017    FL  65,789         2.2         9.7      88.2
11 2017    TX  77,229         2.0         4.8      93.2
12 2017    MS   4,624         1.9         0.0      98.1
13 2017    VA  40,722         1.9         7.3      90.8
14 2017    MA  34,013         1.9         7.6      90.5
15 2017    GA  26,960         1.8         5.6      92.6
16 2017    MI  24,673         1.7         4.8      93.5
17 2017    IL  53,590         1.5         4.1      94.4
18 2017    TN  14,599         1.4         1.0      97.6
19 2017    MN  20,044         1.4         1.8      96.8
20 2017    OK   8,065         1.4         0.0      98.6
21 2017    CT  16,910         1.3         1.7      96.9
22 2017    UT   9,231         1.3         1.0      97.7
23 2017    KS   8,849         1.1         5.0      93.9
24 2017    OH  32,178         1.0         1.4      97.6
25 2017    WA  23,146         1.0         5.5      93.5
26 2017    NH   2,356         0.8        12.3      87.0
27 2017    MO  17,261         0.7         3.5      95.8
28 2017    ME   3,845         0.5         0.0      99.5
29 2017    PA  43,406         0.5         2.0      97.5
30 2017    CO  22,501         0.4         1.2      98.4
31 2017    LA  17,841         0.2         1.0      98.8
32 2017    AK   3,110         0.0         0.0     100.0
33 2017    AR   5,114         0.0         0.0     100.0
34 2017    DE   2,871         0.0         0.9      99.1
35 2017    IA   6,104         0.0         0.0     100.0
36 2017    ID   3,595         0.0         2.7      97.3
37 2017    IN  16,852         0.0         2.3      97.7
38 2017    KY  13,704         0.0         1.1      98.9
39 2017    MT   4,142         0.0         0.0     100.0
40 2017    NC  25,177         0.0         2.5      97.5
41 2017    ND   1,590         0.0         0.0     100.0
42 2017    NE   4,815         0.0         2.5      97.5
43 2017    NM   5,999         0.0         2.8      97.2
44 2017    OR  14,236         0.0         4.5      95.5
45 2017    RI   3,128         0.0         0.0     100.0
46 2017    SC  10,472         0.0         1.8      98.2
47 2017    SD   1,149         0.0         0.0     100.0
48 2017    VT   2,616         0.0         9.7      90.3
49 2017    WI  12,332         0.0         6.0      94.0
50 2017    WV   3,821         0.0         0.0     100.0
51 2017    WY   1,671         0.0         0.0     100.0

URL parameters (short)=
?STATE=&geo=STATE&occ=Lawyers%20and%20Judges%20(178-179)&group=CITIZENSHIP&sortn=4&mincount=500
Source: Census Bureau, AMERICAN COMMUNITY SURVEY 2017 SAMPLE
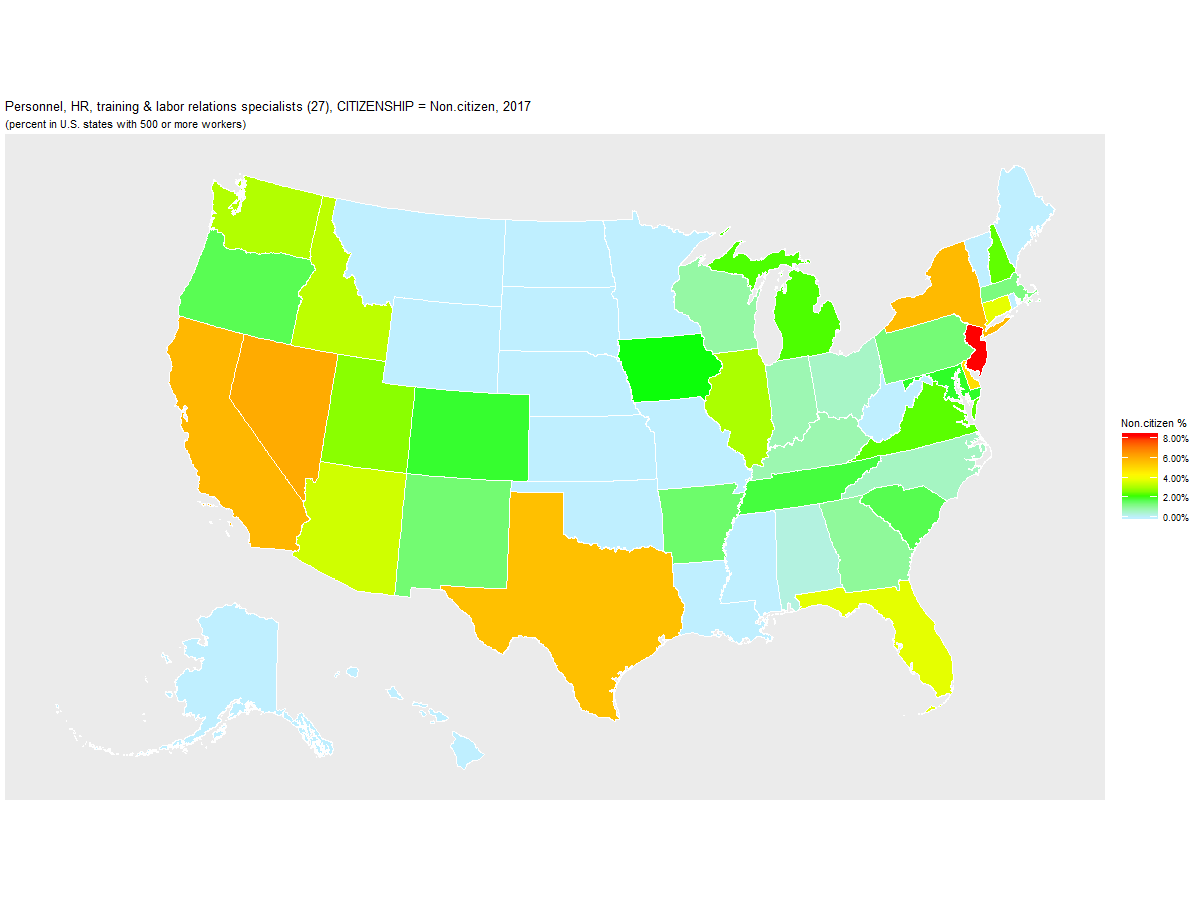
Non-citizen Percentage of Personnel, HR, training & labor relations specialists (27) by U.S. State, 2017
Personnel, HR, training & labor relations specialists (27): 2017, grouped by CITIZENSHIP (percent)

   Year STATE   Count Non.citizen Naturalized U.S._Born
1  2017    NJ  36,510         8.3         9.0      82.7
2  2017    NV   6,761         6.1         8.4      85.6
3  2017    CA 128,716         5.8        12.0      82.2
4  2017    NY  58,247         5.7        10.3      83.9
5  2017    TX  86,159         5.6         5.0      89.3
6  2017    DE   3,451         5.0         7.3      87.7
7  2017    CT  12,966         3.8         5.0      91.2
8  2017    FL  59,891         3.8        11.1      85.2
9  2017    AZ  20,231         3.5         4.0      92.5
10 2017    ID   4,951         3.3         4.2      92.5
11 2017    WA  27,552         3.2         5.7      91.1
12 2017    IL  42,229         3.1         4.1      92.8
13 2017    UT  11,321         2.7         4.1      93.2
14 2017    NH   6,506         2.4         1.1      96.5
15 2017    VA  35,676         2.4         5.7      91.9
16 2017    MI  27,020         2.3         4.0      93.7
17 2017    IA  11,020         2.1         4.7      93.2
18 2017    MD  27,555         2.0         6.8      91.2
19 2017    CO  21,454         1.9         4.1      93.9
20 2017    TN  19,946         1.9         1.0      97.2
21 2017    SC  10,861         1.7         1.2      97.0
22 2017    OR  11,209         1.7         1.5      96.8
23 2017    AR   5,105         1.5         0.0      98.5
24 2017    NM   6,664         1.4         0.9      97.7
25 2017    PA  41,896         1.4         2.4      96.1
26 2017    MA  27,421         1.3         8.1      90.6
27 2017    GA  30,322         1.1         5.2      93.8
28 2017    WI  18,747         0.9         1.4      97.6
29 2017    KY  11,363         0.8         1.9      97.3
30 2017    IN  17,177         0.8         0.4      98.8
31 2017    NC  32,822         0.6         4.6      94.8
32 2017    OH  39,847         0.6         1.3      98.1
33 2017    AL  12,151         0.3         0.0      99.7
34 2017    AK   1,292         0.0         0.0     100.0
35 2017    DC   4,596         0.0        14.8      85.2
36 2017    HI   4,615         0.0         3.7      96.3
37 2017    KS   7,268         0.0         4.9      95.1
38 2017    LA  10,684         0.0         2.8      97.2
39 2017    ME   2,865         0.0         0.0     100.0
40 2017    MN  22,316         0.0         2.2      97.8
41 2017    MO  16,817         0.0         0.5      99.5
42 2017    MS   5,457         0.0         7.5      92.5
43 2017    MT   1,775         0.0         1.1      98.9
44 2017    ND     926         0.0         0.0     100.0
45 2017    NE   6,693         0.0         2.5      97.5
46 2017    OK   7,421         0.0         1.5      98.5
47 2017    RI   3,467         0.0         5.8      94.2
48 2017    SD   1,642         0.0        20.3      79.7
49 2017    VT   1,681         0.0         0.0     100.0
50 2017    WV   3,067         0.0         0.0     100.0
51 2017    WY     729         0.0         0.0     100.0

URL parameters (short)=
?STATE=&geo=STATE&occ=Personnel,%20HR,%20training%20&%20labor%20relations%20specialists%20(27)&group=CITIZENSHIP&sortn=4&mincount=500
Source: Census Bureau, AMERICAN COMMUNITY SURVEY 2017 SAMPLE
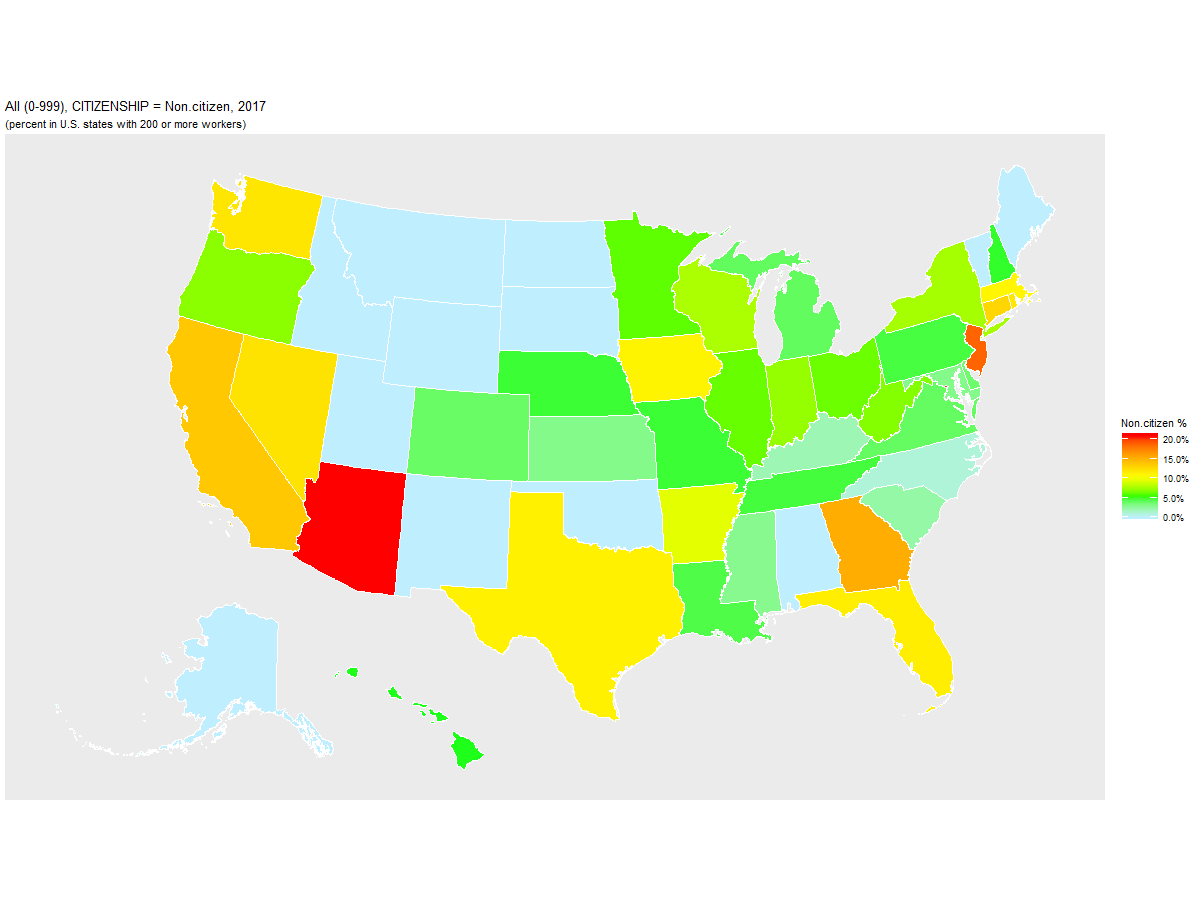
Non-citizen Percentage of Computer and information systems managers (OCC=110) by U.S. State, 2017
Computer and information systems managers (OCC=110): 2017, grouped by CITIZENSHIP (percent)

   Year STATE  Count Non.citizen Naturalized U.S._Born
1  2017    AZ 11,948        21.1         4.1      74.8
2  2017    DC  3,097        20.3         2.0      77.7
3  2017    NJ 30,368        18.9        24.2      56.9
4  2017    GA 26,985        15.4        12.3      72.4
5  2017    CA 75,239        13.8        23.0      63.2
6  2017    CT  8,053        13.0        15.9      71.1
7  2017    NV  3,829        12.2         8.3      79.5
8  2017    WA 20,224        12.0        10.4      77.6
9  2017    RI  2,417        11.9         8.3      79.8
10 2017    FL 31,225        11.6        16.1      72.4
11 2017    TX 48,226        11.4        12.6      76.0
12 2017    IA  7,087        11.2         4.0      84.8
13 2017    MA 20,792        11.1        14.2      74.7
14 2017    AR  2,527         9.6         0.0      90.4
15 2017    WI 11,242         7.8         1.2      90.9
16 2017    NY 32,354         7.7        16.9      75.4
17 2017    IN  8,674         7.2         4.5      88.3
18 2017    OR  6,477         7.0         6.1      86.9
19 2017    WV  1,201         6.8         0.0      93.2
20 2017    OH 19,991         6.3         3.1      90.6
21 2017    IL 25,496         6.2        13.9      79.8
22 2017    MN 18,697         6.1        11.0      82.9
23 2017    HI  1,940         5.2        11.8      83.0
24 2017    NH  4,471         5.0         6.4      88.7
25 2017    NE  3,663         4.9         7.0      88.1
26 2017    MO 11,905         4.8         4.4      90.8
27 2017    TN  9,164         4.7         4.3      90.9
28 2017    PA 22,283         4.7         9.9      85.4
29 2017    LA  3,107         4.5         3.7      91.7
30 2017    MI 14,475         4.1        12.6      83.3
31 2017    VA 27,452         4.1        17.7      78.3
32 2017    CO 14,888         4.0         3.8      92.2
33 2017    DE  2,080         3.8         5.7      90.4
34 2017    MD 19,348         3.1        15.7      81.2
35 2017    KS  4,234         3.1         1.4      95.6
36 2017    MS  3,146         3.0         0.0      97.0
37 2017    SC  7,015         2.4         3.1      94.6
38 2017    KY  5,541         2.0         2.6      95.4
39 2017    NC 19,776         1.1         9.6      89.4
40 2017    AK  1,012         0.0         0.0     100.0
41 2017    AL  4,482         0.0         0.7      99.3
42 2017    ID  2,518         0.0         2.8      97.2
43 2017    ME  1,321         0.0         0.0     100.0
44 2017    MT    414         0.0         0.0     100.0
45 2017    ND    542         0.0         0.0     100.0
46 2017    NM  2,964         0.0         0.0     100.0
47 2017    OK  3,713         0.0         0.0     100.0
48 2017    SD  1,312         0.0         0.0     100.0
49 2017    UT  7,069         0.0         2.9      97.1
50 2017    VT    891         0.0         0.0     100.0
51 2017    WY    247         0.0         0.0     100.0

URL parameters (short)=
?STATE=&xrange1=OCC&minrange1=110&maxrange1=110&geo=STATE&occ=All%20(0-999)&group=CITIZENSHIP&sortn=4&mincount=200
Source: Census Bureau, AMERICAN COMMUNITY SURVEY 2017 SAMPLE
Counties with the Highest Percentage of India-born, Non-citizen Computer Software Developers, 2017
Computer software developers (229): 2017, grouped by BIRTHPLACE_TECH and CTZNSHP (percent)
Year COUNTY Count U.S._Born_U.S._Brn India_Non.ctzn India_Naturlzd India_U.S._Brn China_Non.ctzn China_Naturlzd China_U.S._Brn Other_Non.ctzn Other_Naturlzd Other_U.S._Brn
1 2017 Johnson County IN 1,397 19.0 75.4 5.6 0.0 0.0 0.0 0.0 0.0 0.0 0.0
2 2017 McLean County IL 2,872 34.7 60.7 4.6 0.0 0.0 0.0 0.0 0.0 0.0 0.0
3 2017 Hudson County NJ 8,836 13.1 56.6 1.9 0.0 14.2 1.3 0.0 7.1 5.9 0.0
4 2017 Williamson County TN 2,837 40.5 50.1 0.0 0.0 3.1 0.0 0.0 0.0 6.3 0.0
5 2017 El Dorado County CA 1,205 50.2 49.8 0.0 0.0 0.0 0.0 0.0 0.0 0.0 0.0
6 2017 Benton County AR 3,468 46.0 43.9 2.9 0.0 0.6 0.0 0.0 1.8 2.0 2.8
7 2017 Middlesex County NJ 15,402 18.5 43.5 21.9 0.0 2.8 4.7 0.0 1.4 7.2 0.0
8 2017 Mecklenburg County NC 10,694 45.9 43.2 0.8 0.0 1.3 1.4 0.0 3.1 4.3 0.0
9 2017 Henrico County VA 4,010 46.4 42.2 9.4 0.0 0.0 0.0 0.0 0.0 2.0 0.0
10 2017 Douglas County NE 3,432 47.5 41.1 8.2 3.2 0.0 0.0 0.0 0.0 0.0 0.0
11 2017 Morris County NJ 4,339 32.6 39.0 11.0 0.0 2.2 5.0 0.0 1.4 8.7 0.0
12 2017 Mercer County NJ 4,055 34.3 37.1 14.5 0.0 0.0 0.0 0.0 7.9 6.1 0.0
13 2017 Albany County NY 2,301 55.8 36.1 0.0 0.0 0.0 0.0 0.0 4.7 3.4 0.0
14 2017 Alameda County CA 39,393 29.6 35.7 11.3 0.0 7.3 5.4 0.2 4.8 5.4 0.2
15 2017 Warren County OH 2,469 42.6 35.3 18.4 0.0 0.0 0.0 0.0 0.0 3.7 0.0
16 2017 Lake County IL 6,757 35.3 34.8 5.6 0.0 5.1 0.7 0.0 2.0 16.4 0.0
17 2017 Forsyth County GA 4,449 35.1 33.0 22.5 0.0 0.0 1.3 0.0 2.2 4.9 1.1
18 2017 Passaic County NJ 1,837 54.6 32.8 0.0 0.0 0.0 0.0 0.0 0.0 12.6 0.0
19 2017 Cleveland County OK 2,619 48.5 32.8 0.0 0.0 0.0 0.0 0.0 0.0 18.7 0.0
20 2017 Collin County TX 19,963 43.7 32.5 7.8 0.0 2.2 3.9 0.0 1.8 7.4 0.8
21 2017 DuPage County IL 9,767 44.0 32.3 6.1 0.0 0.0 4.2 0.0 5.9 7.6 0.0
22 2017 Lorain County OH 1,056 67.8 32.2 0.0 0.0 0.0 0.0 0.0 0.0 0.0 0.0
23 2017 Hillsborough County FL 7,446 51.2 32.0 4.4 0.0 0.0 0.0 0.0 4.0 7.1 1.4
24 2017 Providence County RI 3,297 58.1 31.3 9.1 0.0 0.0 0.0 0.0 1.5 0.0 0.0
25 2017 Dallas County TX 16,730 47.9 29.9 10.1 0.0 0.9 2.9 0.0 4.7 3.5 0.2
26 2017 Oakland County MI 14,694 44.5 29.9 9.0 0.0 5.1 2.7 0.0 4.9 2.6 1.3
27 2017 Santa Clara County CA 90,412 26.2 29.0 8.8 0.0 10.4 6.6 0.2 10.0 8.2 0.5
28 2017 San Joaquin County CA 2,148 50.7 29.0 0.0 0.0 0.0 2.4 0.0 1.5 12.8 3.6
29 2017 Fairfield County CT 4,237 43.2 28.1 1.6 0.0 6.0 7.0 0.0 9.4 3.5 1.3
30 2017 Marion County OR 1,213 58.4 26.1 0.0 0.0 0.0 0.0 0.0 2.5 4.2 8.8
31 2017 Loudoun County VA 12,867 41.1 26.0 20.5 0.0 0.7 1.3 0.0 0.5 6.4 3.5
32 2017 Dane County WI 10,832 63.8 25.8 0.0 0.0 3.9 1.4 0.0 0.0 5.0 0.0
33 2017 Hartford County CT 6,529 54.1 25.3 1.9 0.0 1.2 0.0 0.0 1.2 13.9 2.4
34 2017 York County SC 1,129 66.6 24.6 0.0 0.0 0.0 0.0 0.0 0.0 0.0 8.8
35 2017 Bucks County PA 4,120 60.3 23.8 1.9 0.0 0.0 4.7 0.0 0.0 7.7 1.6
36 2017 Burlington County NJ 3,868 58.6 22.9 8.7 0.0 0.0 4.2 0.0 2.0 2.5 1.1
37 2017 Duval County FL 6,645 47.7 22.8 13.7 0.0 0.0 0.0 0.0 6.3 9.6 0.0
38 2017 Washington County OR 11,096 59.5 22.6 5.0 0.0 1.0 2.3 0.0 5.1 3.5 0.9
39 2017 Oklahoma County OK 2,177 60.1 22.2 0.0 0.0 0.0 0.0 0.0 7.7 10.0 0.0
40 2017 New Castle County DE 3,061 57.0 21.5 17.5 0.0 0.0 0.0 0.0 4.0 0.0 0.0
41 2017 Delaware County PA 3,929 64.2 21.4 0.0 0.0 4.5 2.6 0.0 0.0 7.3 0.0
42 2017 Denton County TX 7,218 41.1 21.0 14.7 0.0 0.4 4.3 0.0 8.9 6.0 3.6
43 2017 Durham County NC 4,448 58.0 20.6 2.7 0.0 1.9 2.7 0.0 2.1 12.0 0.0
44 2017 Bexar County TX 8,500 65.3 20.6 3.0 0.0 0.0 0.0 0.0 1.6 6.5 3.0
45 2017 Johnson County KS 8,509 66.0 19.9 2.0 0.0 0.8 2.0 0.0 3.7 4.9 0.6
46 2017 San Bernardino County CA 4,067 39.6 19.9 0.0 0.0 10.4 6.2 0.0 3.1 16.5 4.2
47 2017 Snohomish County WA 7,859 50.1 19.9 0.9 0.0 3.8 2.5 0.0 14.0 8.0 0.8
48 2017 King County WA 72,589 46.0 19.9 2.2 0.0 10.4 3.0 0.0 12.0 5.1 1.4
49 2017 Bergen County NJ 5,208 41.0 19.8 9.3 0.0 2.1 2.0 0.0 5.5 20.3 0.0
50 2017 Williamson County TX 9,423 52.4 19.4 13.4 0.0 2.0 2.9 0.0 4.0 6.0 0.0
URL parameters (short)=
?STATE=&geo=COUNTY&occ=Computer%20software%20developers%20(229)&group=BIRTHPLACE_TECH|CTZNSHP&sortn=5&mincount=1000
States with the Highest Percentage of India-born, Non-citizen Computer Software Developers, 2017
Computer software developers (229): 2017, grouped by BIRTHPLACE_TECH and CTZNSHP (percent)
Year STATE Count U.S._Born_U.S._Brn India_Non.ctzn India_Naturlzd India_U.S._Brn China_Non.ctzn China_Naturlzd China_U.S._Brn Other_Non.ctzn Other_Naturlzd Other_U.S._Brn
1 2017 NJ 70,269 39.1 28.8 9.1 0.0 3.9 4.9 0.0 3.4 10.7 0.2
2 2017 RI 5,858 72.0 22.1 5.1 0.0 0.0 0.0 0.0 0.9 0.0 0.0
3 2017 NC 54,871 64.9 19.8 3.6 0.0 1.2 1.8 0.0 2.6 5.3 0.8
4 2017 CA 340,950 43.8 18.3 6.0 0.0 6.3 4.9 0.1 9.0 10.2 1.3
5 2017 IN 20,973 72.0 18.1 3.2 0.0 1.3 0.3 0.0 2.5 2.2 0.5
6 2017 DE 3,662 64.1 17.9 14.7 0.0 0.0 0.0 0.0 3.3 0.0 0.0
7 2017 IL 66,867 60.2 17.8 6.1 0.0 2.7 2.3 0.0 3.2 7.3 0.4
8 2017 WA 94,231 51.7 17.3 1.8 0.0 8.5 2.7 0.0 10.7 6.0 1.4
9 2017 CT 18,030 64.4 16.9 1.8 0.0 1.9 2.4 0.0 3.6 7.0 2.1
10 2017 AR 9,064 71.9 16.8 2.6 0.0 2.4 0.0 0.0 3.7 1.6 1.1
11 2017 GA 51,081 61.0 16.6 5.3 0.0 1.1 1.7 0.0 5.0 8.6 0.6
12 2017 MI 41,988 65.1 16.2 5.8 0.0 2.5 2.8 0.0 4.3 2.9 0.5
13 2017 TX 133,351 59.3 15.3 6.7 0.2 2.2 2.7 0.0 4.8 7.5 1.3
14 2017 NH 13,140 71.3 15.0 4.5 0.0 0.7 1.7 0.0 1.7 4.9 0.2
15 2017 OK 9,088 74.3 14.8 0.0 0.0 0.0 0.0 0.0 3.1 7.8 0.0
16 2017 NE 10,468 78.3 13.5 2.7 1.1 0.0 0.0 0.0 0.0 4.5 0.0
17 2017 WI 29,884 73.2 13.4 1.5 0.0 1.7 0.5 0.0 4.8 4.8 0.1
18 2017 KS 14,361 73.1 12.9 1.2 0.0 1.9 1.2 0.0 3.4 3.5 2.8
19 2017 NV 6,256 65.7 12.7 2.2 0.0 0.0 5.2 0.0 5.3 6.8 2.1
20 2017 VA 78,219 62.2 12.7 8.9 0.0 0.5 1.7 0.0 3.4 8.7 2.0
21 2017 OH 44,869 75.0 12.6 4.5 0.1 0.9 1.3 0.0 2.0 3.2 0.5
22 2017 PA 62,516 73.7 11.3 2.6 0.0 0.9 1.3 0.0 3.3 5.8 1.0
23 2017 OR 25,863 74.1 10.9 2.7 0.0 0.9 1.5 0.0 3.3 4.9 1.7
24 2017 FL 73,765 63.4 10.9 4.3 0.1 0.9 1.1 0.0 6.1 10.5 2.6
25 2017 TN 22,638 77.5 10.8 1.0 0.0 2.0 0.5 0.0 2.9 4.3 0.9
26 2017 AZ 28,209 71.1 10.8 3.3 0.0 1.0 0.8 0.0 3.5 6.6 2.8
27 2017 MN 40,479 73.0 10.4 1.6 0.4 0.0 1.1 0.0 5.2 7.7 0.5
28 2017 MA 70,723 61.1 9.7 4.9 0.0 1.5 3.3 0.6 6.0 11.6 1.3
29 2017 IA 14,940 83.4 8.9 1.0 0.0 0.0 0.0 0.0 0.3 6.1 0.4
30 2017 MO 24,758 80.6 8.5 2.8 0.0 0.4 0.0 0.0 2.1 3.4 2.2
31 2017 MD 58,240 71.9 6.7 2.6 0.0 1.5 2.7 0.1 2.9 9.8 1.9
32 2017 SC 14,240 88.5 6.3 0.0 0.0 0.7 0.7 0.0 0.0 2.4 1.3
33 2017 KY 14,512 86.3 5.6 0.9 0.0 1.2 0.0 0.0 0.6 3.7 1.8
34 2017 MS 4,546 87.6 5.2 2.6 0.0 0.0 0.0 0.0 0.0 0.7 3.8
35 2017 NY 92,198 64.2 5.2 3.1 0.0 2.7 3.3 0.0 9.2 11.4 1.1
36 2017 CO 50,474 82.5 4.9 2.1 0.0 0.3 1.2 0.0 2.3 5.1 1.7
37 2017 UT 27,182 85.9 4.2 0.4 0.0 1.1 0.0 0.0 2.3 3.3 2.7
38 2017 DC 6,818 77.6 3.4 0.0 0.0 2.2 0.0 0.0 4.4 9.3 3.2
39 2017 AL 16,830 88.8 2.1 1.1 0.0 0.8 1.3 0.0 1.2 2.0 2.6
40 2017 LA 7,395 85.9 1.7 0.8 0.0 0.0 2.1 0.0 8.8 0.7 0.0
41 2017 AK 806 83.5 0.0 0.0 0.0 0.0 0.0 0.0 0.0 0.0 16.5
42 2017 HI 2,935 82.9 0.0 0.0 0.0 0.0 0.0 3.0 9.9 4.2 0.0
43 2017 ID 5,281 89.3 0.0 1.8 0.0 0.0 0.0 0.0 4.3 4.6 0.0
44 2017 ME 3,541 94.8 0.0 0.0 0.0 1.6 0.0 0.0 0.6 3.0 0.0
45 2017 MT 2,241 100.0 0.0 0.0 0.0 0.0 0.0 0.0 0.0 0.0 0.0
46 2017 ND 1,623 100.0 0.0 0.0 0.0 0.0 0.0 0.0 0.0 0.0 0.0
47 2017 NM 5,047 80.7 0.0 0.0 0.0 0.0 4.8 0.0 0.0 11.6 2.9
48 2017 SD 1,739 100.0 0.0 0.0 0.0 0.0 0.0 0.0 0.0 0.0 0.0
49 2017 VT 2,563 91.3 0.0 0.0 0.0 0.0 0.0 0.0 0.0 8.7 0.0
50 2017 WV 2,847 97.9 0.0 0.0 0.0 0.0 0.0 0.0 0.0 2.1 0.0
51 2017 WY 877 66.6 0.0 0.0 0.0 0.0 0.0 0.0 33.4 0.0 0.0
URL parameters (short)=
?STATE=&geo=STATE&occ=Computer%20software%20developers%20(229)&group=BIRTHPLACE_TECH|CTZNSHP&sortn=5&mincount=500
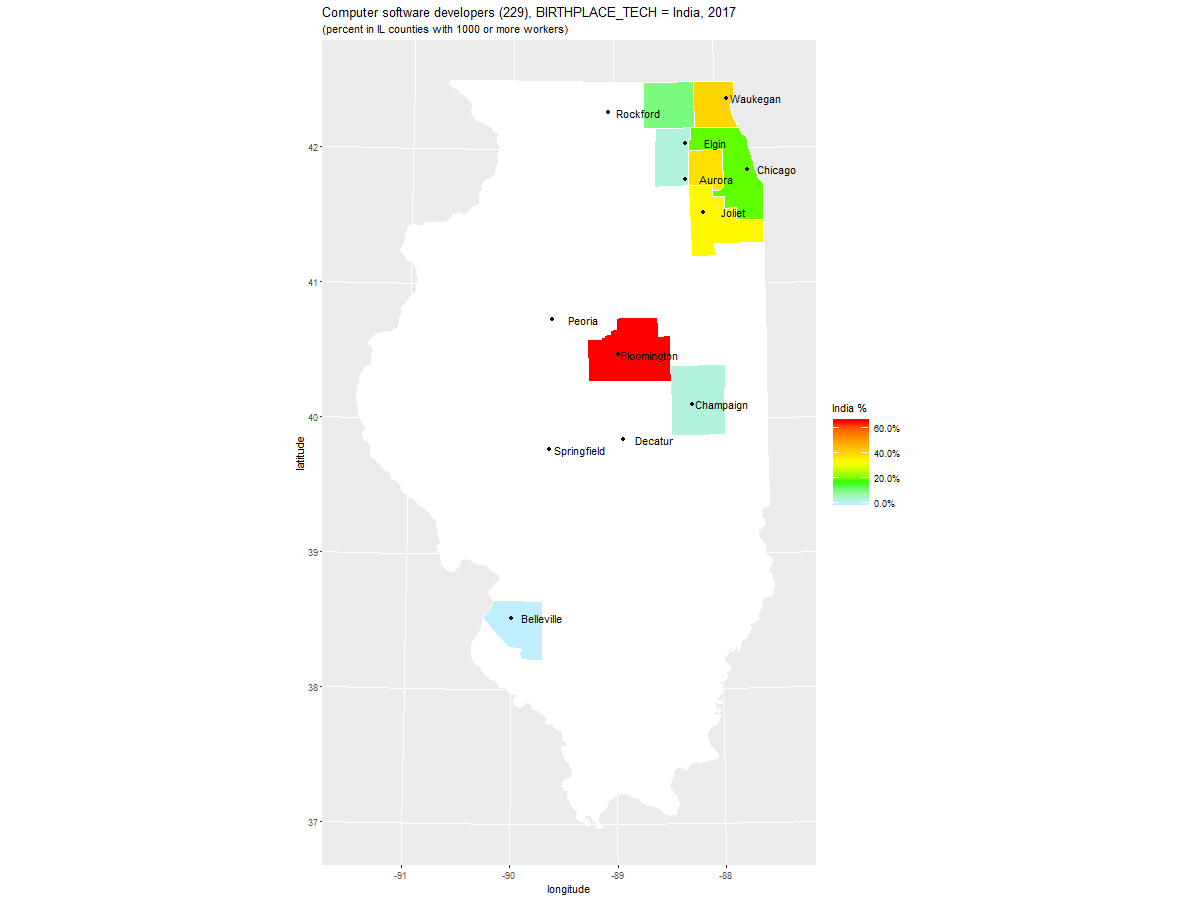
Counties with Lowest Percentage of U.S. Born Computer Software Developers, 2017
Percentage of Computer Software Developers in Illinois by County, grouped by Birthplace, ordered by India, 2017
Computer software developers (229): 2017, grouped by BIRTHPLACE_TECH (percent)

   Year              COUNTY  Count U.S._Born India China Other
1  2017    McLean County IL  2,872      34.7  65.3   0.0   0.0
2  2017      Lake County IL  6,757      35.3  40.5   5.8  18.4
3  2017    DuPage County IL  9,767      44.0  38.4   4.2  13.4
4  2017      Will County IL  3,733      44.3  34.0  12.1   9.5
5  2017      Cook County IL 28,419      62.8  18.8   4.7  13.6
6  2017   McHenry County IL  1,590      77.2  10.6   0.0  12.3
7  2017                (NA)  3,781      90.8   9.2   0.0   0.0
8  2017      Kane County IL  2,657      94.5   2.8   0.0   2.7
9  2017 Champaign County IL  2,428      72.0   2.7  20.6   4.7
10 2017 St. Clair County IL  1,372     100.0   0.0   0.0   0.0

URL parameters (short)=
?STATE=IL&geo=COUNTY&occ=Computer%20software%20developers%20(229)&group=BIRTHPLACE_TECH&sortn=5&mincount=1000
Source: Census Bureau, AMERICAN COMMUNITY SURVEY 2017 SAMPLE
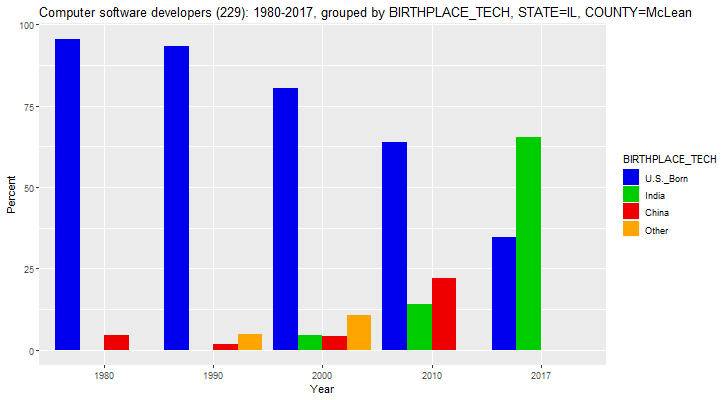
Birthplaces of Computer Software Developers in McLean County, Illinois, percentages, 1980-2017
Computer software developers (229): 1980-2017, grouped by BIRTHPLACE_TECH, STATE=IL, COUNTY=McLean (percent)

  Year           COUNTY Count U.S._Born India China Other
1 1980 McLean County IL   440      95.5    NA   4.5    NA
2 1990 McLean County IL   930      93.2    NA   1.9   4.8
3 2000 McLean County IL 1,218      80.5   4.6   4.3  10.6
4 2010 McLean County IL 1,890      63.9  14.1  22.0    NA
5 2017 McLean County IL 2,872      34.7  65.3    NA    NA

URL parameters (short)=
?minyear=1980&STATE=IL&COUNTY=McLean&geo=COUNTY&occ=Computer%20software%20developers%20(229)&group=BIRTHPLACE_TECH&sortn=4&mincount=100&color=blue2,green3,red2,orange1
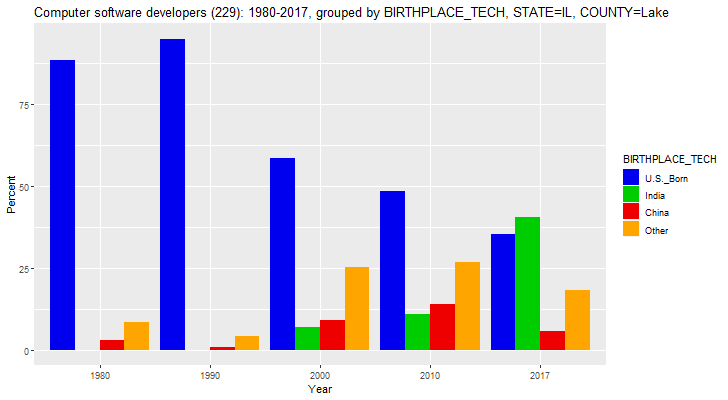
Birthplaces of Computer Software Developers in Lake County, Illinois, percentages, 1980-2017
Computer software developers (229): 1980-2017, grouped by BIRTHPLACE_TECH, STATE=IL, COUNTY=Lake (percent)

  Year         COUNTY Count U.S._Born India China Other
1 1980 Lake County IL   700      88.6    NA   2.9   8.6
2 1990 Lake County IL 1,398      94.8    NA   0.9   4.3
3 2000 Lake County IL 4,259      58.7   7.0   9.0  25.2
4 2010 Lake County IL 3,923      48.3  10.8  14.1  26.7
5 2017 Lake County IL 6,757      35.3  40.5   5.8  18.4

URL parameters (short)=
?minyear=1980&STATE=IL&COUNTY=Lake&geo=COUNTY&occ=Computer%20software%20developers%20(229)&group=BIRTHPLACE_TECH&sortn=4&mincount=100&color=blue2,green3,red2,orange1
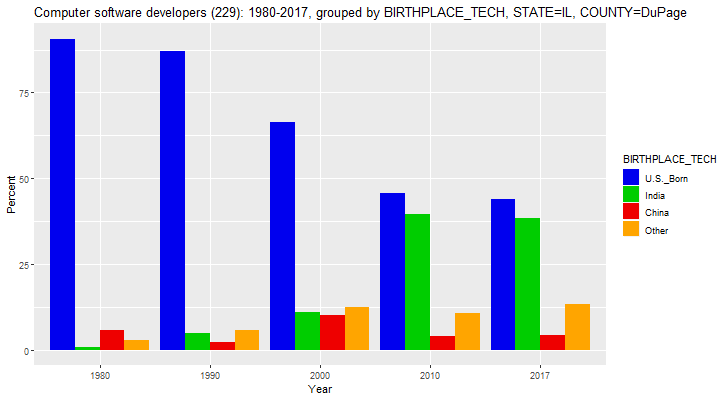
Birthplaces of Computer Software Developers in DuPage County, Illinois, percentages, 1980-2017
Computer software developers (229): 1980-2017, grouped by BIRTHPLACE_TECH, STATE=IL, COUNTY=DuPage (percent)

  Year           COUNTY  Count U.S._Born India China Other
1 1980 DuPage County IL  2,120      90.6   0.9   5.7   2.8
2 1990 DuPage County IL  5,121      86.9   5.0   2.3   5.8
3 2000 DuPage County IL 12,832      66.3  11.1  10.2  12.5
4 2010 DuPage County IL  6,459      45.6  39.7   4.1  10.6
5 2017 DuPage County IL  9,767      44.0  38.4   4.2  13.4

URL parameters (short)=
?minyear=1980&STATE=IL&COUNTY=DuPage&geo=COUNTY&occ=Computer%20software%20developers%20(229)&group=BIRTHPLACE_TECH&sortn=4&mincount=100&color=blue2,green3,red2,orange1
Source for Census Data
U.S. Census Data available at IPUMS USA - using the following default sample from each year :
H-1B and Related Data by State Non-citizen Percentage of Various Occupations by U.S. State H-1B Data OPT Data