H-1B Data
OPT Data
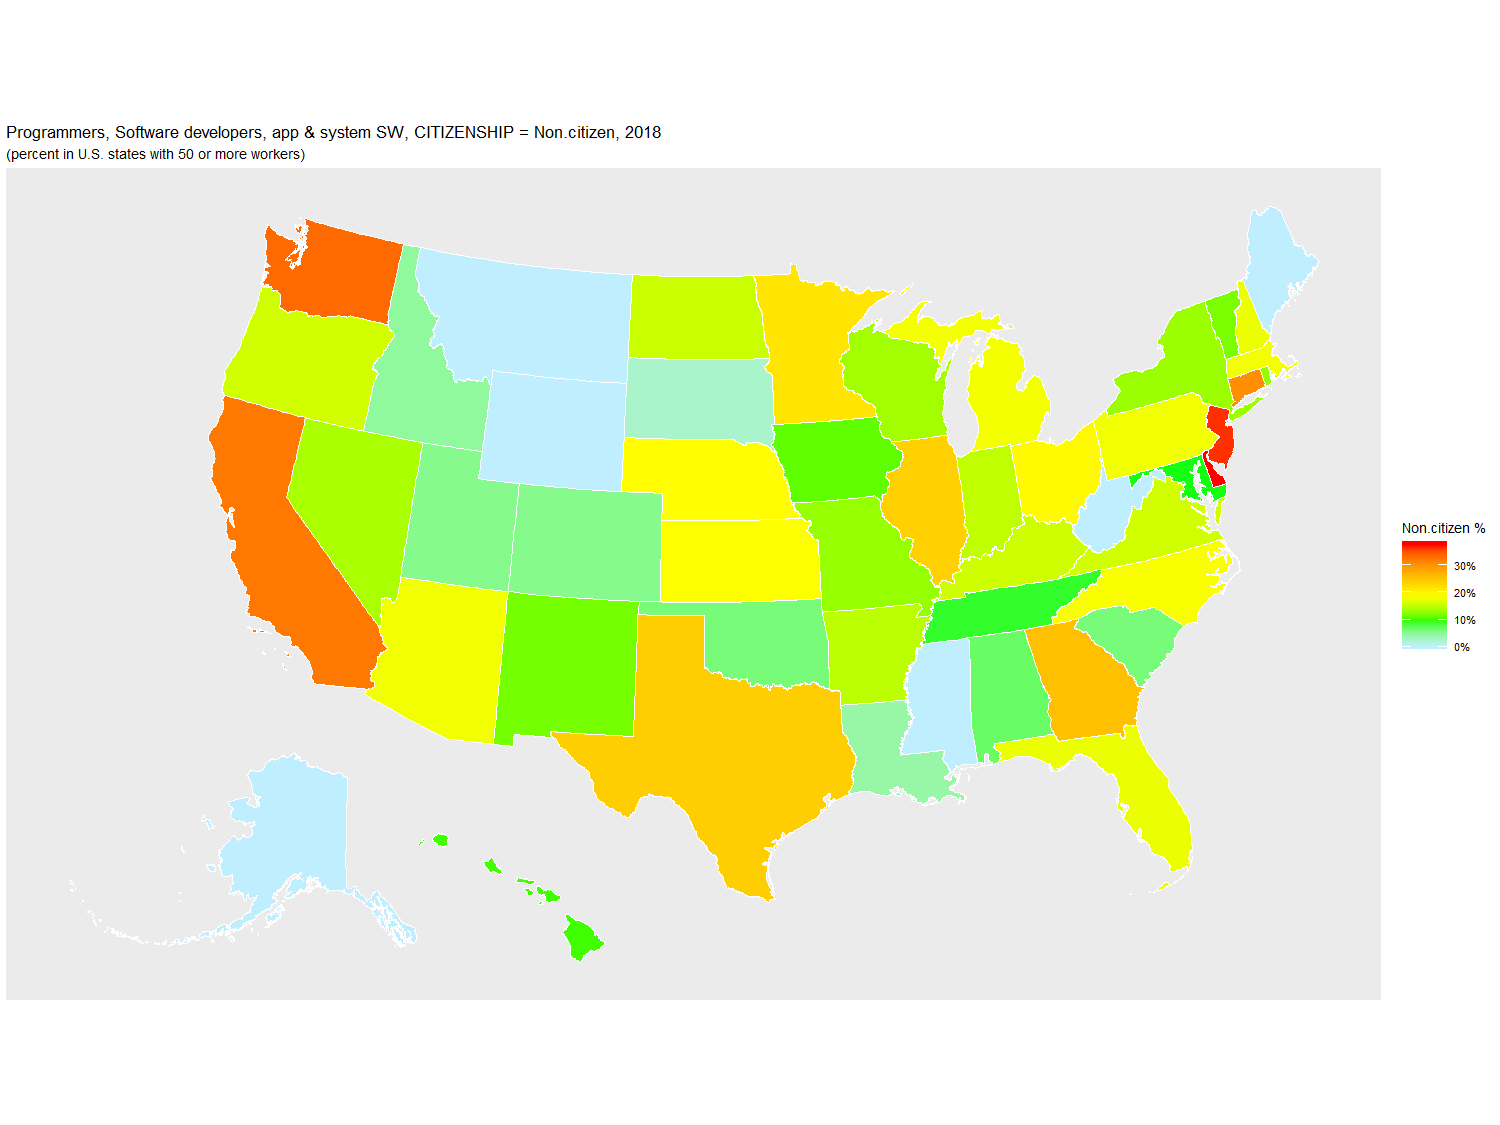
Programmers, Software developers, app & system SW: 2018, grouped by CITIZENSHIP (percent)

   Year STATE   Count Non.citizen Naturalized U.S._Born
1  2018    DE   4,657        37.9        21.7      40.3
2  2018    NJ  78,855        37.0        24.1      39.0
3  2018    WA 106,603        33.5        12.5      54.0
4  2018    CA 342,463        32.3        23.5      44.1
5  2018    CT  23,450        30.5        12.5      57.0
6  2018    GA  54,294        25.6        15.5      58.9
7  2018    TX 133,851        24.2        15.0      60.7
8  2018    IL  72,109        23.9        12.9      63.3
9  2018    MN  38,545        21.8         7.3      70.9
10 2018    OH  45,991        19.5         6.6      73.9
11 2018    NE   8,965        19.2         4.8      76.0
12 2018    KS  15,455        18.9        17.4      63.7
13 2018    NC  51,741        18.6        12.1      69.3
14 2018    MI  40,892        18.3         8.4      73.3
15 2018    MA  77,137        18.2        16.7      65.1
16 2018    AZ  32,230        18.2         6.3      75.5
17 2018    PA  62,355        18.1         9.6      72.3
18 2018    FL  78,800        17.8        16.3      65.9
19 2018    NH  14,787        17.7        11.7      70.6
20 2018    VA  83,874        16.2        17.2      66.6
21 2018    OR  30,393        16.1         9.9      73.9
22 2018    KY  11,354        15.9         5.1      79.0
23 2018    ND   1,770        15.7         0.0      84.3
24 2018    IN  24,331        15.2         6.9      77.9
25 2018    AR   7,578        15.0        10.4      74.6
26 2018    NV   6,672        14.0        11.5      74.4
27 2018    WI  24,794        13.7         3.4      82.9
28 2018    NY  85,884        13.3        18.6      68.1
29 2018    MO  32,577        13.0         5.6      81.4
30 2018    RI   4,268        13.0         5.0      82.0
31 2018    VT   4,014        11.9         9.9      78.2
32 2018    NM   4,125        11.7        12.4      75.9
33 2018    IA  14,065        10.9         0.3      88.7
34 2018    HI   2,898        10.2        11.7      78.1
35 2018    MD  55,323         9.4        15.9      74.8
36 2018    TN  22,383         8.9         4.9      86.2
37 2018    DC   5,954         7.7        14.9      77.4
38 2018    AL  18,416         7.1         3.3      89.6
39 2018    SC  11,909         6.4         7.9      85.7
40 2018    OK   9,665         6.3         5.4      88.3
41 2018    UT  26,901         5.4         6.1      88.4
42 2018    CO  53,524         5.4         7.9      86.7
43 2018    ID   5,418         4.7         0.0      95.3
44 2018    LA   6,830         4.2         6.0      89.8
45 2018    SD   2,289         2.5         0.0      97.5
46 2018    AK   1,406         0.0         0.0     100.0
47 2018    ME   4,294         0.0         0.0     100.0
48 2018    MS   2,625         0.0         0.0     100.0
49 2018    MT   1,926         0.0         0.0     100.0
50 2018    WV   3,077         0.0         0.0     100.0
51 2018    WY      84         0.0         0.0     100.0

URL parameters (short)=
?minyear=2018&maxyear=2018&STATE=&geo=STATE&occ=Programmers,%20Software%20developers,%20app%20&%20system%20SW&group=CITIZENSHIP&sortn=4&mincount=50
Source: Census Bureau, AMERICAN COMMUNITY SURVEY 2018 SAMPLE
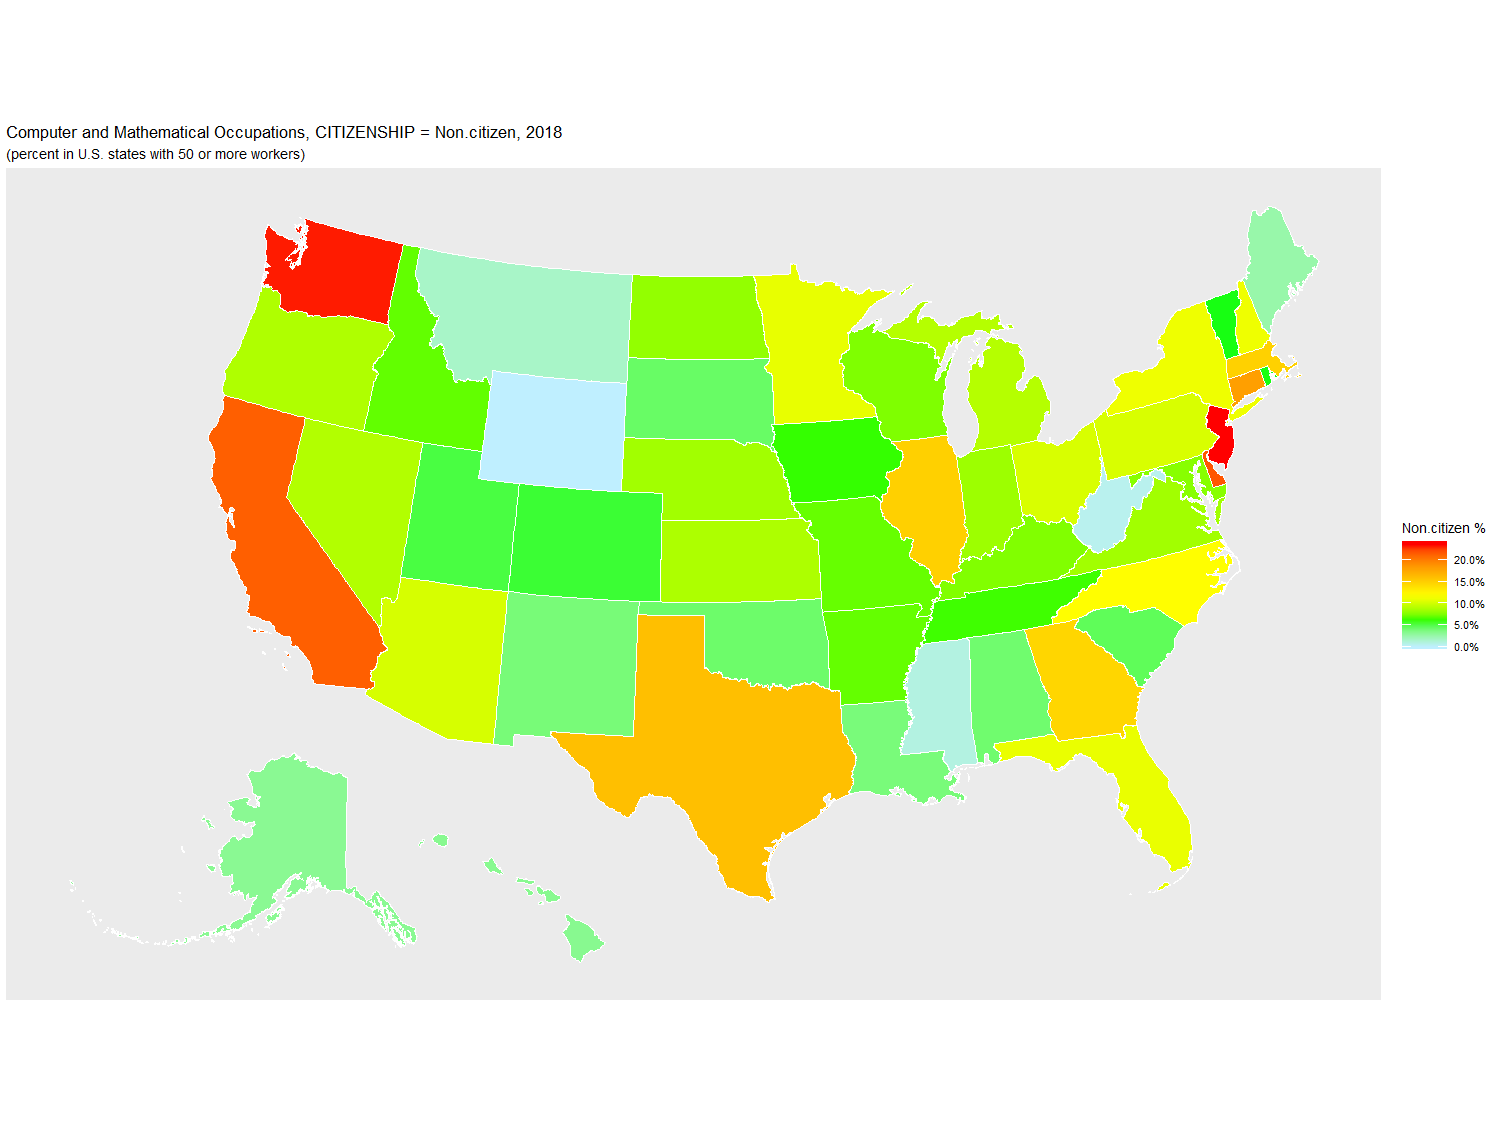
Computer and Mathematical Occupations: 2018, grouped by CITIZENSHIP (percent)

   Year STATE   Count Non.citizen Naturalized U.S._Born
1  2018    NJ 196,578        23.7        22.7      53.6
2  2018    WA 189,073        23.4        11.3      65.3
3  2018    DE  14,282        21.8         7.1      71.1
4  2018    CA 700,309        21.4        21.8      56.8
5  2018    CT  60,243        18.1        12.5      69.4
6  2018    TX 405,809        16.1        11.9      72.0
7  2018    IL 204,427        15.0        11.6      73.4
8  2018    MA 162,764        14.9        14.1      71.0
9  2018    GA 167,792        14.6        11.5      73.9
10 2018    NC 157,585        11.9         8.8      79.3
11 2018    NH  30,849        11.2         8.0      80.7
12 2018    NY 260,648        11.2        18.3      70.5
13 2018    FL 252,058        11.0        16.1      72.9
14 2018    MN 104,544        10.9         6.6      82.4
15 2018    PA 181,481        10.4         6.8      82.8
16 2018    OH 156,990        10.3         4.7      84.9
17 2018    AZ 102,959        10.3         8.1      81.6
18 2018    MI 127,981         9.1         6.9      84.0
19 2018    NV  28,408         9.0         6.8      84.2
20 2018    OR  70,616         8.9         9.0      82.0
21 2018    KS  44,399         8.9         9.4      81.7
22 2018    VA 245,337         8.5        15.6      75.9
23 2018    NE  28,209         8.5         3.4      88.1
24 2018    IN  75,868         8.4         4.4      87.2
25 2018    DC  25,931         8.1         7.2      84.7
26 2018    ND   4,837         8.1         0.0      91.9
27 2018    MD 170,447         7.8        13.6      78.7
28 2018    KY  43,927         7.6         3.0      89.4
29 2018    WI  81,992         7.5         4.5      88.0
30 2018    MO  88,456         7.0         4.6      88.4
31 2018    AR  24,094         6.9         5.8      87.3
32 2018    ID  17,701         6.9         0.3      92.8
33 2018    TN  73,706         6.3         3.7      89.9
34 2018    IA  40,415         6.2         3.7      90.1
35 2018    RI  13,968         5.8         6.2      87.9
36 2018    VT   8,194         5.8        12.5      81.7
37 2018    CO 128,785         5.5         6.3      88.2
38 2018    UT  65,727         5.2         4.8      90.0
39 2018    SC  48,779         4.7         5.6      89.7
40 2018    SD   8,452         4.5         0.0      95.5
41 2018    OK  38,707         4.3         1.9      93.8
42 2018    AL  56,180         4.2         1.9      93.9
43 2018    NM  17,050         3.9         4.4      91.7
44 2018    LA  30,715         3.9         2.7      93.4
45 2018    HI  12,652         3.3         7.2      89.5
46 2018    AK   7,132         3.2         2.5      94.3
47 2018    ME  12,656         2.5         0.9      96.5
48 2018    MT  10,094         1.6         0.9      97.4
49 2018    MS  15,802         0.9         0.7      98.4
50 2018    WV  14,811         0.5         0.7      98.8
51 2018    WY   3,326         0.0         0.0     100.0

URL parameters (short)=
?minyear=2018&maxyear=2018&STATE=&geo=STATE&occ=Computer%20and%20Mathematical%20Occupations&group=CITIZENSHIP&sortn=4&mincount=50
Source: Census Bureau, AMERICAN COMMUNITY SURVEY 2018 SAMPLE
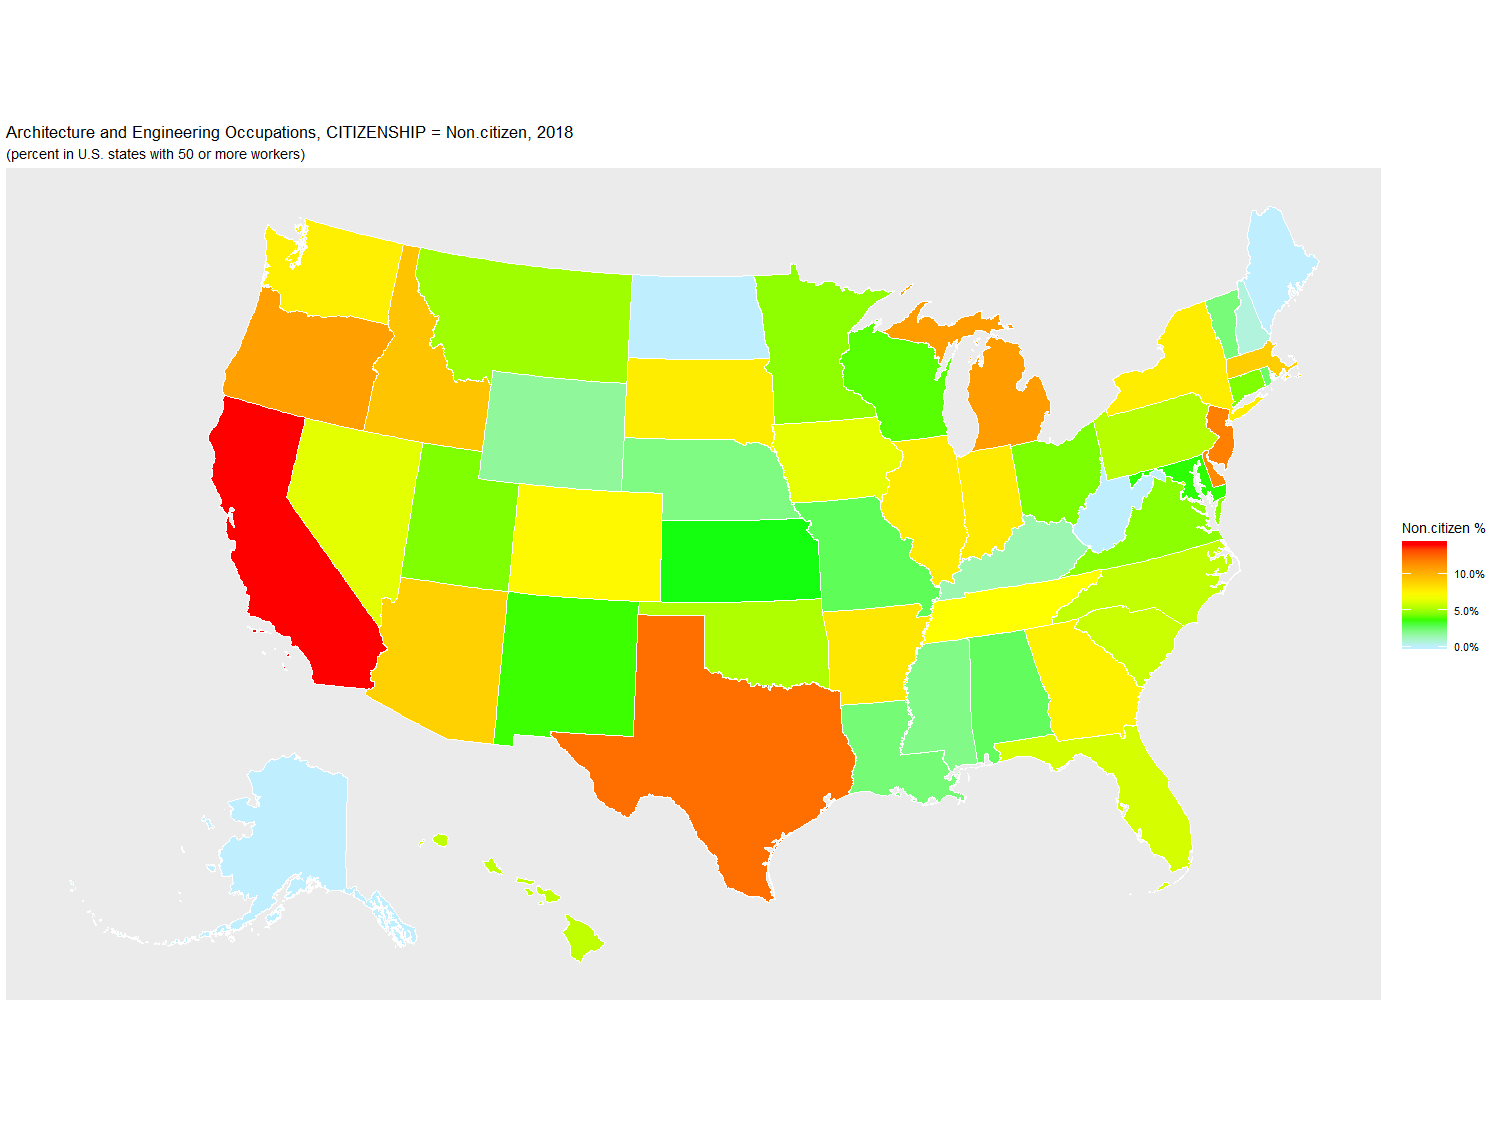
Architecture and Engineering Occupations: 2018, grouped by CITIZENSHIP (percent)

   Year STATE   Count Non.citizen Naturalized U.S._Born
1  2018    CA 427,894        14.1        25.8      60.1
2  2018    TX 251,444        12.3        14.0      73.7
3  2018    NJ  74,757        11.8        20.9      67.3
4  2018    DE   7,205        11.5         3.7      84.9
5  2018    MI 143,223        10.8         9.2      80.0
6  2018    OR  47,623        10.7        10.4      78.8
7  2018    ID  16,086         9.4         3.2      87.4
8  2018    MA  83,425         9.0        11.8      79.2
9  2018    AZ  65,786         8.8        11.2      80.0
10 2018    AR  15,942         7.9         6.9      85.1
11 2018    IL 101,786         7.8        14.8      77.4
12 2018    IN  64,289         7.8         4.5      87.7
13 2018    NY 132,208         7.7        17.2      75.0
14 2018    SD   5,136         7.7         0.0      92.3
15 2018    WA  89,232         7.7        10.4      82.0
16 2018    GA  72,972         7.5        10.1      82.4
17 2018    CO  77,132         7.3         5.5      87.2
18 2018    TN  50,067         7.0         5.2      87.8
19 2018    IA  25,986         6.5         2.7      90.8
20 2018    NV  17,749         6.4        11.2      82.4
21 2018    FL 136,682         6.1        13.6      80.3
22 2018    DC   6,141         6.0        15.1      78.9
23 2018    SC  49,520         5.8         5.2      89.0
24 2018    NC  80,828         5.7         5.0      89.3
25 2018    HI  11,089         5.6         8.0      86.4
26 2018    PA 111,546         5.5         6.3      88.2
27 2018    OK  29,784         5.3         6.2      88.5
28 2018    MT   7,012         5.0         0.9      94.1
29 2018    MN  68,325         4.7         9.4      85.9
30 2018    VA  86,960         4.7        12.3      83.0
31 2018    UT  26,952         4.5         5.5      90.0
32 2018    CT  45,076         4.5         9.9      85.6
33 2018    OH 109,459         4.5         6.1      89.5
34 2018    WI  60,211         4.0         2.2      93.8
35 2018    NM  18,689         3.7         3.8      92.5
36 2018    MD  63,260         3.6        14.0      82.3
37 2018    KS  28,273         3.5         4.1      92.4
38 2018    MO  43,643         2.8         3.8      93.3
39 2018    AL  41,429         2.7         3.3      94.0
40 2018    RI  10,772         2.6        10.4      87.0
41 2018    LA  38,553         2.4         4.2      93.4
42 2018    VT   6,169         2.3         2.4      95.3
43 2018    NE  13,604         2.2         4.9      92.9
44 2018    MS  15,902         2.1         0.2      97.7
45 2018    WY   6,692         1.8         0.0      98.2
46 2018    KY  30,705         1.4         3.6      95.0
47 2018    NH  21,909         0.6         8.5      90.9
48 2018    AK   7,134         0.0         3.2      96.8
49 2018    ME  11,051         0.0         1.1      98.9
50 2018    ND   4,549         0.0         4.9      95.1
51 2018    WV  12,270         0.0         1.6      98.4

URL parameters (short)=
?minyear=2018&maxyear=2018&STATE=&geo=STATE&occ=Architecture%20and%20Engineering%20Occupations&group=CITIZENSHIP&sortn=4&mincount=50
Source: Census Bureau, AMERICAN COMMUNITY SURVEY 2018 SAMPLE
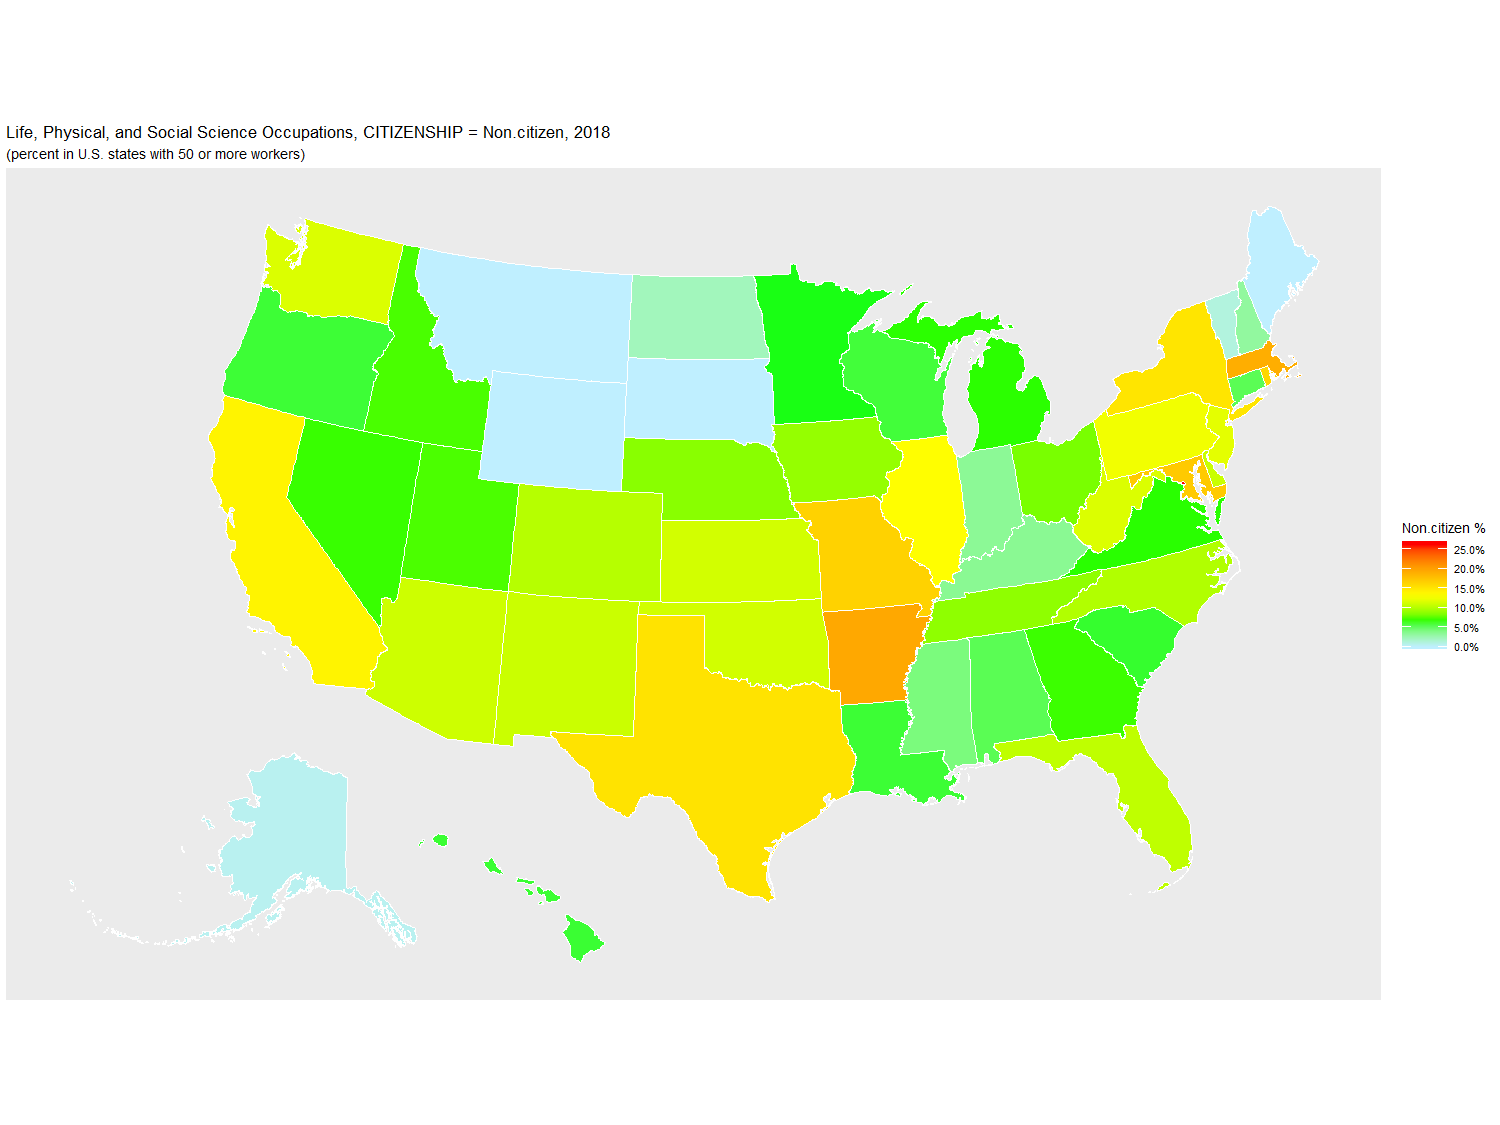
Life, Physical, and Social Science Occupations: 2018, grouped by CITIZENSHIP (percent)

   Year STATE   Count Non.citizen Naturalized U.S._Born
1  2018    DC  14,218        26.3         2.6      71.1
2  2018    AR   7,723        19.5         7.6      72.9
3  2018    MA  70,755        19.1        13.9      67.0
4  2018    MD  59,091        17.1        17.6      65.3
5  2018    MO  25,782        16.5        11.1      72.4
6  2018    RI   5,560        16.1         1.9      82.0
7  2018    TX 103,021        15.2        11.2      73.6
8  2018    NY  94,685        15.1        14.3      70.6
9  2018    CA 211,942        14.0        18.0      68.0
10 2018    IL  54,431        13.3        11.7      75.0
11 2018    PA  62,336        12.6         7.3      80.1
12 2018    NJ  52,025        12.0        22.0      66.0
13 2018    WV   6,457        11.6         0.0      88.4
14 2018    WA  44,654        11.6         6.4      82.0
15 2018    KS  11,096        11.2        14.7      74.0
16 2018    OK  12,505        11.2         2.9      85.9
17 2018    AZ  24,559        11.0         6.0      83.0
18 2018    NM  16,660        10.9         4.0      85.0
19 2018    DE   6,741        10.9        14.9      74.2
20 2018    FL  58,533        10.5        14.8      74.7
21 2018    CO  35,417        10.2         8.4      81.4
22 2018    NC  45,672        10.0         7.7      82.3
23 2018    IA  13,084         9.0         1.2      89.8
24 2018    TN  23,206         8.8         6.9      84.3
25 2018    NE   9,575         8.7        11.9      79.4
26 2018    OH  46,295         8.2         5.0      86.8
27 2018    UT  15,192         7.2         8.7      84.1
28 2018    ID   8,417         7.2         4.6      88.2
29 2018    GA  36,133         7.0         8.7      84.3
30 2018    NV   8,406         6.9        10.9      82.1
31 2018    MI  36,972         6.8         6.0      87.2
32 2018    VA  44,457         6.8         7.3      85.9
33 2018    MN  34,143         6.5         3.4      90.1
34 2018    SC  14,974         6.2         4.1      89.8
35 2018    HI   7,617         6.1         8.3      85.6
36 2018    LA  17,472         6.1         1.2      92.7
37 2018    OR  22,751         6.0         5.5      88.4
38 2018    WI  32,197         6.0         4.3      89.8
39 2018    AL  15,079         5.4        10.9      83.7
40 2018    CT  18,688         5.4         9.8      84.9
41 2018    MS   7,954         4.3         2.1      93.7
42 2018    KY  13,358         3.6         5.7      90.7
43 2018    IN  20,654         3.5        10.4      86.1
44 2018    NH   4,937         3.2         5.6      91.2
45 2018    ND   1,739         2.2         0.0      97.8
46 2018    VT   2,858         1.1         5.0      93.9
47 2018    AK   6,352         0.5         2.7      96.8
48 2018    ME   8,809         0.0         0.9      99.1
49 2018    MT   7,572         0.0         0.5      99.5
50 2018    SD   2,565         0.0         0.0     100.0
51 2018    WY   2,790         0.0         0.0     100.0

URL parameters (short)=
?minyear=2018&maxyear=2018&STATE=&geo=STATE&occ=Life,%20Physical,%20and%20Social%20Science%20Occupations&group=CITIZENSHIP&sortn=4&mincount=50
Source: Census Bureau, AMERICAN COMMUNITY SURVEY 2018 SAMPLE
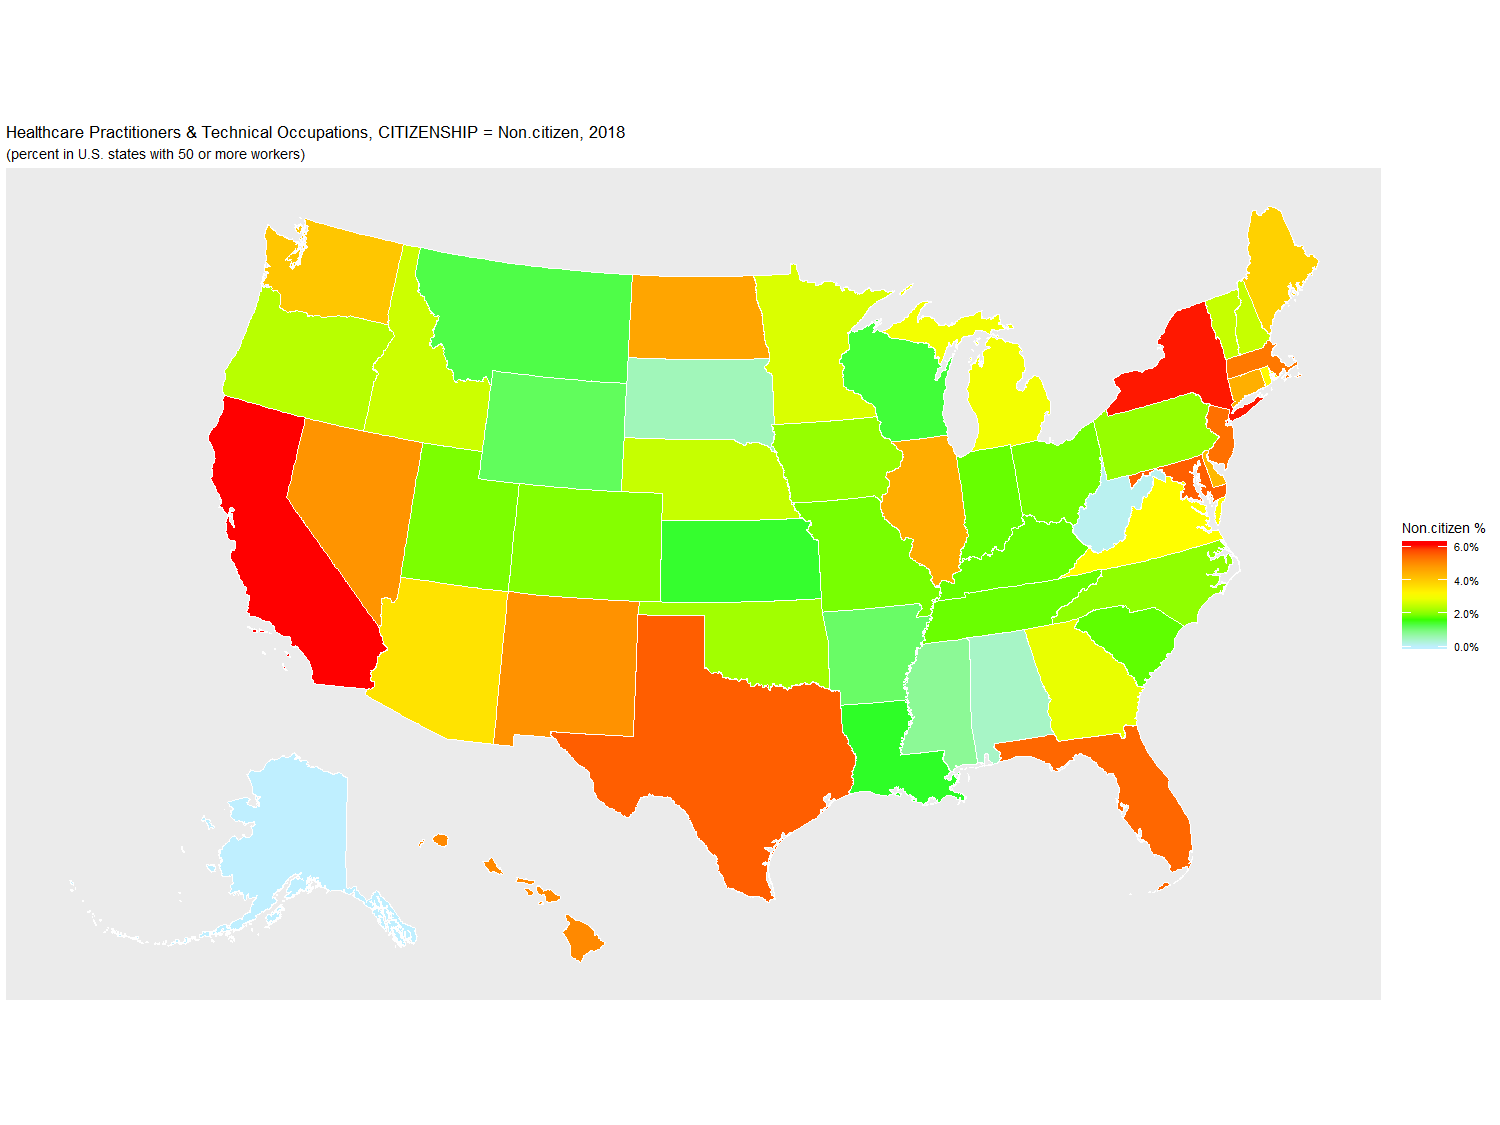
Healthcare Practitioners & Technical Occupations: 2018, grouped by CITIZENSHIP (percent)

   Year STATE   Count Non.citizen Naturalized U.S._Born
1  2018    CA 988,994         6.2        24.9      69.0
2  2018    NY 605,725         6.1        21.7      72.1
3  2018    TX 745,834         5.6        13.8      80.6
4  2018    MD 200,189         5.6        18.5      75.9
5  2018    FL 612,456         5.5        20.5      74.0
6  2018    NJ 280,356         5.4        23.5      71.2
7  2018    MA 260,377         5.3        13.9      80.8
8  2018    HI  38,826         5.0        11.8      83.2
9  2018    NM  47,459         4.9         3.5      91.6
10 2018    NV  66,653         4.9        20.7      74.4
11 2018    ND  34,619         4.6         1.2      94.2
12 2018    IL 381,417         4.5        13.2      82.3
13 2018    CT 116,584         4.5        11.8      83.7
14 2018    DE  30,191         4.3         6.2      89.5
15 2018    WA 197,597         4.1        12.9      83.0
16 2018    ME  45,201         3.9         1.2      94.9
17 2018    AZ 190,508         3.6        11.1      85.4
18 2018    RI  35,055         3.2         8.7      88.2
19 2018    VA 231,990         3.1        11.7      85.2
20 2018    DC  14,389         3.1         9.9      87.1
21 2018    MI 307,532         3.0         7.7      89.3
22 2018    GA 288,441         2.9         9.7      87.5
23 2018    MN 200,958         2.7         5.7      91.5
24 2018    ID  45,988         2.6         3.3      94.2
25 2018    VT  25,237         2.5         5.5      92.0
26 2018    NE  56,887         2.5         1.6      95.9
27 2018    NH  48,417         2.5         7.0      90.5
28 2018    OR 123,492         2.4         7.1      90.5
29 2018    OK 107,938         2.2         5.3      92.5
30 2018    PA 459,957         2.1         6.7      91.1
31 2018    IA  99,881         2.1         4.3      93.5
32 2018    NC 309,633         2.1         5.9      92.1
33 2018    CO 170,385         2.0         6.2      91.7
34 2018    UT  80,577         1.9         5.5      92.6
35 2018    MO 193,469         1.9         4.7      93.4
36 2018    OH 402,987         1.9         4.4      93.7
37 2018    TN 212,147         1.8         4.0      94.2
38 2018    KY 140,982         1.8         1.7      96.5
39 2018    IN 208,496         1.8         3.7      94.4
40 2018    SC 151,006         1.8         4.6      93.6
41 2018    LA 134,717         1.5         2.8      95.7
42 2018    KS  95,205         1.4         4.2      94.4
43 2018    WI 190,718         1.4         3.7      94.9
44 2018    MT  30,656         1.3         2.7      96.0
45 2018    WY  18,389         1.2         0.0      98.8
46 2018    AR  89,814         1.2         1.3      97.5
47 2018    MS  96,079         0.8         2.5      96.7
48 2018    SD  30,380         0.5         4.2      95.3
49 2018    AL 143,092         0.4         2.3      97.2
50 2018    WV  60,519         0.1         2.6      97.3
51 2018    AK  19,894         0.0         8.7      91.3

URL parameters (short)=
?minyear=2018&maxyear=2018&STATE=&geo=STATE&occ=Healthcare%20Practitioners%20&%20Technical%20Occupations&group=CITIZENSHIP&sortn=4&mincount=50
Source: Census Bureau, AMERICAN COMMUNITY SURVEY 2018 SAMPLE
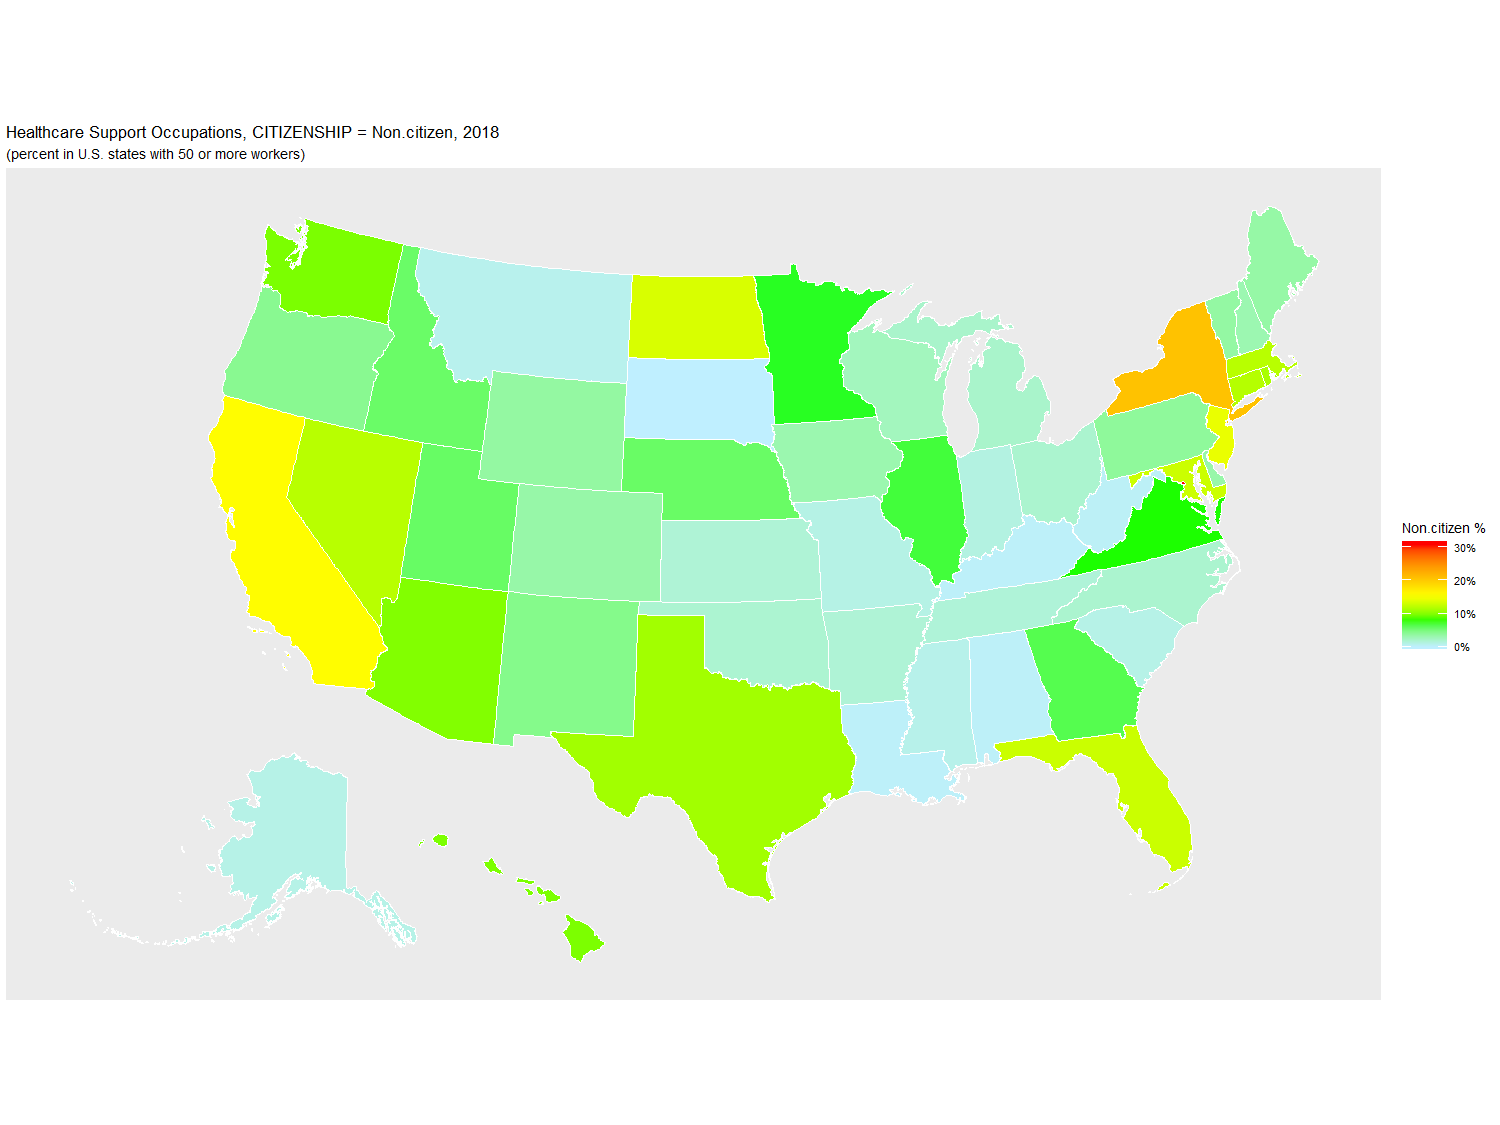
Healthcare Support Occupations: 2018, grouped by CITIZENSHIP (percent)

   Year STATE   Count Non.citizen Naturalized U.S._Born
1  2018    DC   8,845        31.0        15.1      53.9
2  2018    NY 426,563        20.9        29.3      49.8
3  2018    CA 671,200        15.7        24.2      60.0
4  2018    NJ 130,313        14.4        29.3      56.2
5  2018    ND  13,153        13.5         0.6      85.8
6  2018    MD  94,820        12.9        21.6      65.4
7  2018    FL 288,718        12.9        24.6      62.5
8  2018    NV  33,012        12.1        16.0      71.9
9  2018    MA 128,792        12.1        19.4      68.5
10 2018    CT  65,368        11.9        16.3      71.8
11 2018    RI  22,704        11.4        23.4      65.1
12 2018    TX 396,892        11.2         9.8      79.1
13 2018    AZ 105,010        10.0        11.8      78.2
14 2018    HI  19,438         9.8        27.1      63.1
15 2018    WA 132,134         9.7        15.3      75.0
16 2018    VA 112,808         7.9        10.1      82.0
17 2018    MN 108,749         7.5        13.1      79.4
18 2018    IL 198,661         7.0        12.9      80.1
19 2018    GA 111,652         6.5         9.3      84.2
20 2018    UT  41,219         5.9         3.7      90.4
21 2018    NE  34,334         5.8         7.8      86.4
22 2018    ID  25,512         5.8        10.1      84.1
23 2018    NM  35,487         4.5         6.0      89.5
24 2018    OR  81,231         4.3         9.2      86.5
25 2018    PA 235,272         3.9         7.0      89.0
26 2018    WY   7,474         3.6         6.8      89.5
27 2018    VT   9,856         3.6         0.0      96.4
28 2018    ME  23,959         3.5         0.2      96.3
29 2018    CO  78,264         3.4         8.8      87.8
30 2018    DE  15,556         3.4        10.4      86.2
31 2018    IA  51,262         3.2         3.2      93.6
32 2018    NH  22,700         3.1         5.0      92.0
33 2018    WI 111,236         2.6         3.1      94.3
34 2018    MI 176,427         2.1         3.8      94.1
35 2018    OH 192,753         1.9         3.8      94.3
36 2018    NC 145,728         1.9         4.6      93.5
37 2018    OK  53,086         1.8         5.4      92.8
38 2018    AR  44,566         1.6         1.8      96.6
39 2018    KS  42,373         1.6         1.5      96.9
40 2018    TN  81,011         1.5         2.0      96.5
41 2018    IN  93,289         1.2         2.7      96.1
42 2018    MO  91,936         1.0         2.5      96.4
43 2018    SC  66,215         0.9         1.7      97.3
44 2018    AK  12,567         0.9        15.5      83.6
45 2018    MS  37,274         0.8         0.7      98.5
46 2018    MT  14,854         0.7         5.0      94.3
47 2018    WV  28,452         0.3         0.0      99.7
48 2018    AL  50,736         0.3         0.9      98.9
49 2018    KY  59,118         0.2         2.0      97.7
50 2018    LA  72,152         0.2         1.5      98.3
51 2018    SD  13,851         0.0        13.4      86.6

URL parameters (short)=
?minyear=2018&maxyear=2018&STATE=&geo=STATE&occ=Healthcare%20Support%20Occupations&group=CITIZENSHIP&sortn=4&mincount=50
Source: Census Bureau, AMERICAN COMMUNITY SURVEY 2018 SAMPLE
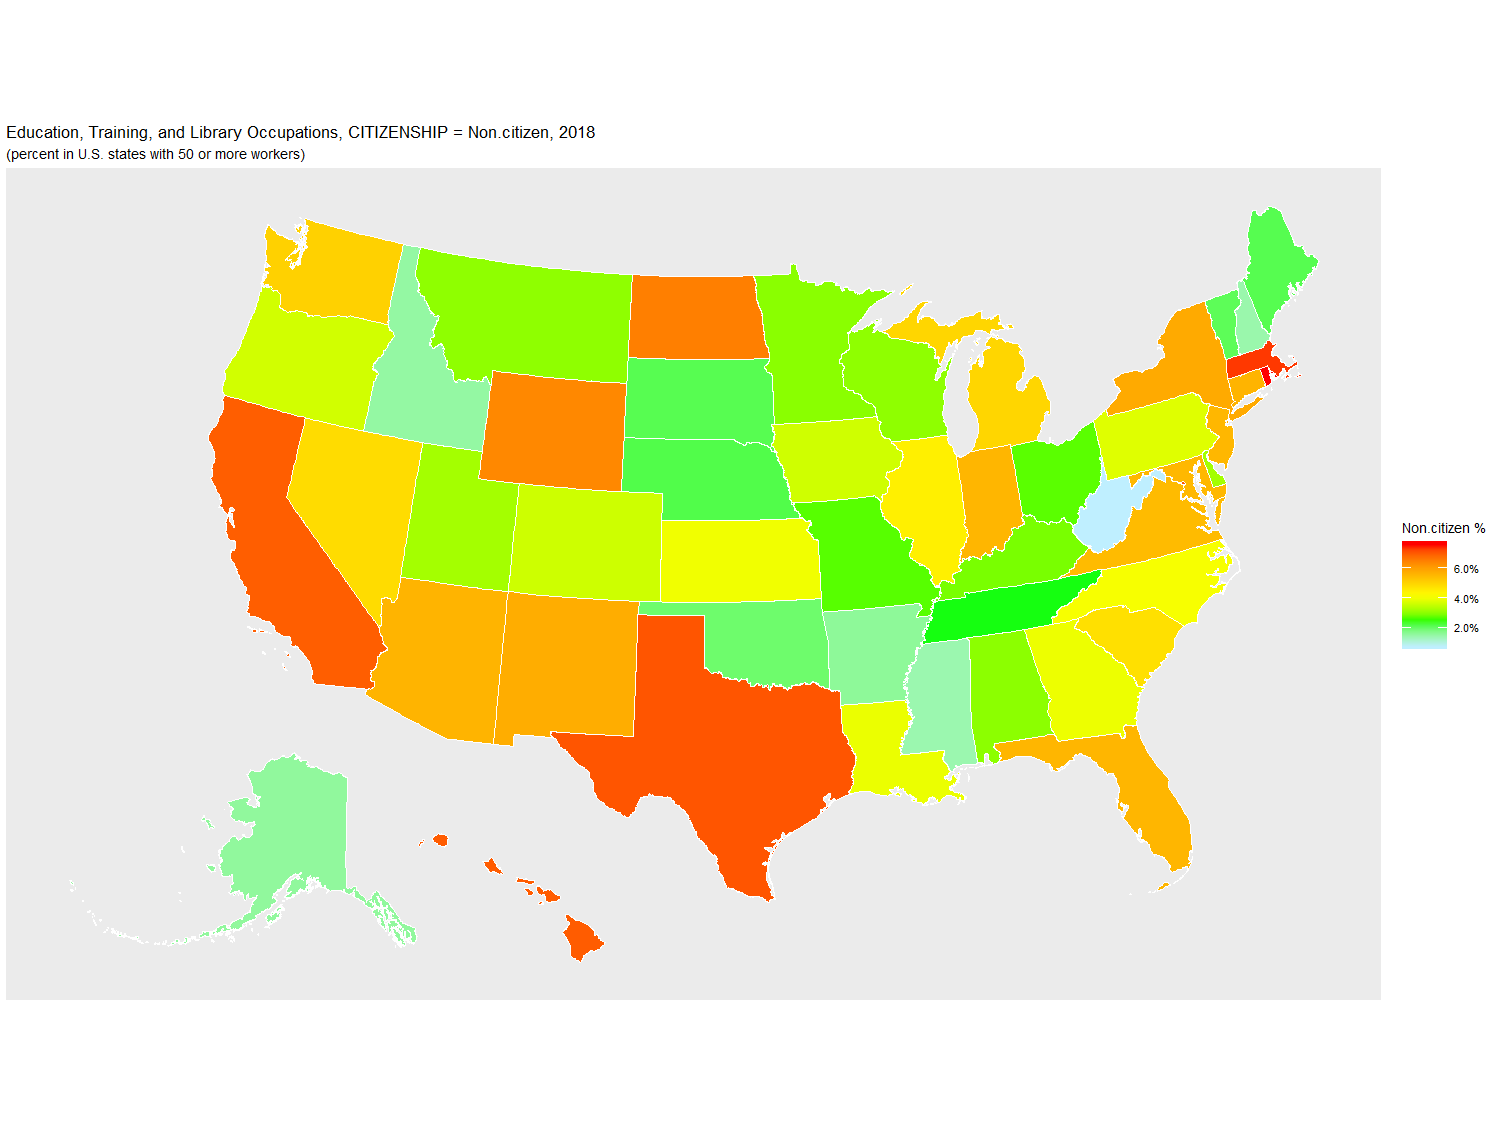
Education, Training, and Library Occupations: 2018, grouped by CITIZENSHIP (percent)

   Year STATE     Count Non.citizen Naturalized U.S._Born
1  2018    RI    39,188         7.6         4.7      87.7
2  2018    MA   268,590         7.4         7.2      85.5
3  2018    TX   827,728         7.1         7.3      85.6
4  2018    DC    25,594         7.1         6.7      86.2
5  2018    HI    43,686         7.0         7.3      85.7
6  2018    CA 1,005,281         7.0        13.1      79.9
7  2018    ND    26,109         6.5         3.5      89.9
8  2018    WY    22,374         6.4         1.6      92.1
9  2018    NY   711,890         5.8        11.9      82.3
10 2018    NM    55,687         5.8         3.7      90.6
11 2018    CT   131,203         5.6         6.1      88.2
12 2018    AZ   176,372         5.6         5.8      88.6
13 2018    FL   496,122         5.6        13.0      81.4
14 2018    IN   173,963         5.6         2.6      91.8
15 2018    NJ   316,763         5.6        12.9      81.5
16 2018    MD   198,469         5.5         8.4      86.1
17 2018    VA   270,727         5.5         7.9      86.6
18 2018    WA   210,994         5.1         6.4      88.6
19 2018    MI   242,053         5.0         4.0      91.0
20 2018    NV    66,057         4.9        10.6      84.5
21 2018    SC   132,446         4.8         2.2      93.0
22 2018    IL   379,118         4.5         5.8      89.7
23 2018    NC   294,410         4.1         3.5      92.4
24 2018    KS   100,044         4.0         1.8      94.2
25 2018    GA   307,361         4.0         5.6      90.4
26 2018    LA   120,769         4.0         1.8      94.2
27 2018    PA   365,381         3.8         4.5      91.7
28 2018    OR   111,687         3.7         4.4      91.9
29 2018    IA   107,671         3.7         3.5      92.9
30 2018    CO   180,521         3.6         4.2      92.1
31 2018    DE    31,773         3.2         3.5      93.2
32 2018    UT   102,338         3.2         1.9      94.8
33 2018    MT    24,951         3.1         1.6      95.3
34 2018    WI   166,841         3.0         2.9      94.1
35 2018    AL   129,239         3.0         1.4      95.6
36 2018    MN   180,948         3.0         5.4      91.6
37 2018    KY   111,842         2.9         1.0      96.2
38 2018    OH   306,598         2.7         3.2      94.1
39 2018    MO   179,770         2.7         2.1      95.2
40 2018    TN   172,634         2.4         1.5      96.0
41 2018    NE    67,092         2.2         5.4      92.4
42 2018    ME    42,346         2.2         1.4      96.5
43 2018    SD    27,843         2.2         0.3      97.6
44 2018    VT    29,331         2.1         2.2      95.7
45 2018    OK   106,084         2.0         1.5      96.5
46 2018    AR    83,584         1.6         1.5      96.9
47 2018    AK    22,333         1.6         7.2      91.2
48 2018    ID    48,636         1.5         2.7      95.8
49 2018    NH    41,650         1.5         3.2      95.4
50 2018    MS    84,132         1.4         1.4      97.2
51 2018    WV    41,692         0.7         1.6      97.6

URL parameters (short)=
?minyear=2018&maxyear=2018&STATE=&geo=STATE&occ=Education,%20Training,%20and%20Library%20Occupations&group=CITIZENSHIP&sortn=4&mincount=50
Source: Census Bureau, AMERICAN COMMUNITY SURVEY 2018 SAMPLE
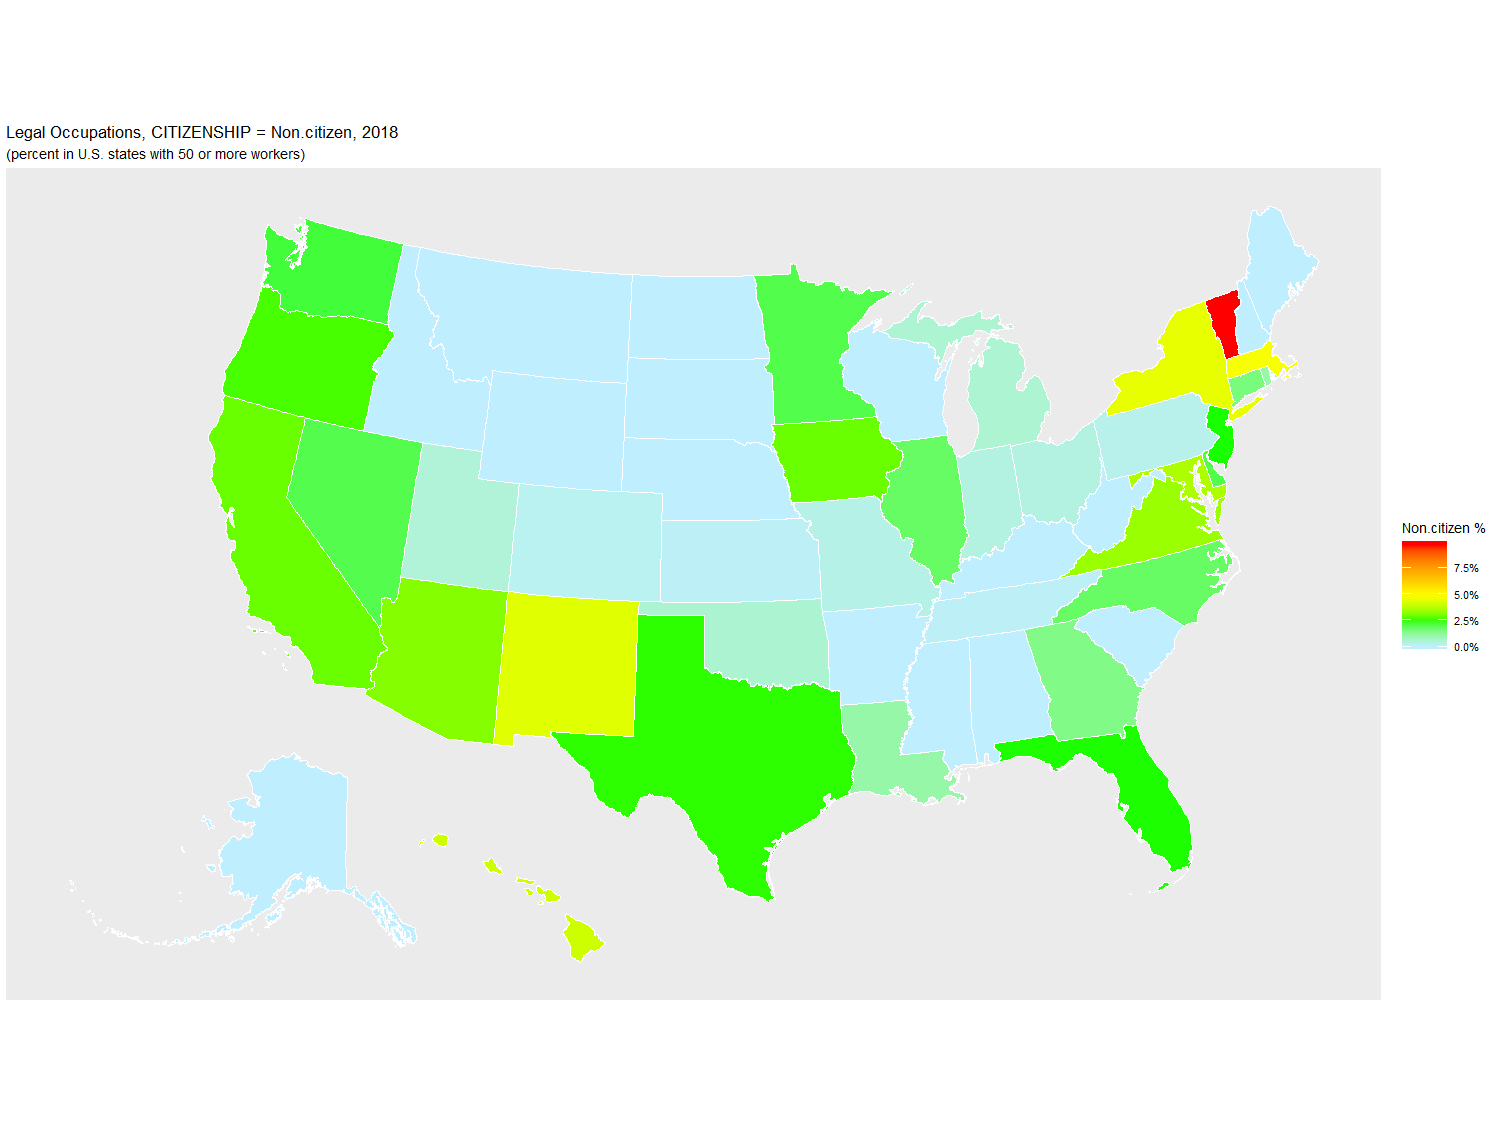
Legal Occupations: 2018, grouped by CITIZENSHIP (percent)

   Year STATE   Count Non.citizen Naturalized U.S._Born
1  2018    VT   4,458         9.8         0.0      90.2
2  2018    MA  50,540         4.7         6.1      89.1
3  2018    NY 159,403         4.5         9.3      86.2
4  2018    NM   9,437         4.4         3.2      92.4
5  2018    HI   4,787         4.1         5.9      90.0
6  2018    DC  23,965         3.7         7.4      88.9
7  2018    MD  52,156         3.6         7.1      89.2
8  2018    VA  67,032         3.4         6.2      90.4
9  2018    AZ  24,819         3.2         4.8      92.0
10 2018    CA 221,050         2.9        10.5      86.6
11 2018    IA  10,635         2.9         0.6      96.5
12 2018    OR  20,307         2.7         3.9      93.4
13 2018    TX 133,982         2.5         5.0      92.5
14 2018    FL 116,751         2.5        10.4      87.1
15 2018    NJ  67,476         2.5         7.8      89.7
16 2018    WA  33,171         2.2         6.6      91.2
17 2018    DE   5,557         2.1         1.0      96.9
18 2018    MN  27,438         2.1         2.3      95.7
19 2018    NV  15,207         2.1         5.4      92.6
20 2018    IL  76,393         1.9         5.0      93.2
21 2018    NC  44,242         1.9         5.5      92.7
22 2018    CT  24,280         1.6         3.9      94.5
23 2018    GA  50,978         1.5         3.1      95.4
24 2018    LA  25,671         1.1         2.6      96.3
25 2018    RI   5,963         1.1         4.1      94.9
26 2018    OK  18,353         0.6         0.0      99.4
27 2018    MI  44,255         0.6         5.6      93.9
28 2018    UT  14,066         0.5         2.6      97.0
29 2018    IN  21,144         0.4         1.6      98.0
30 2018    OH  50,247         0.4         1.6      98.0
31 2018    MO  27,653         0.3         1.8      97.9
32 2018    PA  68,101         0.2         2.9      96.9
33 2018    CO  33,039         0.2         3.6      96.2
34 2018    KS   9,905         0.1         0.0      99.9
35 2018    TN  24,324         0.1         0.8      99.1
36 2018    AK   3,008         0.0         0.0     100.0
37 2018    AL  15,312         0.0         1.0      99.0
38 2018    AR   9,122         0.0         4.3      95.7
39 2018    ID   8,289         0.0         3.6      96.4
40 2018    KY  17,099         0.0         0.6      99.4
41 2018    ME   5,139         0.0         0.0     100.0
42 2018    MS   9,708         0.0         0.0     100.0
43 2018    MT   4,959         0.0         0.0     100.0
44 2018    ND   3,325         0.0         0.0     100.0
45 2018    NE   8,951         0.0         2.8      97.2
46 2018    NH   5,897         0.0         0.0     100.0
47 2018    SC  18,802         0.0         4.5      95.5
48 2018    SD   3,120         0.0         0.0     100.0
49 2018    WI  20,177         0.0         2.0      98.0
50 2018    WV   8,207         0.0         1.0      99.0
51 2018    WY   1,683         0.0         4.5      95.5

URL parameters (short)=
?minyear=2018&maxyear=2018&STATE=&geo=STATE&occ=Legal%20Occupations&group=CITIZENSHIP&sortn=4&mincount=50
Source: Census Bureau, AMERICAN COMMUNITY SURVEY 2018 SAMPLE
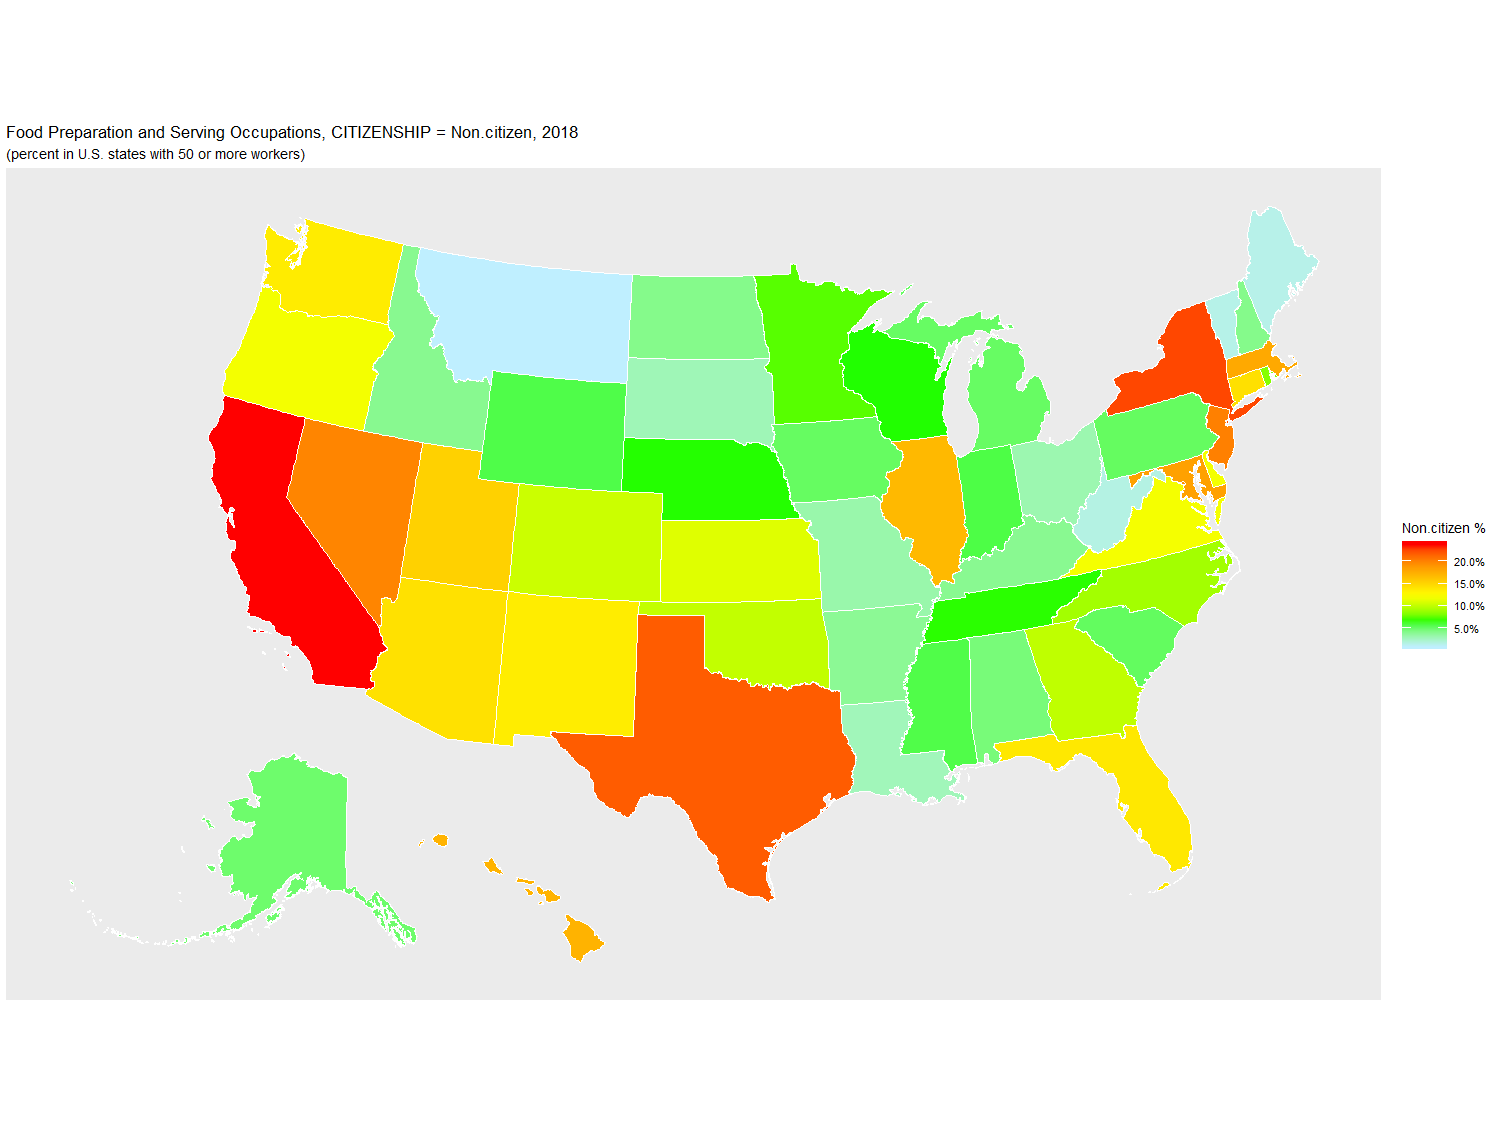
Food Preparation and Serving Occupations: 2018, grouped by CITIZENSHIP (percent)

   Year STATE     Count Non.citizen Naturalized U.S._Born
1  2018    CA 1,078,776        23.9        13.0      63.2
2  2018    NY   514,409        22.6        14.6      62.8
3  2018    TX   781,877        21.8         6.9      71.3
4  2018    NJ   193,392        20.1        13.2      66.7
5  2018    NV   132,793        19.9        17.9      62.2
6  2018    DC    16,639        19.4         5.6      75.0
7  2018    MD   148,975        18.4        10.2      71.4
8  2018    MA   192,538        17.8        11.3      70.9
9  2018    HI    60,710        17.2        14.1      68.7
10 2018    IL   347,869        16.9         7.0      76.1
11 2018    UT    73,311        15.3         3.7      81.0
12 2018    CT    90,072        14.4         5.9      79.7
13 2018    AZ   209,847        14.3         8.5      77.1
14 2018    FL   646,899        13.9        12.7      73.5
15 2018    WA   201,527        13.6         8.0      78.4
16 2018    NM    55,455        13.5         6.9      79.6
17 2018    VA   198,168        12.0         9.1      78.9
18 2018    OR   127,760        11.9         4.3      83.8
19 2018    DE    27,812        11.9         5.6      82.5
20 2018    KS    74,789        11.2         2.5      86.4
21 2018    CO   171,113        10.4         5.2      84.4
22 2018    OK   104,790        10.2         5.0      84.9
23 2018    GA   268,366        10.0         4.2      85.8
24 2018    NC   292,073         9.2         3.7      87.1
25 2018    RI    34,128         8.3         7.4      84.3
26 2018    MN   149,276         7.4         4.4      88.2
27 2018    TN   185,466         6.8         4.4      88.8
28 2018    NE    51,387         6.8         3.0      90.3
29 2018    WI   155,742         6.7         2.4      90.8
30 2018    IN   183,354         5.8         2.9      91.2
31 2018    WY    17,780         5.8         3.8      90.4
32 2018    MS    75,410         5.8         1.3      92.9
33 2018    SC   144,861         5.3         3.0      91.7
34 2018    PA   333,848         5.3         4.3      90.4
35 2018    IA    90,968         5.3         2.8      91.9
36 2018    MI   288,654         5.2         3.5      91.3
37 2018    AK    22,658         5.0        14.1      80.9
38 2018    AL   108,888         4.7         3.8      91.6
39 2018    NH    39,381         4.2         3.8      92.0
40 2018    ND    23,630         4.2         0.6      95.2
41 2018    ID    40,960         4.1         4.1      91.9
42 2018    KY   113,351         4.0         2.7      93.3
43 2018    AR    68,076         3.9         1.1      95.0
44 2018    MO   167,042         3.3         4.4      92.3
45 2018    OH   341,735         3.2         1.8      95.1
46 2018    SD    24,712         3.0         2.0      95.1
47 2018    LA   139,215         2.9         1.8      95.3
48 2018    WV    47,277         1.7         1.1      97.2
49 2018    VT    21,392         1.5         1.7      96.8
50 2018    ME    36,846         1.5         2.7      95.7
51 2018    MT    37,918         0.9         2.8      96.3

URL parameters (short)=
?minyear=2018&maxyear=2018&STATE=&geo=STATE&occ=Food%20Preparation%20and%20Serving%20Occupations&group=CITIZENSHIP&sortn=4&mincount=50
Source: Census Bureau, AMERICAN COMMUNITY SURVEY 2018 SAMPLE
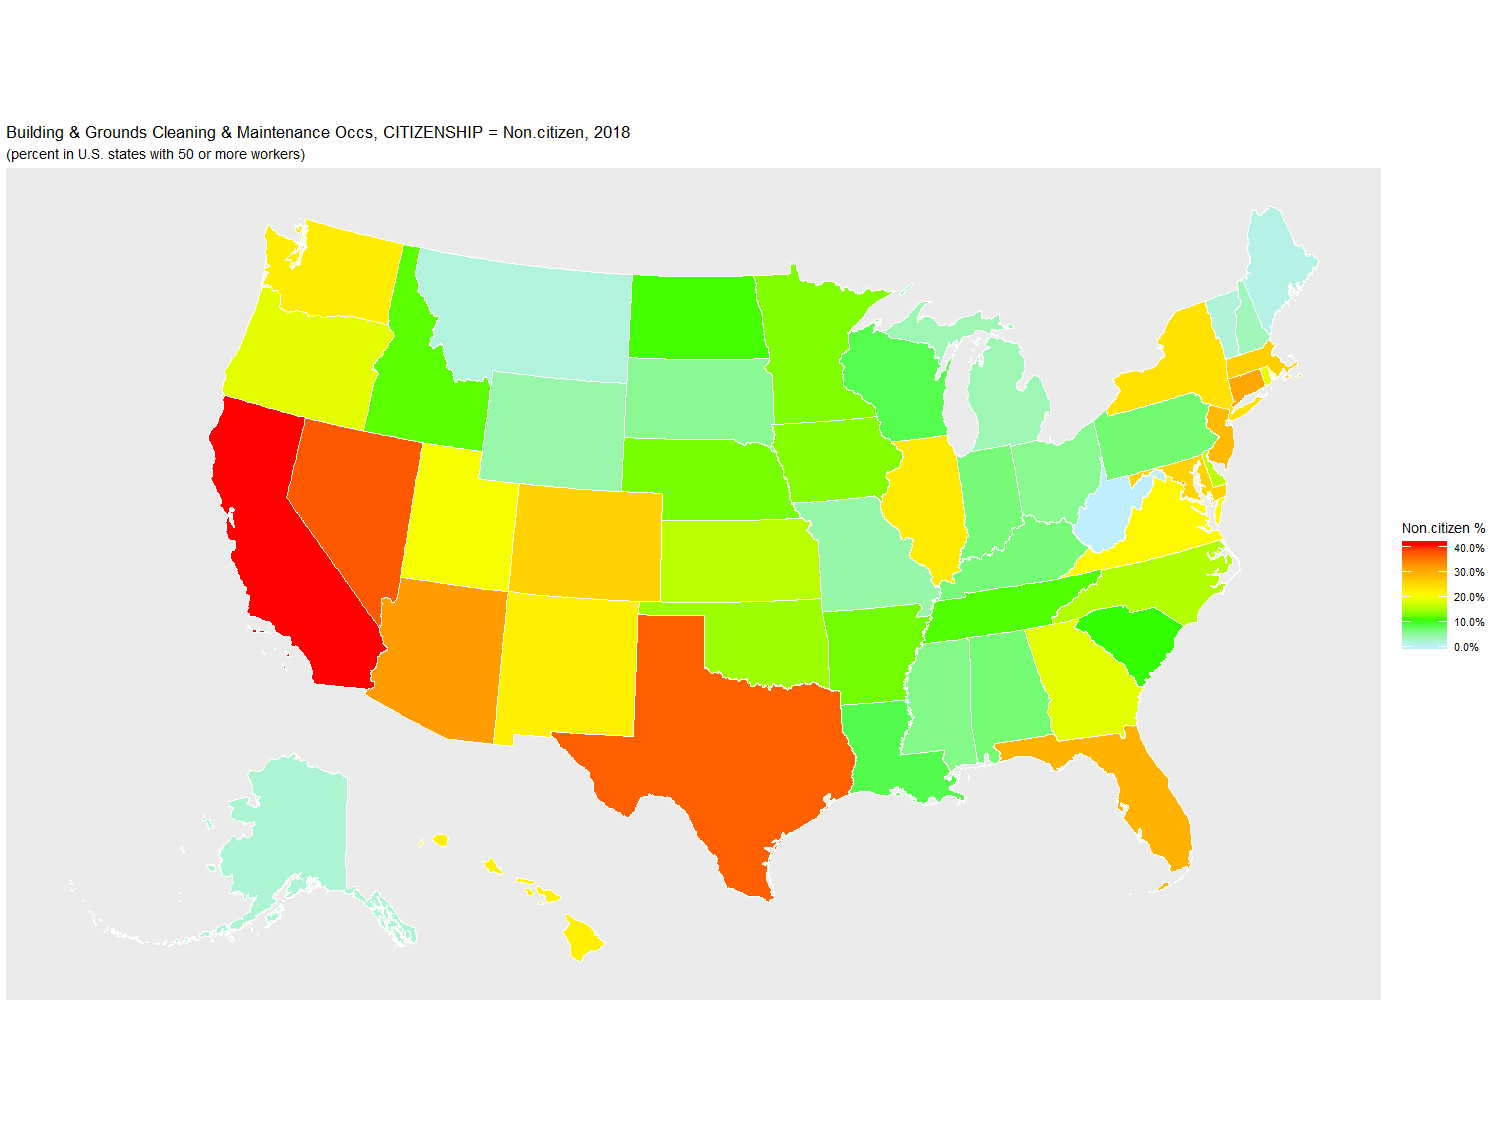
Building & Grounds Cleaning & Maintenance Occs: 2018, grouped by CITIZENSHIP (percent)

   Year STATE   Count Non.citizen Naturalized U.S._Born
1  2018    CA 798,955        41.2        20.9      37.9
2  2018    NV  81,212        37.7        25.3      36.9
3  2018    TX 533,223        37.2        12.2      50.7
4  2018    AZ 156,228        31.9        11.2      56.9
5  2018    DC   8,993        31.6        17.9      50.5
6  2018    CT  71,791        30.7        16.6      52.7
7  2018    FL 476,242        29.5        17.0      53.5
8  2018    NJ 148,781        28.4        24.1      47.5
9  2018    MA 126,184        26.1        18.2      55.7
10 2018    CO  91,754        25.8         9.3      64.9
11 2018    MD 108,090        25.6        13.2      61.2
12 2018    NY 395,862        24.0        22.3      53.6
13 2018    IL 219,322        23.0        12.9      64.1
14 2018    WA 122,385        22.7        11.8      65.5
15 2018    HI  38,957        22.4        24.2      53.4
16 2018    NM  38,114        22.3         4.5      73.2
17 2018    VA 145,025        21.4        10.0      68.6
18 2018    UT  53,472        20.1         7.2      72.7
19 2018    RI  19,131        19.1        15.0      65.8
20 2018    OR  69,147        18.9         9.8      71.3
21 2018    GA 191,337        18.7         6.5      74.8
22 2018    DE  19,764        16.3         5.8      77.9
23 2018    KS  52,087        16.1         6.9      76.9
24 2018    NC 186,072        15.7         4.7      79.5
25 2018    OK  71,628        14.6         6.0      79.4
26 2018    IA  53,696        13.4         4.5      82.1
27 2018    MN  99,705        13.2         8.2      78.6
28 2018    NE  32,843        12.8         7.7      79.5
29 2018    AR  52,264        12.6         4.8      82.6
30 2018    ID  29,436        11.8         8.0      80.3
31 2018    TN 119,430        11.4         2.4      86.2
32 2018    ND  12,670        11.1         0.0      88.9
33 2018    SC 104,040        10.8         3.6      85.6
34 2018    LA  84,431         8.7         3.0      88.4
35 2018    WI  93,027         8.7         4.3      87.0
36 2018    PA 215,555         7.2         7.4      85.4
37 2018    AL  85,786         7.0         0.8      92.2
38 2018    IN 115,191         6.9         1.8      91.4
39 2018    KY  72,893         6.8         3.5      89.7
40 2018    MS  51,152         6.1         1.0      92.9
41 2018    OH 199,521         5.7         3.6      90.7
42 2018    SD  20,228         5.6         5.6      88.8
43 2018    MO  97,417         4.5         4.6      90.9
44 2018    WY   9,899         4.3         0.4      95.3
45 2018    MI 174,979         3.9         3.5      92.6
46 2018    NH  27,276         3.6         4.9      91.5
47 2018    AK  10,768         2.4        27.9      69.7
48 2018    VT  16,262         2.0         7.4      90.6
49 2018    MT  21,578         1.8         3.7      94.6
50 2018    ME  29,268         1.4         8.1      90.5
51 2018    WV  25,459         0.0         0.0     100.0

URL parameters (short)=
?minyear=2018&maxyear=2018&STATE=&geo=STATE&occ=Building%20&%20Grounds%20Cleaning%20&%20Maintenance%20Occs&group=CITIZENSHIP&sortn=4&mincount=50
Source: Census Bureau, AMERICAN COMMUNITY SURVEY 2018 SAMPLE
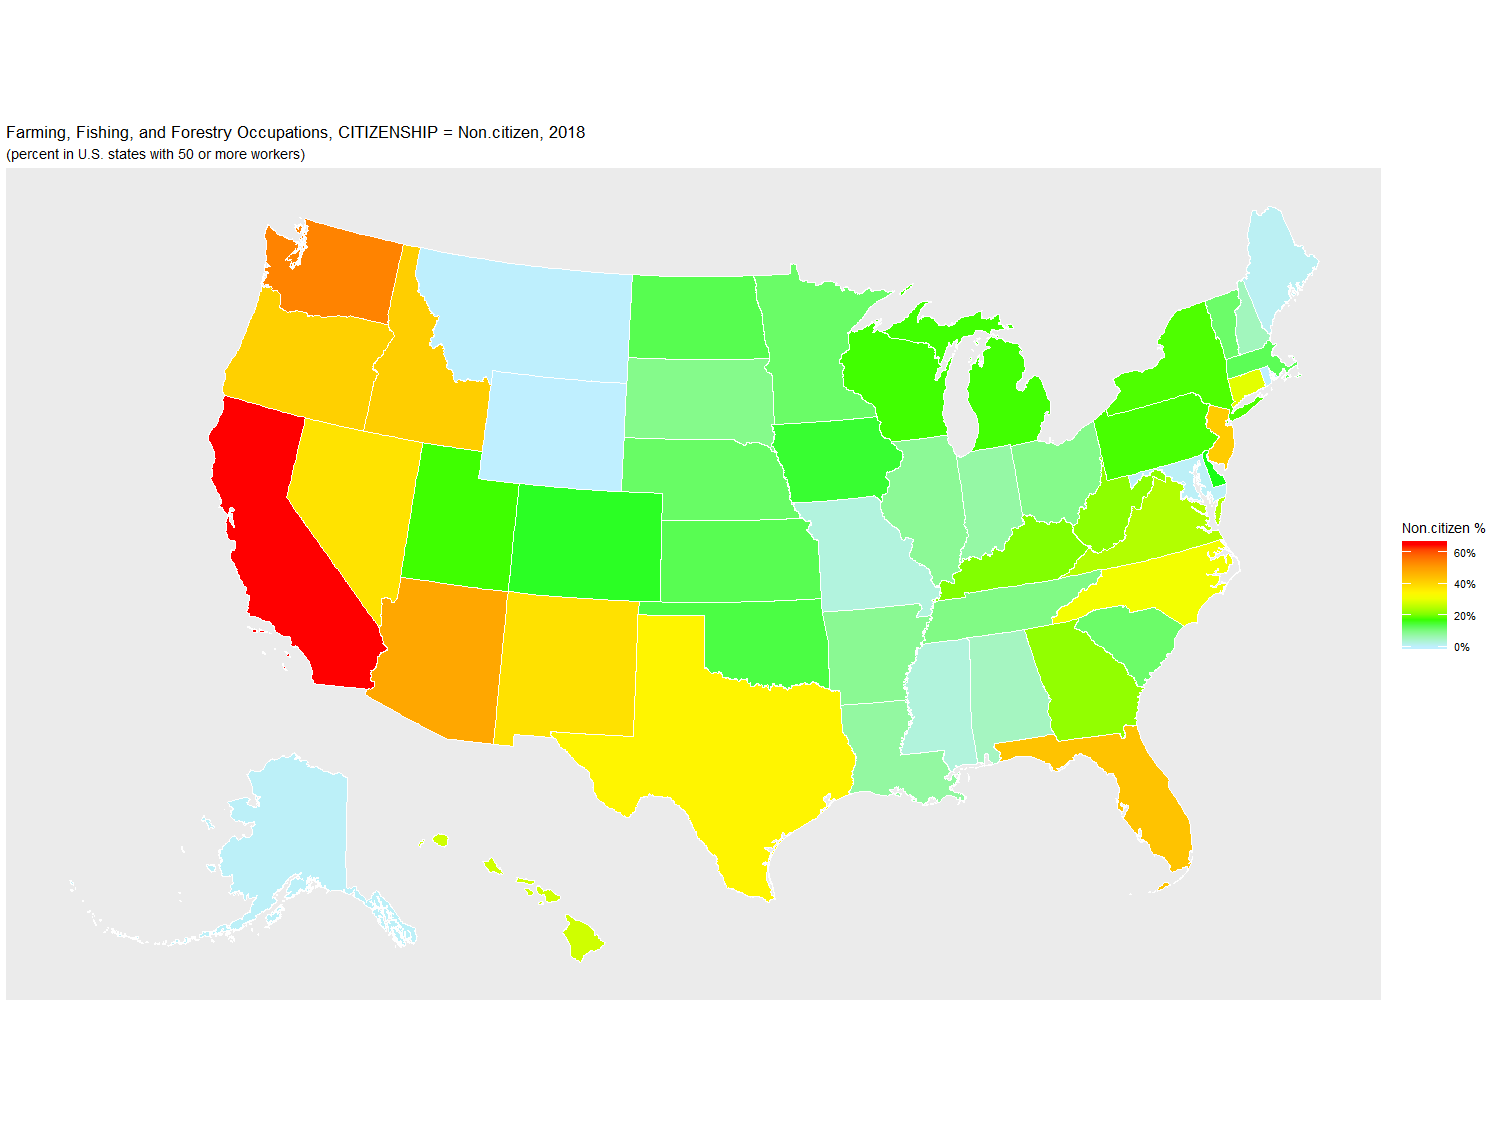
Farming, Fishing, and Forestry Occupations: 2018, grouped by CITIZENSHIP (percent)

   Year STATE   Count Non.citizen Naturalized U.S._Born
1  2018    CA 283,374        65.3        11.7      23.0
2  2018    WA  61,385        54.3        10.4      35.3
3  2018    AZ  16,050        48.7        12.5      38.9
4  2018    FL  58,550        43.6         7.0      49.4
5  2018    NJ   6,941        42.0         5.8      52.2
6  2018    ID  21,247        41.7        14.4      44.0
7  2018    OR  35,408        41.3         9.3      49.4
8  2018    NM   9,322        38.2         8.0      53.8
9  2018    NV   3,048        37.9         9.4      52.7
10 2018    TX  59,737        34.6         8.5      56.9
11 2018    NC  32,373        31.4         4.5      64.1
12 2018    CT   2,976        29.7         0.0      70.3
13 2018    HI   6,404        27.6        22.5      49.9
14 2018    VA  13,776        24.9         2.9      72.2
15 2018    GA  24,800        22.2         6.9      70.9
16 2018    WV   4,354        21.8         0.0      78.2
17 2018    KY  13,932        21.0         0.0      79.0
18 2018    NY  25,021        18.0         5.1      76.8
19 2018    PA  27,508        17.8         1.7      80.5
20 2018    WI  27,826        17.5         1.0      81.5
21 2018    MI  24,841        17.5         2.4      80.0
22 2018    UT   5,406        17.4         1.1      81.4
23 2018    DE   2,661        16.0        14.7      69.2
24 2018    CO  12,886        15.6         6.0      78.3
25 2018    IA  17,969        15.2         2.6      82.2
26 2018    OK  14,525        14.3         4.6      81.1
27 2018    ND   5,578        13.6         0.0      86.4
28 2018    KS  14,875        13.5         2.7      83.8
29 2018    MA   6,576        13.2         3.4      83.3
30 2018    NE  15,228        12.3         4.1      83.6
31 2018    MN  25,170        12.1         3.7      84.1
32 2018    VT   5,460        12.0         0.0      88.0
33 2018    SC   9,563        12.0         5.8      82.2
34 2018    TN   9,890        10.0         2.7      87.3
35 2018    SD   6,920         9.5         1.3      89.1
36 2018    OH  17,156         9.5         3.6      86.9
37 2018    AR  17,315         8.9         0.0      91.1
38 2018    IL  19,871         8.6         3.2      88.2
39 2018    LA  11,367         7.7         8.2      84.1
40 2018    IN  13,005         7.4         0.5      92.0
41 2018    NH   3,597         5.5         0.0      94.5
42 2018    AL   9,512         5.1         1.8      93.1
43 2018    MS   9,933         2.9         0.2      96.8
44 2018    MO  19,525         2.8         0.2      97.0
45 2018    ME   8,896         1.0         0.0      99.0
46 2018    MD   6,428         0.7         8.2      91.1
47 2018    AK   2,825         0.6         2.5      96.8
48 2018    MT   9,494         0.2         7.8      92.0
49 2018    DC     340         0.0         0.0     100.0
50 2018    RI   1,302         0.0         0.0     100.0
51 2018    WY   4,043         0.0         0.2      99.8

URL parameters (short)=
?minyear=2018&maxyear=2018&STATE=&geo=STATE&occ=Farming,%20Fishing,%20and%20Forestry%20Occupations&group=CITIZENSHIP&sortn=4&mincount=50
Source: Census Bureau, AMERICAN COMMUNITY SURVEY 2018 SAMPLE
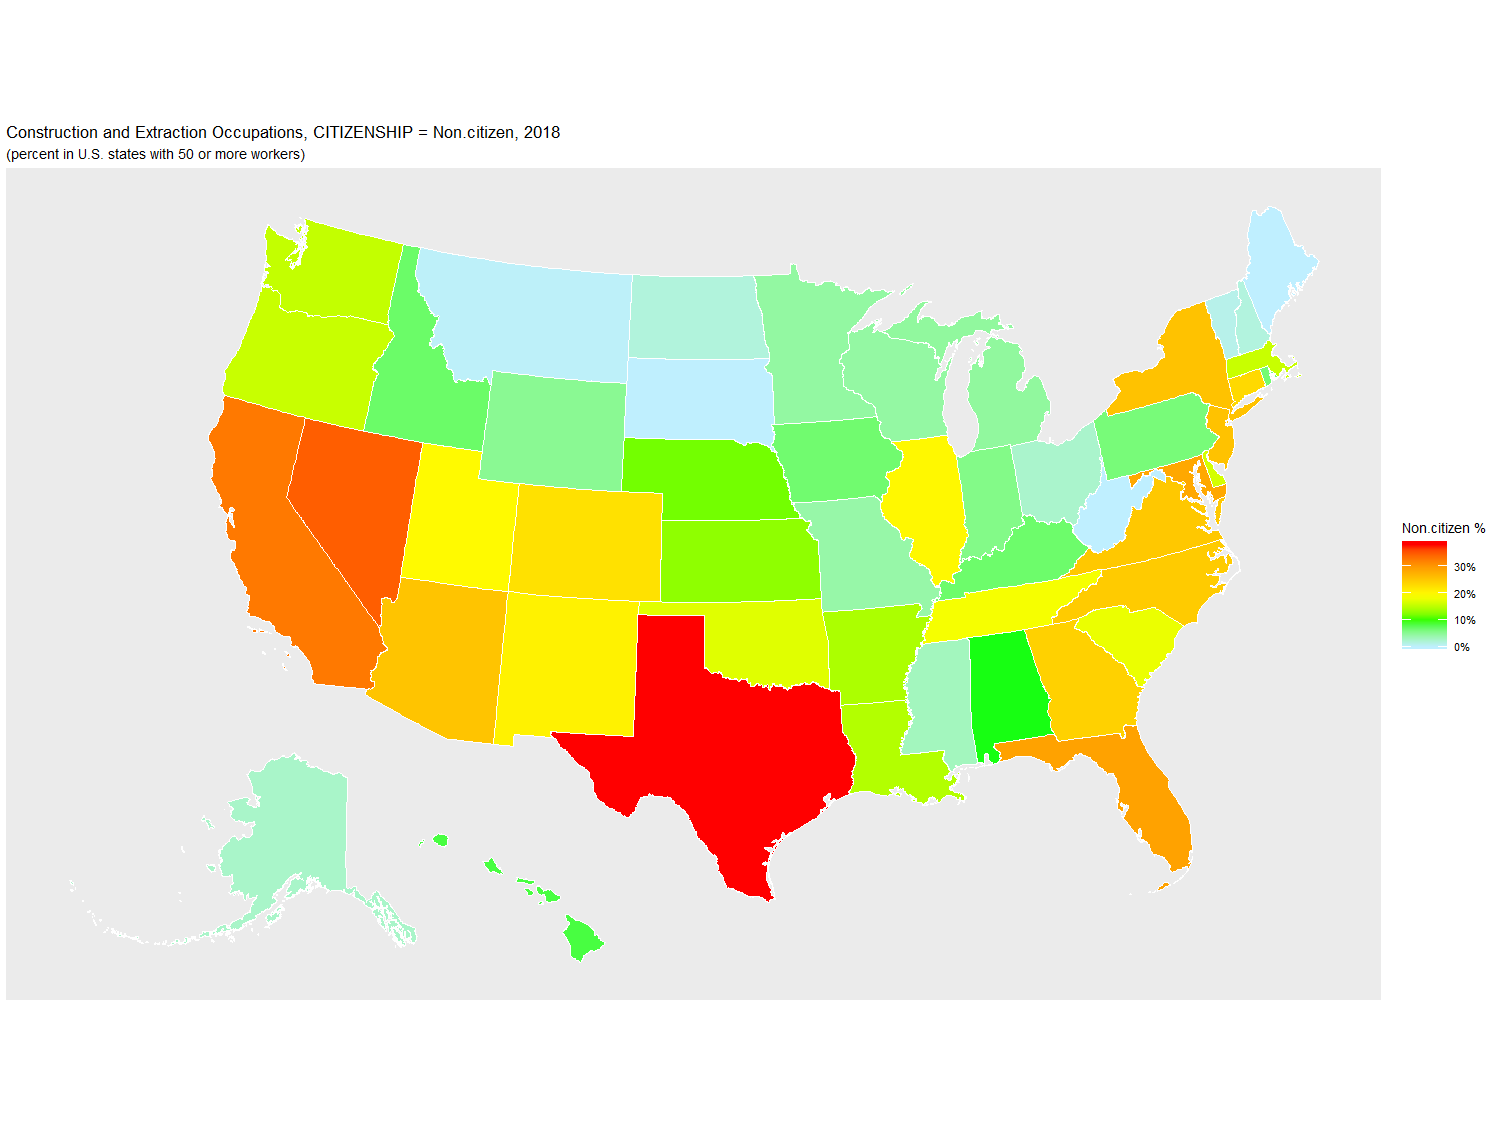
Construction and Extraction Occupations: 2018, grouped by CITIZENSHIP (percent)

   Year STATE   Count Non.citizen Naturalized U.S._Born
1  2018    TX 905,828        38.3         8.2      53.5
2  2018    NV  79,503        34.7         8.8      56.5
3  2018    CA 934,158        32.7        13.6      53.8
4  2018    FL 544,677        29.0        13.9      57.0
5  2018    MD 148,008        28.5         8.8      62.7
6  2018    NY 426,932        25.7        14.5      59.8
7  2018    NJ 203,281        25.7        14.2      60.1
8  2018    AZ 163,901        25.5         9.3      65.1
9  2018    VA 213,649        25.1         8.0      66.9
10 2018    NC 240,010        24.8         3.3      71.9
11 2018    GA 249,545        24.1         6.3      69.6
12 2018    CT  78,018        23.3         7.3      69.4
13 2018    DC   6,606        22.6         9.2      68.1
14 2018    CO 161,007        22.4         7.8      69.8
15 2018    NM  52,147        20.6         4.6      74.8
16 2018    IL 265,239        19.9         8.4      71.7
17 2018    UT  88,076        19.7         4.5      75.8
18 2018    TN 161,413        18.6         1.2      80.2
19 2018    SC 113,620        17.9         2.7      79.4
20 2018    OK 100,339        17.2         3.9      78.9
21 2018    DE  23,605        16.5         2.5      81.0
22 2018    OR  94,272        15.8         4.8      79.4
23 2018    MA 154,684        15.8         8.5      75.7
24 2018    WA 179,713        15.5         6.4      78.1
25 2018    LA 132,170        14.7         2.6      82.8
26 2018    AR  68,475        14.3         3.0      82.7
27 2018    KS  70,141        12.9         5.4      81.7
28 2018    NE  52,185        11.7         3.7      84.6
29 2018    AL 105,005         9.4         0.8      89.7
30 2018    HI  40,155         8.5        11.7      79.9
31 2018    ID  45,943         7.1         1.5      91.4
32 2018    KY  88,064         7.0         1.3      91.7
33 2018    IA  75,295         6.8         2.2      91.0
34 2018    RI  22,272         6.7         8.2      85.2
35 2018    PA 273,190         6.4         2.3      91.3
36 2018    IN 148,222         5.7         3.7      90.6
37 2018    WY  22,296         5.2         1.0      93.8
38 2018    MI 204,223         4.7         3.6      91.8
39 2018    MN 125,170         4.5         2.5      93.0
40 2018    WI 134,655         4.4         1.9      93.7
41 2018    MO 149,576         4.2         1.3      94.5
42 2018    MS  60,337         3.2         0.8      96.0
43 2018    AK  17,943         2.6         4.7      92.7
44 2018    OH 224,674         2.5         2.1      95.4
45 2018    ND  21,936         1.7         1.7      96.6
46 2018    NH  35,547         1.6         3.1      95.3
47 2018    VT  17,683         1.0         3.8      95.2
48 2018    MT  28,621         0.3         2.0      97.7
49 2018    SD  23,435         0.0         2.4      97.6
50 2018    ME  34,458         0.0         2.6      97.4
51 2018    WV  36,997         0.0         0.5      99.5

URL parameters (short)=
?minyear=2018&maxyear=2018&STATE=&geo=STATE&occ=Construction%20and%20Extraction%20Occupations&group=CITIZENSHIP&sortn=4&mincount=50
Source: Census Bureau, AMERICAN COMMUNITY SURVEY 2018 SAMPLE
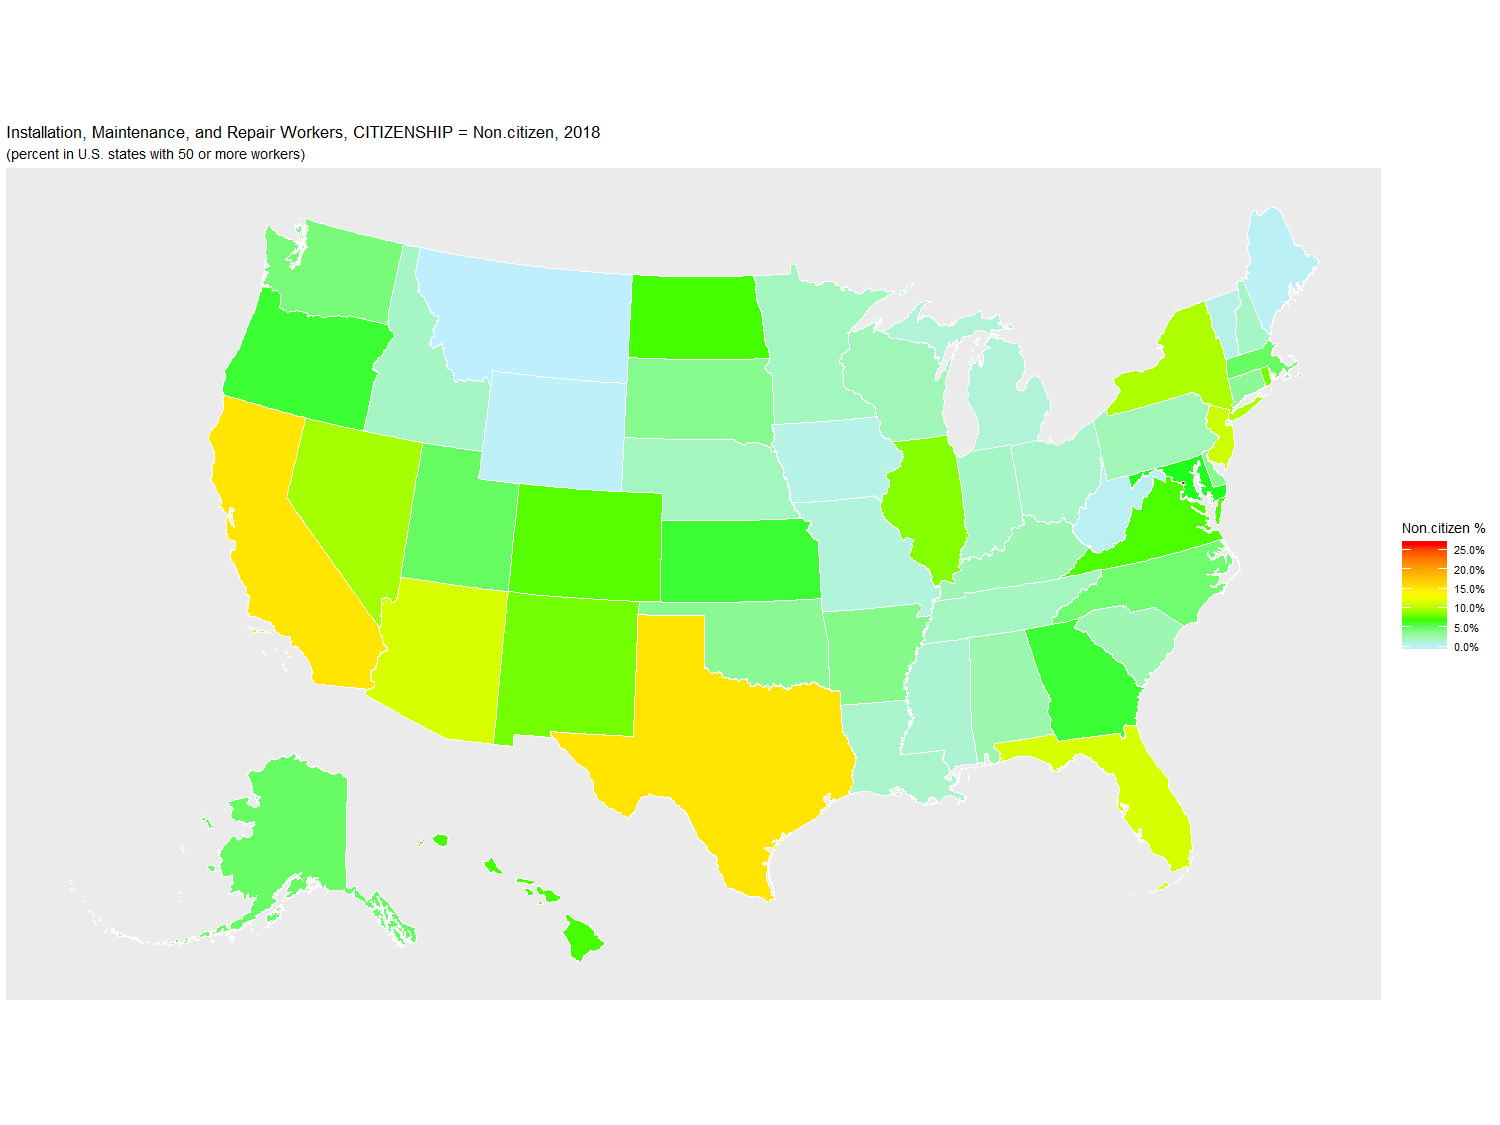
Installation, Maintenance, and Repair Workers: 2018, grouped by CITIZENSHIP (percent)

   Year STATE   Count Non.citizen Naturalized U.S._Born
1  2018    DC   3,012        26.5         1.4      72.1
2  2018    TX 470,747        15.2         8.0      76.8
3  2018    CA 487,533        15.2        18.4      66.4
4  2018    AZ 105,222        11.6         7.2      81.2
5  2018    FL 326,865        11.5        15.7      72.8
6  2018    NJ 121,578        11.1        14.0      75.0
7  2018    NY 214,720         9.9        14.7      75.4
8  2018    NV  42,505         9.6        11.0      79.4
9  2018    IL 161,368         8.6         8.3      83.2
10 2018    RI  10,710         8.1         3.1      88.8
11 2018    NM  37,693         8.1         5.8      86.1
12 2018    CO  86,049         7.5         4.2      88.4
13 2018    VA 132,872         7.3         7.3      85.4
14 2018    HI  22,299         7.2         9.9      82.9
15 2018    ND  16,432         7.1         0.1      92.7
16 2018    MD  85,017         6.5        11.8      81.8
17 2018    KS  52,566         6.1         3.4      90.5
18 2018    OR  55,526         6.1         5.8      88.1
19 2018    GA 164,818         6.1         6.4      87.5
20 2018    UT  45,419         5.1         5.3      89.6
21 2018    MA  76,449         5.1        10.4      84.6
22 2018    AK  16,031         5.0         5.7      89.3
23 2018    NC 169,110         4.7         3.2      92.1
24 2018    WA 119,001         4.4         8.9      86.7
25 2018    AR  46,785         3.9         1.6      94.5
26 2018    SD  13,850         3.8         0.0      96.2
27 2018    DE  14,297         3.8         0.6      95.6
28 2018    OK  73,327         3.6         1.3      95.1
29 2018    CT  49,203         3.5         6.9      89.6
30 2018    AL  83,869         2.7         1.8      95.4
31 2018    SC  91,546         2.6         1.3      96.1
32 2018    KY  67,302         2.5         0.8      96.7
33 2018    PA 193,696         2.4         3.1      94.4
34 2018    WI 102,430         2.4         2.3      95.3
35 2018    MN  77,253         2.2         3.4      94.3
36 2018    NE  33,218         2.2         0.4      97.4
37 2018    TN  98,536         2.1         1.6      96.4
38 2018    NH  23,363         2.0         3.7      94.3
39 2018    ID  28,706         2.0         5.9      92.1
40 2018    IN 113,347         2.0         1.6      96.4
41 2018    LA  80,620         1.8         1.8      96.4
42 2018    OH 167,467         1.7         1.9      96.4
43 2018    MS  50,882         1.6         1.0      97.5
44 2018    MI 130,673         1.3         2.7      96.0
45 2018    MO  85,275         1.2         1.8      97.0
46 2018    IA  51,462         0.8         1.4      97.7
47 2018    VT  10,133         0.8         0.0      99.2
48 2018    WV  25,375         0.4         0.0      99.6
49 2018    ME  25,013         0.3         1.4      98.3
50 2018    WY  11,674         0.2         0.0      99.8
51 2018    MT  20,317         0.0         0.3      99.7

URL parameters (short)=
?minyear=2018&maxyear=2018&STATE=&geo=STATE&occ=Installation,%20Maintenance,%20and%20Repair%20Workers&group=CITIZENSHIP&sortn=4&mincount=50
Source: Census Bureau, AMERICAN COMMUNITY SURVEY 2018 SAMPLE
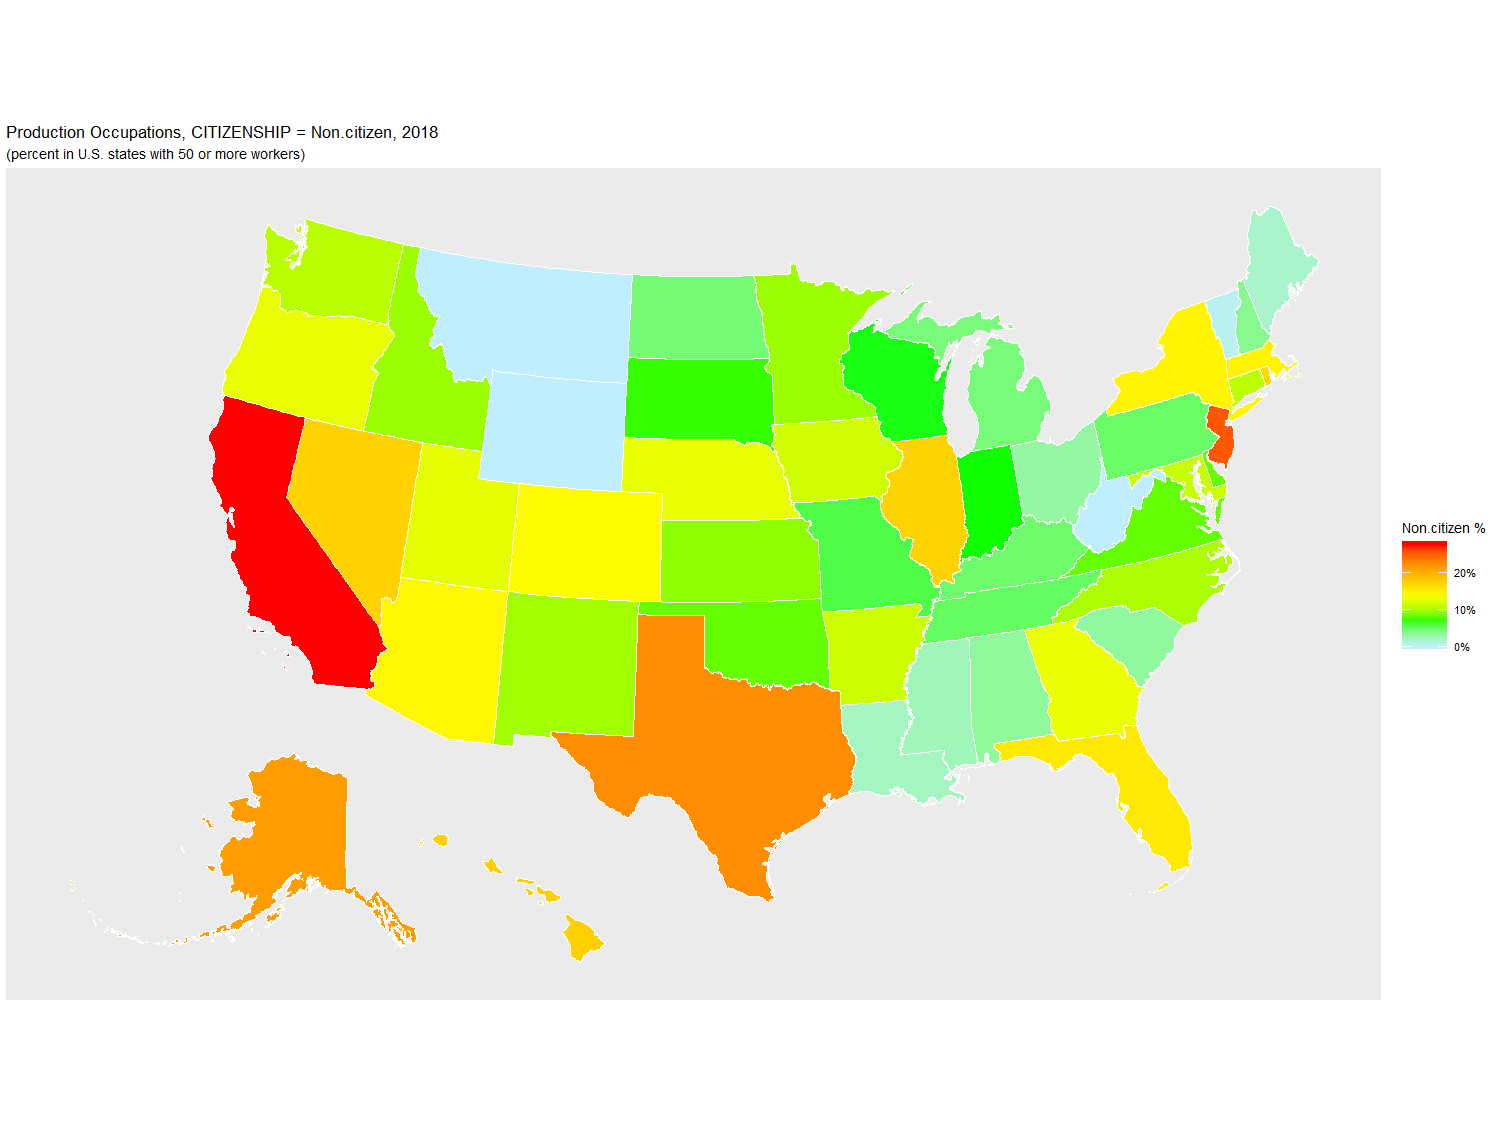
Production Occupations: 2018, grouped by CITIZENSHIP (percent)

   Year STATE   Count Non.citizen Naturalized U.S._Born
1  2018    CA 899,935        27.7        24.4      47.8
2  2018    NJ 181,138        25.5        25.7      48.7
3  2018    TX 697,229        22.4        11.2      66.3
4  2018    AK  10,195        21.4        10.9      67.7
5  2018    HI  16,545        17.6        20.1      62.4
6  2018    NV  52,386        17.4        13.0      69.6
7  2018    IL 397,904        17.3        12.9      69.8
8  2018    RI  31,748        17.0        24.6      58.4
9  2018    DC   2,363        15.9         3.6      80.5
10 2018    FL 323,407        15.6        15.9      68.5
11 2018    MA 134,280        14.8        16.3      68.9
12 2018    NY 313,750        14.6        16.0      69.3
13 2018    AZ 135,380        14.4        10.4      75.2
14 2018    CO 108,565        14.1         8.3      77.5
15 2018    GA 306,976        13.0         6.2      80.8
16 2018    OR 108,353        12.9        11.1      76.1
17 2018    NE  66,504        12.8        10.4      76.7
18 2018    UT  96,892        12.7         7.6      79.7
19 2018    IA 135,040        11.8         5.9      82.3
20 2018    AR 115,624        11.6         4.3      84.1
21 2018    MD  85,310        11.4        10.4      78.2
22 2018    CT  86,012        10.9        16.1      73.0
23 2018    WA 178,156        10.9        12.8      76.3
24 2018    NC 341,301        10.3         4.7      84.9
25 2018    NM  32,556         9.9         8.5      81.5
26 2018    MN 198,892         9.7         9.9      80.3
27 2018    ID  49,118         9.7         6.5      83.8
28 2018    KS  98,740         9.2         6.8      84.0
29 2018    DE  19,167         8.1        10.0      81.8
30 2018    VA 177,527         8.1         4.9      86.9
31 2018    OK 107,628         8.1         3.9      88.0
32 2018    SD  27,387         7.3         7.6      85.1
33 2018    IN 344,691         7.0         3.1      89.9
34 2018    WI 305,616         6.8         3.7      89.5
35 2018    MO 199,916         6.0         4.1      89.9
36 2018    TN 234,405         5.3         3.6      91.0
37 2018    PA 383,517         5.2         6.9      87.9
38 2018    KY 180,620         5.0         2.6      92.4
39 2018    ND  22,195         4.7         7.1      88.2
40 2018    MI 429,276         4.6         3.8      91.6
41 2018    NH  46,406         3.9         5.8      90.3
42 2018    AL 182,264         3.5         2.6      93.9
43 2018    SC 183,866         3.4         3.7      92.8
44 2018    OH 460,639         3.2         4.7      92.0
45 2018    MS 102,064         2.5         0.8      96.7
46 2018    LA 103,249         2.1         2.1      95.8
47 2018    ME  41,263         1.9         5.2      92.9
48 2018    VT  19,687         0.5         2.6      96.8
49 2018    MT  23,875         0.0         0.0     100.0
50 2018    WV  45,558         0.0         1.3      98.7
51 2018    WY  11,413         0.0         0.0     100.0

URL parameters (short)=
?minyear=2018&maxyear=2018&STATE=&geo=STATE&occ=Production%20Occupations&group=CITIZENSHIP&sortn=4&mincount=50
Source: Census Bureau, AMERICAN COMMUNITY SURVEY 2018 SAMPLE
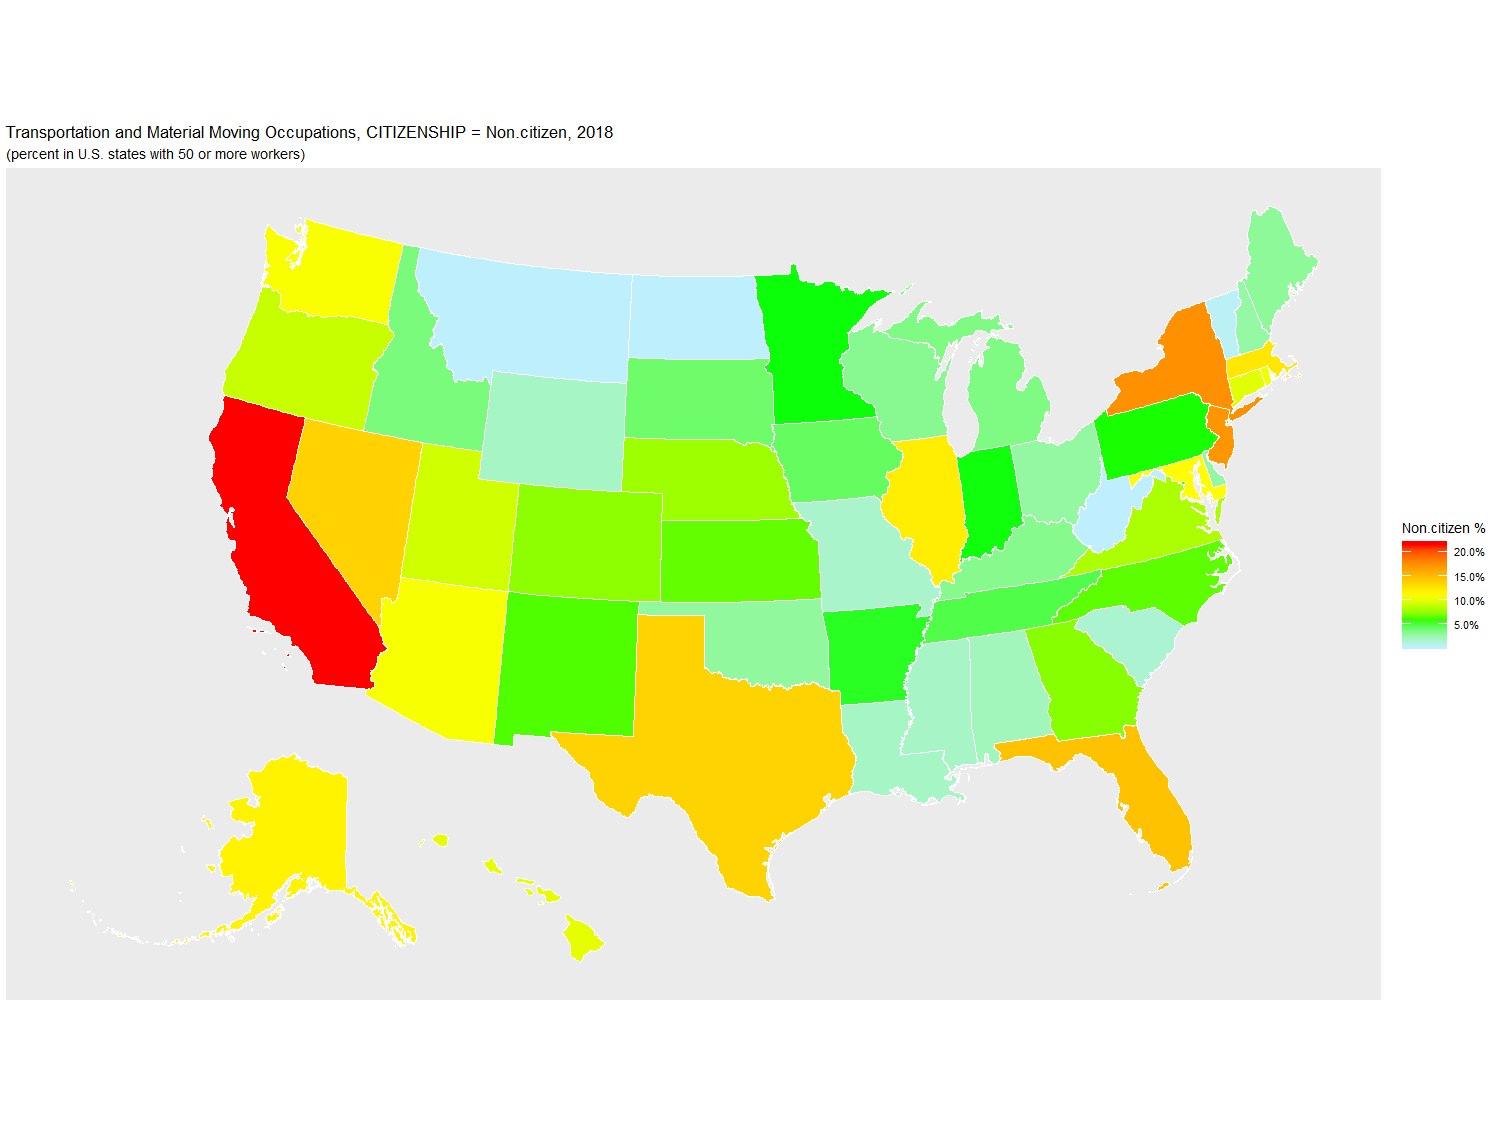
Transportation and Material Moving Occupations: 2018, grouped by CITIZENSHIP (percent)

   Year STATE     Count Non.citizen Naturalized U.S._Born
1  2018    CA 1,436,296        21.6        17.6      60.7
2  2018    NY   652,022        17.4        20.7      61.9
3  2018    NJ   337,603        17.1        20.8      62.1
4  2018    FL   724,753        14.6        15.3      70.0
5  2018    NV   126,200        13.7        12.6      73.6
6  2018    TX 1,097,610        13.7         8.7      77.7
7  2018    MA   205,014        12.4        13.5      74.1
8  2018    IL   539,324        12.1        11.3      76.7
9  2018    AK    32,275        11.7         4.1      84.2
10 2018    MD   188,013        11.1         7.8      81.1
11 2018    WA   272,673        10.8         9.9      79.2
12 2018    AZ   231,802        10.7         8.7      80.6
13 2018    RI    36,548        10.6        11.7      77.8
14 2018    HI    53,184        10.1        17.6      72.3
15 2018    CT   104,377        10.0        11.3      78.8
16 2018    UT   102,228         9.4         6.2      84.3
17 2018    OR   142,903         9.2         5.2      85.6
18 2018    VA   292,660         8.3         8.4      83.4
19 2018    NE    72,319         7.9         3.9      88.2
20 2018    CO   187,195         7.5         6.2      86.3
21 2018    GA   445,684         7.3         5.3      87.4
22 2018    KS   118,271         6.6         5.0      88.4
23 2018    NC   379,489         6.5         4.4      89.1
24 2018    NM    53,527         6.3         8.2      85.5
25 2018    PA   535,705         5.8         4.9      89.3
26 2018    MN   208,189         5.7         5.9      88.4
27 2018    IN   309,803         5.7         2.7      91.6
28 2018    AR   119,911         5.5         3.3      91.2
29 2018    DC    12,134         5.3         8.9      85.9
30 2018    TN   294,728         5.0         3.0      92.1
31 2018    IA   147,202         4.5         2.0      93.5
32 2018    SD    34,391         4.2         1.7      94.0
33 2018    ID    60,534         3.9         1.8      94.3
34 2018    MI   362,819         3.7         4.3      92.0
35 2018    KY   181,105         3.4         2.4      94.1
36 2018    WI   236,726         3.4         3.4      93.3
37 2018    ME    49,064         3.2         2.8      94.0
38 2018    OK   138,550         3.0         2.6      94.4
39 2018    DE    34,698         2.9         4.2      92.9
40 2018    OH   492,113         2.9         3.8      93.3
41 2018    NH    42,974         2.9         2.9      94.2
42 2018    AL   192,036         2.2         1.8      96.0
43 2018    LA   153,809         2.0         1.5      96.5
44 2018    WY    25,296         2.0         0.4      97.6
45 2018    MS   122,766         2.0         0.9      97.1
46 2018    MO   235,228         1.8         2.0      96.1
47 2018    SC   182,417         1.6         1.7      96.7
48 2018    VT    17,668         0.6         7.2      92.2
49 2018    MT    33,757         0.5         0.5      99.0
50 2018    ND    31,052         0.4         5.7      93.9
51 2018    WV    67,007         0.4         1.6      98.0

URL parameters (short)=
?minyear=2018&maxyear=2018&STATE=&geo=STATE&occ=Transportation%20and%20Material%20Moving%20Occupations&group=CITIZENSHIP&sortn=4&mincount=50
Source: Census Bureau, AMERICAN COMMUNITY SURVEY 2018 SAMPLE