A 2018 article titled "Why Aren't There More Women in Tech?" begins as follows:
Women are under-represented in the tech sector. Not only that, but they're underpaid, often passed for promotions and faced with every day sexism. It's no wonder women are more likely to leave the industry within a year compared to their male counterparts.
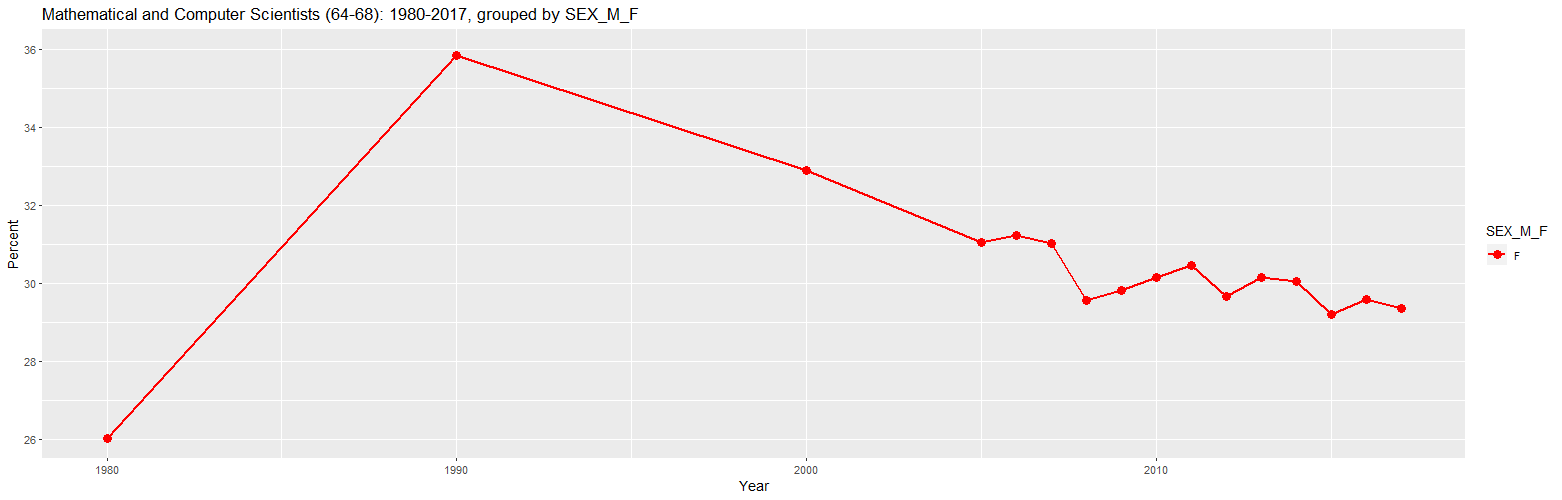
The article also contains a chart showing the number of computing jobs held by women in the U.S. shrinking from 37 percent in 1991 to 26 percent in 2014. The application at this link shows that the 37 percent figure for 1991 is very close to the 35.8 percent figure from 1990 Census Data for Mathematical and Computer Scientists, a category represented by codes 64 to 68 in census variable OCC1990.
Mathematical and Computer Scientists (64-68): 1980-2017, grouped by SEX_M_F (percent)

   Year     Count    M    F
1  1980   325,460 74.0 26.0
2  1990   764,141 64.2 35.8
3  2000 1,850,484 67.1 32.9
4  2005 1,918,711 69.0 31.0
5  2006 2,003,247 68.8 31.2
6  2007 2,095,234 69.0 31.0
7  2008 2,190,804 70.5 29.5
8  2009 2,237,742 70.2 29.8
9  2010 2,203,053 69.9 30.1
10 2011 2,322,285 69.5 30.5
11 2012 2,353,568 70.3 29.7
12 2013 2,506,109 69.9 30.1
13 2014 2,685,135 69.9 30.1
14 2015 2,767,952 70.8 29.2
15 2016 2,932,714 70.4 29.6
16 2017 3,075,192 70.6 29.4

URL parameters (short)=
?minyear=1980&STATE=&geo=NATION&occ=Mathematical%20and%20Computer%20Scientists%20(64-68)&group=SEX_M_F&sortn=4&ymin=26&ymax=36&color=red,red&geomtype=Line%20Graph
As can be seen, the percentages of women tech workers rose from 26 percent in 1980 to 35.8 percent in 1990 and then dropped steadily. It's interesting to note that the H-1B visa was created by the Immigration Act of 1990. It's difficult to tell how much this event coincided with the decline since the census data is only included for each decade until 2000.
In any event, the above table shows a figure of 30.1 percent for 2014, not the 26 percent shown in the chart in the article. It may be that they are using the ACS (American Community Survey) occupation variable OCC which represents the category "Computer and Mathematical Occupations" by codes 1000 to 1299. That results in the following graph and table:
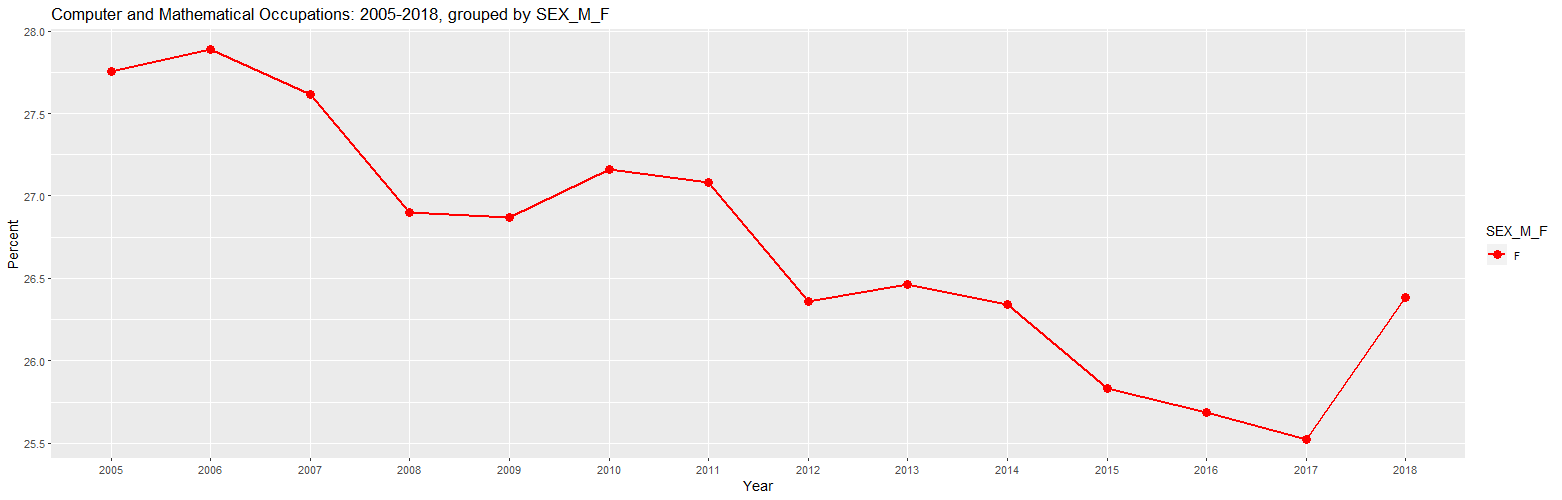
Computer and Mathematical Occupations: 2005-2018, grouped by SEX_M_F (percent)

   Year     Count    M    F
1  2005 3,149,099 72.2 27.8
2  2006 3,262,368 72.1 27.9
3  2007 3,322,297 72.4 27.6
4  2008 3,459,213 73.1 26.9
5  2009 3,489,558 73.1 26.9
6  2010 3,432,435 72.8 27.2
7  2011 3,555,640 72.9 27.1
8  2012 3,705,799 73.6 26.4
9  2013 3,874,466 73.5 26.5
10 2014 4,121,527 73.7 26.3
11 2015 4,263,596 74.2 25.8
12 2016 4,511,904 74.3 25.7
13 2017 4,738,005 74.5 25.5
14 2018 5,033,745 73.6 26.4

URL parameters (short)=
?minyear=2005&maxyear=2018&STATE=&geo=NATION&occ=Computer%20and%20Mathematical%20Occupations&group=SEX_M_F&sortn=4&color=red,red&geomtype=Line%20Graph
The tables shows a figure of 26.3 percent for 2014, very close to the 26 percent shown in the chart in the article. Since this is different from the 30.1 figure shown in the first table, these categories are obviously not identical. It should also be noted that the latter table includes 2018. This is because the ACS data for 2018 contains the OCC variable but does not currently include the OCC1990 variable.
It was possible to calculate OCC1990 for computer and mathematical occupations by looking at the mapping between OCC and OCC1990 for 2005 through 2017. Following is the mapping that was found:
 OCC Codes   OCC1990 Codes
----------   -----------------
 Min   Max   Code  Description
----  ----   ----  -----------
 700   700 ->  65  Operations and systems researchers and analysts
1000  1009 ->  64  Computer systems analysts and computer scientists
1010  1029 -> 229  Computer software developers
1030  1199 ->  64  Computer systems analysts and computer scientists
1200  1219 ->  66  Actuaries
1220  1239 ->  65  Operations and systems researchers and analysts
1240  1299 ->  68  Mathematicians and mathematical scientists
The rest of this article uses the OCC1990 variable so that the data can be compared back to 1980. For the broader category of all computer and mathematical occupations, it uses "Math & Computer Scientists & SW Developers (64-68,229)". For the more narrow category of software developers, it uses "Computer software developers (229)".
On the topic of women in tech, following is an excerpt from an article from February 4, 2019 titled "Tech Women in Silicon Valley Likely to Be Foreign-Born":
Silicon Valley, the global center for high-tech innovation, could be renamed "Immigrant Valley." When it comes to technical talent, the engine of Silicon Valley is fueled by foreign-born workers, many of whom are from humble roots. And having worked hard to get here, many have ambitions beyond their day jobs.
The following graphs and table further group workers with computer and mathematical occupations by their citizenship status. These include non-citizens who are usually on visas like the H-1B or F1 (student), naturalized citizens who were born in another country but who have become U.S. citizens, and U.S. born citizens. The latter category also includes citizens who where born abroad to American parents.
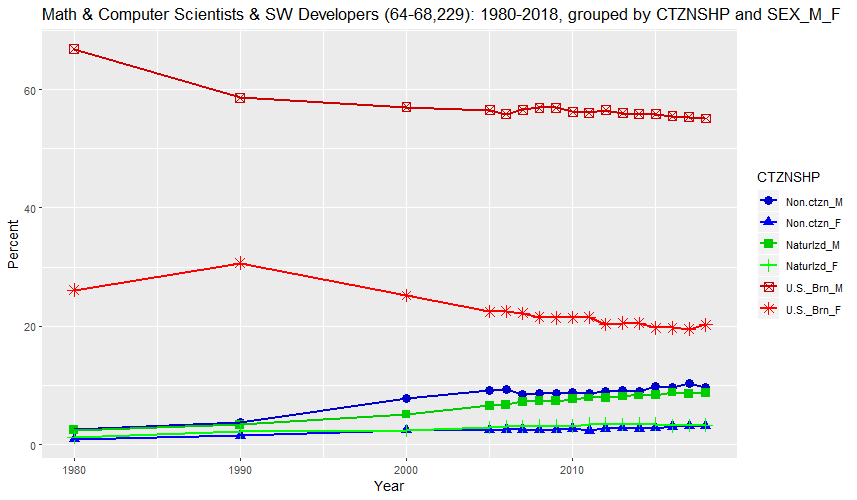
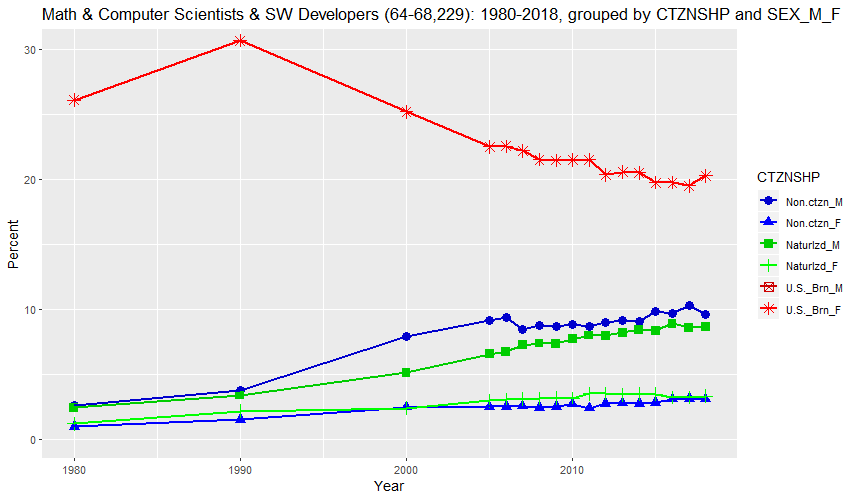
Math & Computer Scientists & SW Developers (64-68,229): 1980-2018, grouped by CTZNSHP and SEX_M_F (percent)

   Year     Count Non.ctzn_M Non.ctzn_F Naturlzd_M Naturlzd_F U.S._Brn_M U.S._Brn_F
1  1980   636,640        2.6        0.9        2.4        1.2       66.8       26.1
2  1990 1,408,313        3.7        1.5        3.4        2.2       58.6       30.7
3  2000 3,199,495        7.9        2.4        5.1        2.4       57.0       25.2
4  2005 3,198,708        9.1        2.5        6.5        2.9       56.5       22.5
5  2006 3,318,303        9.4        2.5        6.7        3.0       55.9       22.5
6  2007 3,385,718        8.4        2.5        7.2        3.1       56.6       22.2
7  2008 3,523,679        8.7        2.4        7.4        3.1       56.9       21.5
8  2009 3,563,731        8.6        2.5        7.3        3.2       56.9       21.4
9  2010 3,518,876        8.9        2.7        7.7        3.1       56.2       21.5
10 2011 3,665,822        8.7        2.4        8.0        3.5       56.0       21.5
11 2012 3,803,465        9.0        2.7        7.9        3.5       56.5       20.3
12 2013 3,986,605        9.1        2.8        8.2        3.4       56.0       20.5
13 2014 4,232,114        9.1        2.7        8.4        3.5       55.9       20.5
14 2015 4,398,425        9.9        2.8        8.3        3.5       55.8       19.7
15 2016 4,643,295        9.6        3.1        8.9        3.2       55.5       19.7
16 2017 4,878,498       10.3        3.1        8.6        3.2       55.3       19.5
17 2018 5,189,315        9.6        3.1        8.7        3.3       55.1       20.3

URL parameters (short)=
?minyear=1980&maxyear=2018&STATE=&geo=NATION&occ=Math%20&%20Computer%20Scientists%20&%20SW%20Developers%20(64-68,229)&group=CTZNSHP|SEX_M_F&sortn=4&color=blue3,blue1,green3,green1,red3,red1&geomtype=Line%20Graph
As can be seen, the percentages of workers of both sexes in the non-citizen and naturalized citizen categories have been generally rising while the percentages of workers in both sexes of U.S. born citizens have been generally dropping, with female workers dropping the fastest and only since 1990. These figures are for the entire U.S. The following table and graph show the figures for Santa Clara County, the county in Silicon Valley with the most tech workers:
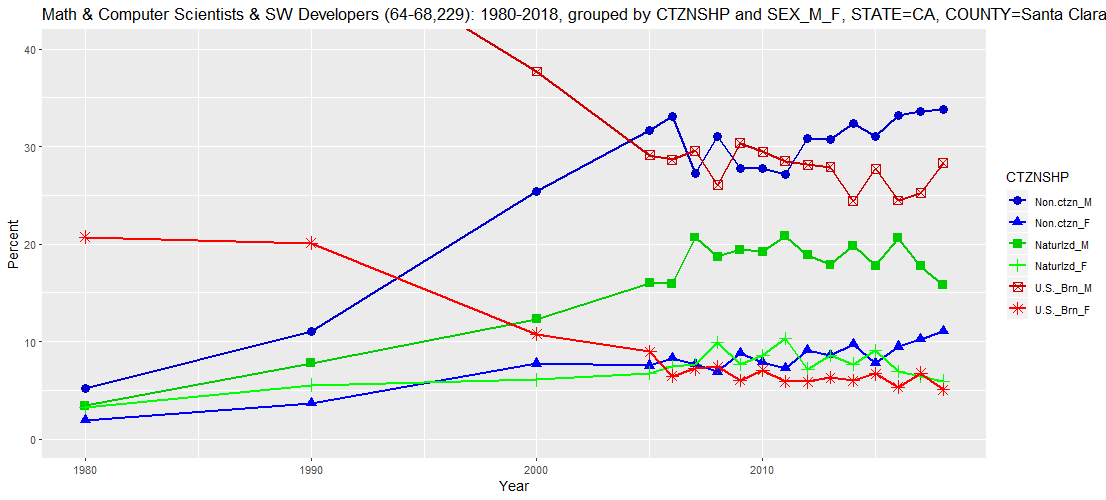
Math & Computer Scientists & SW Developers (64-68,229): 1980-2018, grouped by CTZNSHP and SEX_M_F, STATE=CA, COUNTY=Santa Clara (percent)

   Year   Count Non.ctzn_M Non.ctzn_F Naturlzd_M Naturlzd_F U.S._Brn_M U.S._Brn_F
1  1980  13,520        5.2        1.9        3.4        3.3       65.5       20.7
2  1990  31,908       11.0        3.7        7.8        5.5       51.9       20.1
3  2000  75,758       25.4        7.7       12.3        6.1       37.7       10.8
4  2005  61,136       31.6        7.5       16.0        6.8       29.1        9.0
5  2006  74,124       33.1        8.3       16.0        7.5       28.7        6.5
6  2007  69,727       27.3        7.7       20.7        7.6       29.6        7.2
7  2008  81,284       31.0        6.9       18.7        9.9       26.0        7.4
8  2009  69,865       27.8        8.8       19.4        7.6       30.3        6.0
9  2010  75,966       27.8        7.9       19.2        8.6       29.5        7.0
10 2011  77,883       27.2        7.3       20.8       10.3       28.5        5.9
11 2012  83,941       30.8        9.1       18.9        7.2       28.2        5.9
12 2013  88,624       30.7        8.6       17.9        8.6       27.9        6.3
13 2014 101,409       32.4        9.7       19.8        7.7       24.4        6.0
14 2015 107,500       31.0        7.8       17.8        9.0       27.7        6.7
15 2016 116,481       33.2        9.5       20.6        6.9       24.5        5.3
16 2017 119,613       33.6       10.2       17.7        6.4       25.2        6.8
17 2018 120,741       33.9       11.0       15.8        6.0       28.3        5.1

URL parameters (short)=
?minyear=1980&maxyear=2018&COUNTY=Santa%20Clara&geo=NATION&occ=Math%20&%20Computer%20Scientists%20&%20SW%20Developers%20(64-68,229)&group=CTZNSHP|SEX_M_F&sortn=4&color=blue3,blue1,green3,green1,red3,red1&geomtype=Line%20Graph
As can be seen, the percentage of workers who are U.S. born women has dropped from 20.1 percent in 1990 to 5.1 percent in 2018. Following are the same figures for Alameda County, the county in Silicon Valley with the second most tech workers:
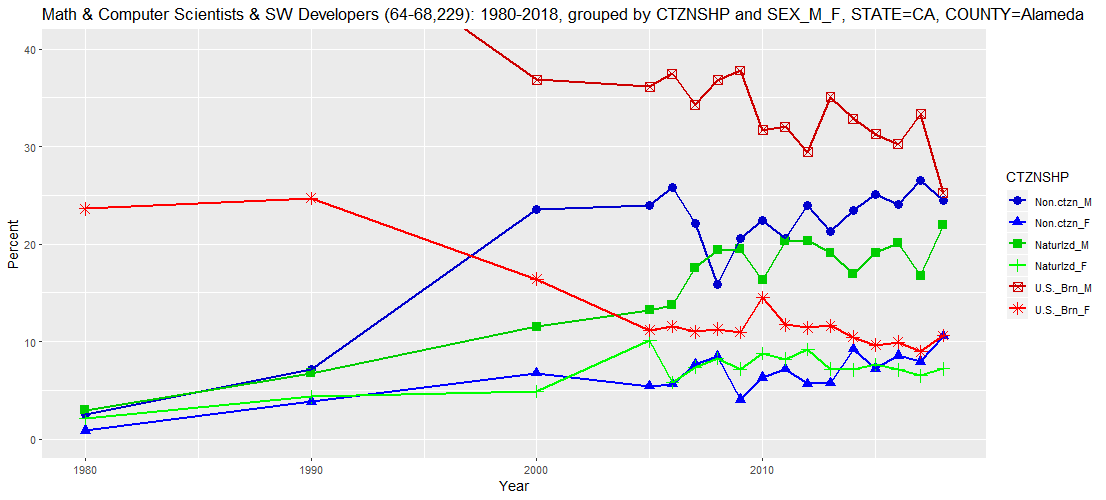
Math & Computer Scientists & SW Developers (64-68,229): 1980-2018, grouped by CTZNSHP and SEX_M_F, STATE=CA, COUNTY=Alameda (percent)

   Year  Count Non.ctzn_M Non.ctzn_F Naturlzd_M Naturlzd_F U.S._Brn_M U.S._Brn_F
1  1980  4,740        2.5        0.8        3.0        2.1       67.9       23.6
2  1990 15,704        7.1        3.8        6.8        4.3       53.3       24.7
3  2000 38,495       23.6        6.7       11.5        4.9       36.9       16.4
4  2005 32,323       24.0        5.4       13.2       10.1       36.2       11.1
5  2006 35,120       25.8        5.6       13.7        5.8       37.5       11.6
6  2007 41,369       22.1        7.7       17.6        7.4       34.3       11.0
7  2008 35,558       15.8        8.5       19.4        8.3       36.8       11.3
8  2009 43,750       20.6        4.0       19.5        7.2       37.8       10.9
9  2010 37,627       22.5        6.3       16.3        8.8       31.7       14.5
10 2011 35,936       20.6        7.1       20.3        8.2       32.0       11.7
11 2012 44,973       24.0        5.7       20.3        9.2       29.4       11.4
12 2013 46,144       21.3        5.7       19.1        7.2       35.1       11.6
13 2014 53,711       23.4        9.2       16.9        7.1       32.9       10.5
14 2015 63,622       25.1        7.2       19.1        7.6       31.3        9.7
15 2016 72,176       24.1        8.5       20.1        7.1       30.2       10.0
16 2017 67,758       26.6        7.9       16.7        6.5       33.3        9.0
17 2018 78,710       24.4       10.5       22.0        7.2       25.2       10.6

URL parameters (short)=
?minyear=1980&maxyear=2018&COUNTY=Alameda&geo=NATION&occ=Math%20&%20Computer%20Scientists%20&%20SW%20Developers%20(64-68,229)&group=CTZNSHP|SEX_M_F&sortn=4&mincount=1000&ymax=40&color=blue3,blue1,green3,green1,red3,red1&geomtype=Line%20Graph
As can be seen, the percentage of workers who are U.S. born women has dropped from 24.7 percent in 1990 to 9 percent in 2017 but has rebounded a bit to 10.6 percent.
The third table above shows that 20.3 percent of U.S. workers in computer and mathematical occupations in 2018 were U.S. born women. However, an article titled "Women make up just 11% of the developer workforce" begins:
Recent data from the Pearson Frank Java and PHP Salary Survey found that just over one in every 10 developers is a woman. In the web developer community, it is no secret that there are very few female developers.
Redoing the prior nationwide graphs and table and changing the occupations from all computer and mathematical occupations to just software developers results in the following:
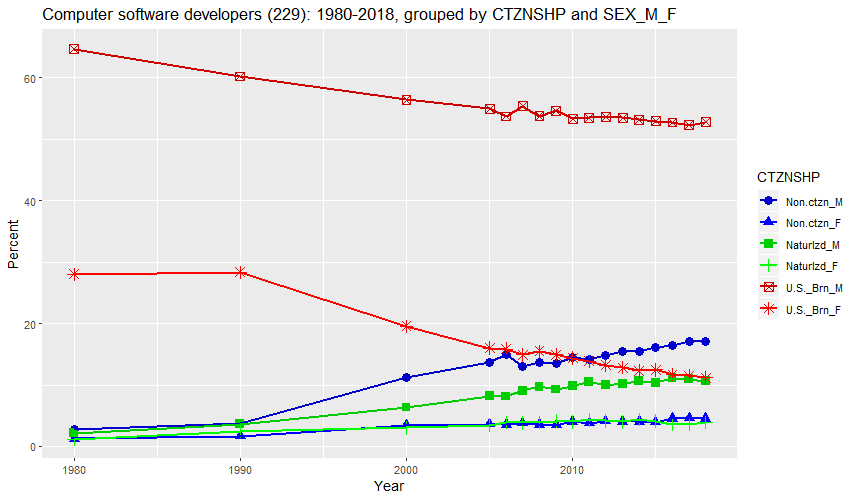
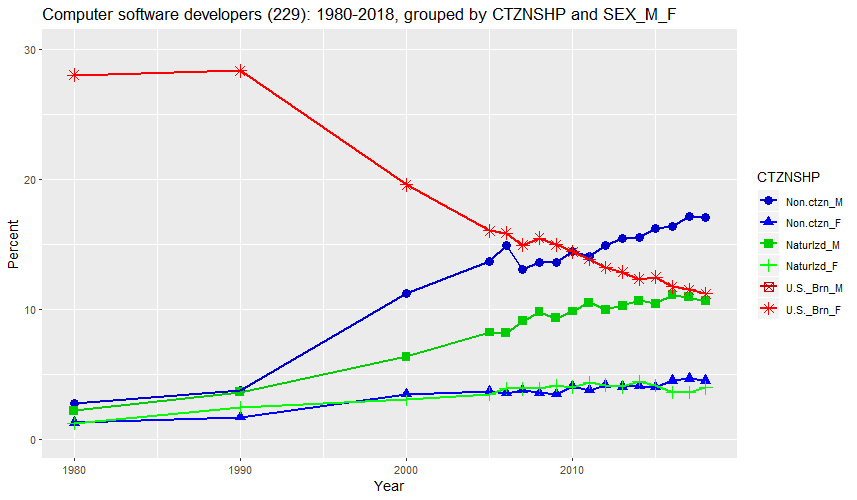
Computer software developers (229): 1980-2018, grouped by CTZNSHP and SEX_M_F (percent)

   Year     Count Non.ctzn_M Non.ctzn_F Naturlzd_M Naturlzd_F U.S._Brn_M U.S._Brn_F
1  1980   311,180        2.7        1.3        2.2        1.2       64.6       28.0
2  1990   644,172        3.7        1.7        3.6        2.4       60.2       28.3
3  2000 1,349,011       11.2        3.5        6.3        3.0       56.4       19.6
4  2005 1,279,997       13.7        3.7        8.2        3.5       55.0       16.0
5  2006 1,315,056       14.9        3.5        8.1        3.9       53.7       15.9
6  2007 1,290,484       13.0        3.7        9.1        3.9       55.4       14.9
7  2008 1,332,875       13.6        3.5        9.7        3.9       53.8       15.5
8  2009 1,325,989       13.5        3.4        9.3        4.1       54.6       14.9
9  2010 1,315,823       14.4        4.1        9.8        4.0       53.3       14.4
10 2011 1,343,537       14.1        3.8       10.5        4.3       53.5       13.9
11 2012 1,449,897       14.9        4.1       10.0        4.2       53.7       13.2
12 2013 1,480,496       15.4        4.0       10.2        4.0       53.5       12.8
13 2014 1,546,979       15.5        4.1       10.6        4.4       53.1       12.3
14 2015 1,630,473       16.2        4.0       10.4        4.1       52.9       12.5
15 2016 1,710,581       16.4        4.5       11.1        3.6       52.7       11.7
16 2017 1,803,306       17.1        4.6       10.9        3.6       52.2       11.5
17 2018 1,853,801       17.0        4.5       10.6        3.9       52.8       11.2

URL parameters (short)=
?minyear=1980&maxyear=2018&STATE=&geo=NATION&occ=Computer%20software%20developers%20(229)&group=CTZNSHP|SEX_M_F&sortn=4&color=blue3,blue1,green3,green1,red3,red1&geomtype=Line%20Graph
As before, the percentages of workers of both sexes in the non-citizen and naturalized citizen categories have been generally rising while the percentages of workers in both sexes of U.S. born citizens have benn generally dropping, with female workers dropping the fastest and only since 1990. As can be seen, the percentage of software developers who are U.S. born women dropped to 11.2 percent in 2018. Furthermore, the percentage nationwide has been dropping steadily since 1990, when it was 28.3 percent.
The above table and graph are for the entire U.S. The following table and graph show the figures for software developers in Santa Clara County, the county in Silicon Valley with the most tech workers:
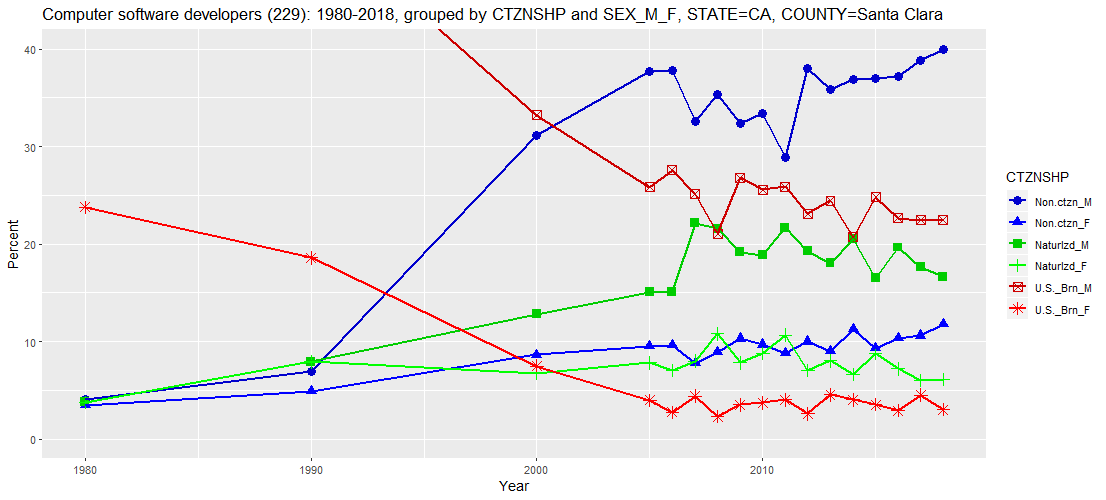
Computer software developers (229): 1980-2018, grouped by CTZNSHP and SEX_M_F, STATE=CA, COUNTY=Santa Clara (percent)

   Year  Count Non.ctzn_M Non.ctzn_F Naturlzd_M Naturlzd_F U.S._Brn_M U.S._Brn_F
1  1980  6,900        4.1        3.5        3.8        3.8       61.2       23.8
2  1990 12,993        6.9        4.9        8.0        7.9       53.7       18.6
3  2000 47,667       31.2        8.6       12.8        6.7       33.2        7.5
4  2005 39,754       37.7        9.5       15.1        7.8       25.8        4.0
5  2006 52,282       37.9        9.6       15.1        7.1       27.6        2.7
6  2007 47,764       32.6        7.8       22.2        8.0       25.1        4.4
7  2008 52,573       35.3        8.9       21.6       10.8       21.1        2.3
8  2009 48,555       32.4       10.3       19.2        7.8       26.8        3.5
9  2010 52,260       33.4        9.7       18.9        8.8       25.6        3.7
10 2011 54,744       28.9        8.8       21.7       10.7       25.9        4.0
11 2012 58,637       38.0       10.0       19.3        7.0       23.1        2.6
12 2013 63,361       35.9        9.0       18.1        8.0       24.5        4.5
13 2014 74,352       36.9       11.3       20.5        6.6       20.7        4.0
14 2015 78,269       37.0        9.3       16.5        8.8       24.8        3.5
15 2016 85,011       37.2       10.3       19.7        7.2       22.7        2.9
16 2017 90,412       38.8       10.6       17.6        6.0       22.4        4.5
17 2018 88,430       40.0       11.8       16.6        6.1       22.4        3.0

URL parameters (short)=
?minyear=1980&maxyear=2018&COUNTY=Santa%20Clara&geo=NATION&occ=Computer%20software%20developers%20(229)&group=CTZNSHP|SEX_M_F&sortn=4&mincount=1000&ymax=40&color=blue3,blue1,green3,green1,red3,red1&geomtype=Line%20Graph
As can be seen, the percentages of workers of both sexes who are non-citizen software developers have been generally rising. One interesting thing to note is that the percentage who were male went down sharply from 2007 to 2011 following the financial crisis but rebounded sharply in 2012. Since 2005, the percentages of software developers who were naturalized citizens has remained fairly steady, with males rising slightly and females dropping slightly. Meanwhile, the percentages of software developers who are U.S. born dropped sharply from 1980 to 2005 and have dropped slightly since then with the drop for males being a bit more noticable. However, U.S. born female developers have remained at a very low level since 2005, between 2.3 and 4.5 percent of developers.
Following are the same figures for Alameda County, the county in Silicon Valley with the second most tech workers:
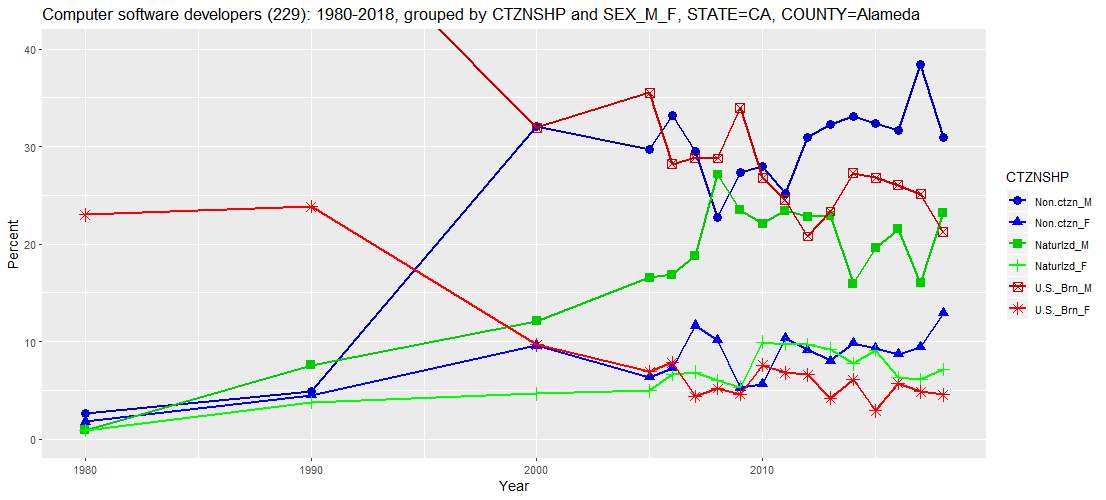
Computer software developers (229): 1980-2018, grouped by CTZNSHP and SEX_M_F, STATE=CA, COUNTY=Alameda (percent)

   Year  Count Non.ctzn_M Non.ctzn_F Naturlzd_M Naturlzd_F U.S._Brn_M U.S._Brn_F
1  1980  2,260        2.7        1.8        0.9        0.9       70.8       23.0
2  1990  6,794        4.9        4.5        7.6        3.8       55.4       23.8
3  2000 20,473       32.1        9.6       12.1        4.6       31.9        9.7
4  2005 18,805       29.7        6.4       16.6        5.0       35.5        6.9
5  2006 19,851       33.2        7.3       16.9        6.6       28.2        7.8
6  2007 24,022       29.5       11.6       18.8        6.9       28.9        4.4
7  2008 17,616       22.7       10.1       27.1        6.0       28.8        5.2
8  2009 21,447       27.4        5.2       23.5        5.3       34.0        4.6
9  2010 20,199       28.0        5.6       22.1       10.0       26.8        7.6
10 2011 20,975       25.2       10.3       23.4        9.7       24.5        6.8
11 2012 24,480       31.0        9.1       22.8        9.7       20.8        6.6
12 2013 25,526       32.3        8.0       22.9        9.2       23.4        4.2
13 2014 29,970       33.1        9.8       15.9        7.7       27.3        6.1
14 2015 38,938       32.3        9.3       19.6        9.1       26.8        2.9
15 2016 44,341       31.6        8.7       21.5        6.3       26.1        5.7
16 2017 39,393       38.5        9.4       16.0        6.1       25.1        4.9
17 2018 48,897       30.9       12.9       23.2        7.1       21.2        4.5

URL parameters (short)=
?minyear=1980&maxyear=2018&COUNTY=Alameda&geo=NATION&occ=Computer%20software%20developers%20(229)&group=CTZNSHP|SEX_M_F&sortn=4&mincount=1000&color=blue3,blue1,green3,green1,red3,red1&geomtype=Line%20Graph
The trend of the percentages for Alameda County are generally similar to the trends for Santa Clara County. As in Santa Clara County, U.S. born female developers have been the category with the smallest percentages. However, these percentages have been between 2.9 and 7.8 percent of developers, a bit higher than the 2.3 to 4.5 percent for Santa Clara County.
The prior two graphs and tables show that the percentage of software developers in 2018 who were U.S. born women in Santa Clara and Alameda Counties in Silicon Valley were 3.0 and 4.5 percent, respectively. The following table shows the 50 counties in the U.S. in 2018 which had the lowest percentages. This list includes only counties with 5,000 or more software developers.
Computer software developers (229): 2018, grouped by CTZNSHP and SEX_M_F (percent)

   Year                  COUNTY  Count Non.ctzn_M Non.ctzn_F Naturlzd_M Naturlzd_F U.S._Brn_M U.S._Brn_F
1  2018    Palm Beach County FL  5,919       11.5        5.0       14.7       14.0       52.9        1.9
2  2018      Somerset County NJ  6,526       26.6        8.5       20.2       14.2       28.5        2.0
3  2018        Denton County TX 10,928       24.3        7.9        8.8        7.7       49.0        2.2
4  2018        Hudson County NJ 13,746       51.4       11.8       11.0        4.6       18.5        2.7
5  2018        Orange County CA 23,486       14.3        5.2       23.4       10.8       43.5        2.8
6  2018   Santa Clara County CA 88,430       40.0       11.8       16.6        6.1       22.4        3.0
7  2018       Forsyth County GA  5,898       38.0       16.4       18.9        5.2       18.1        3.3
8  2018     Salt Lake County UT  8,842        4.5        2.9        8.8        2.7       77.6        3.4
9  2018          Utah County UT 10,119        1.0        7.0        1.5        0.0       86.8        3.8
10 2018     Middlesex County NJ 18,228       48.0        9.1       21.2        3.0       14.8        3.9
11 2018  Hillsborough County FL  8,414       30.4        2.4        5.4        5.8       51.4        4.5
12 2018       Alameda County CA 48,897       30.9       12.9       23.2        7.1       21.2        4.5
13 2018        DuPage County IL 12,402       20.7        8.0       11.1        5.9       49.7        4.7
14 2018       Oakland County MI 13,294       28.8        5.6        9.2        3.2       48.5        4.7
15 2018      Franklin County OH  9,498       19.1        2.3        9.3        0.0       64.6        4.7
16 2018    Washington County OR 13,413       22.1        6.9        9.1        6.2       50.8        4.8
17 2018        Collin County TX 18,895       24.6        8.9       16.7        7.1       37.6        5.1
18 2018        Dallas County TX 17,573       29.8       10.8        7.0        1.6       45.6        5.3
19 2018      New York County NY 14,937       19.2        3.2       13.4        2.8       56.0        5.5
20 2018  Contra Costa County CA 12,080       23.8        3.9       21.7       11.9       33.2        5.5
21 2018  Philadelphia County PA  5,478       16.5        0.0       10.0        2.2       65.4        5.8
22 2018      Hennepin County MN 16,824       13.1       13.2        8.2        1.6       58.0        5.8
23 2018       Ventura County CA  6,202       14.6        0.0       21.4        2.7       55.4        6.0
24 2018          Lake County IL  7,041       22.0       10.2       12.2        4.9       44.5        6.1
25 2018     Snohomish County WA 10,919       27.0        4.5        7.5        5.9       48.8        6.2
26 2018       Johnson County KS  9,543       19.1        3.1        7.2       17.7       46.7        6.2
27 2018        Nassau County NY  5,390        5.6        0.9       19.6        8.8       58.5        6.6
28 2018     San Mateo County CA 17,104       33.1       11.9       19.1        2.9       26.3        6.7
29 2018      Hamilton County OH  5,301       22.5        1.6        3.9        0.0       64.8        7.1
30 2018        Orange County FL  8,397        4.6        6.5        9.1        3.8       68.7        7.3
31 2018     St. Louis County MO 10,818       30.5        3.3        3.2        3.9       51.5        7.6
32 2018       Loudoun County VA 14,311       16.4        4.7       15.9       11.7       43.6        7.8
33 2018        Travis County TX 20,848       13.9        2.2       14.9        4.9       56.2        7.9
34 2018          King County WA 80,283       33.3        6.3       10.9        2.9       38.8        8.0
35 2018 San Francisco County CA 30,518       17.6        1.4       11.3        3.6       57.9        8.2
36 2018          Cook County IL 35,685       19.8        5.7       10.5        2.2       53.2        8.6
37 2018    Montgomery County MD 13,303        9.3        3.4       28.2        4.8       44.9        9.5
38 2018        Bergen County NJ  7,455       25.4        5.0       20.8        7.7       31.3        9.8
39 2018   Mecklenburg County NC  8,839       34.5        6.4        7.7        3.8       37.8        9.8
40 2018        Queens County NY  8,711       18.1        1.9       24.6        0.7       44.6       10.1
41 2018     San Diego County CA 28,326       17.5        3.1       18.3        2.7       48.3       10.2
42 2018      Pinellas County FL  6,173       11.6        0.9        3.0        4.0       69.7       10.8
43 2018      Gwinnett County GA  6,322        8.1        4.0       19.0        5.1       52.8       11.0
44 2018      Cuyahoga County OH  5,154       13.3        7.3        6.9        2.5       58.8       11.1
45 2018       Broward County FL  6,694       16.5        5.6       32.2        1.4       33.1       11.1
46 2018       Chester County PA  7,391       36.5        6.0        5.1        6.8       34.5       11.1
47 2018        Harris County TX 18,668       28.7        7.0        7.3        5.4       40.3       11.4
48 2018     Arlington County VA  5,738        5.3        0.0        3.8        8.6       70.9       11.4
49 2018         Kings County NY 16,397       12.1        1.2       18.6        5.9       50.8       11.5
50 2018    Williamson County TX  9,860       15.3        1.9        5.9        4.9       60.3       11.7

URL parameters (short)=
?minyear=2018&maxyear=2018&STATE=&geo=COUNTY&occ=Computer%20software%20developers%20(229)&group=CTZNSHP|SEX_M_F&sortn=9&sortdir=Ascending&totrows=50&color=blue3,blue1,green3,green1,red3,red1&geomtype=Line%20Graph
As can be seen, Santa Clara and Alameda Counties ranked as numbers 6 and 12, respectively. Another cluster of nearby counties in the top 20 are Somerset, Hudson, and Middlesex Counties in New Jersey and New York County, New York, all near New York City. Another cluster of nearby counties are Denton, Collin, and Dallas Counties, all near Dallas, Texas.
There are many articles that explore the reasons for why there are so few women in tech. One interesting one is an August 8, 2017 article in the Guardian titled "Why are there so few women in tech? The truth behind the Google memo".
One possible factor mentioned in the article is cultural differences between countries. It states:
Prof Dame Wendy Hall, a director of the Web Science Institute at the University of Southampton, points to the wide variation in gender ratios in computing internationally, which she argues would not be seen if there were a universal biological difference in ability between the sexes. While only 16% of computer science undergraduates in the UK - and a similar proportion in the US - are female, the balance is different in India, Malaysia and Nigeria.
"I walk into a classroom in India and it's more than 50% girls, the same in Malaysia," says Hall. "They are so passionate about coding, Lots of women love coding. There just aren't these gender differences there."
Further on, the articles states the following about the west:
Hall believes that the gender gap and the "male computer geek" stereotype can be dated back to the advent of the home computer in the early 80s, when the machines were marketed heavily as gaming systems for men. She suspects this might be more culpable for women's low participation than men having evolved a mindset better suited to writing lines of code.
"Women were turned off computing in the 80s," she says. "Computers were sold as toys for the boys. Somehow that cultural stigma has stuck in the west in a way that we can't get rid of and it's just getting worse. The skills gap is going to get huge."
Further on, the article brings up an interesting point that I have not heard made before:
As we move into a future in which algorithms have greater influence on our lives - from communication to healthcare, transport to the law - the gender balance in tech companies goes beyond what is fair for their employees. The result of male domination of tech has led to the development of, for example, voice recognition technologies that, trained and tested solely by men, struggle to understand female voices. It has resulted in virtual reality technologies that disproportionally impose motion sickness on women. At this early moment in its history, the tech industry is already littered with products that have gender bias effectively programmed into them.
The article concludes:
"As we go into the world of AI, when people are designing algorithms that help us live our lives, it will be very bad if that's all done by men," says Hall. "Social care, looking after kids, so many aspects of our lives. We really need as many people as possible doing this. It's really important and it's going to get more important."
Hall invokes her late mentor Karen Spärck Jones, a pioneering British computer scientist who campaigned hard to encourage more women into the field. As she used to say: "Computing is too important to be left to men."