H-1B and Related Data by State
H-1B Data
OPT Data
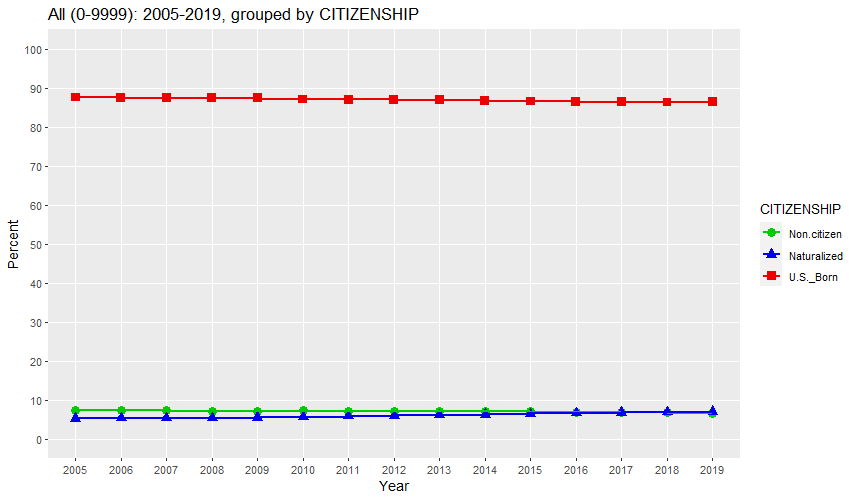
All (0-9999): 2005-2019, grouped by CITIZENSHIP (percent)

   Year       Count Non.citizen Naturalized U.S._Born
1  2005 288,398,819         7.2         5.2      87.6
2  2006 299,398,485         7.2         5.3      87.5
3  2007 301,621,159         7.2         5.4      87.4
4  2008 304,059,728         7.1         5.4      87.5
5  2009 307,006,556         7.0         5.5      87.5
6  2010 309,349,689         7.3         5.6      87.1
7  2011 311,591,919         7.1         5.8      87.0
8  2012 313,914,040         7.0         5.9      87.0
9  2013 316,128,839         7.0         6.1      86.9
10 2014 318,857,056         7.0         6.3      86.8
11 2015 321,418,821         7.0         6.5      86.6
12 2016 323,127,515         6.9         6.6      86.5
13 2017 325,719,178         6.9         6.7      86.4
14 2018 327,167,439         6.7         6.9      86.3
15 2019 328,239,523         6.6         7.0      86.4

URL parameters (short)=
?minyear=2005&maxyear=2019&STATE=&geo=NATION&occ=All%20(0-9999)&empstat=All&group=CITIZENSHIP&sortn=4&ymax=100&color=green3,blue2,red2&geomtype=Line%20Graph
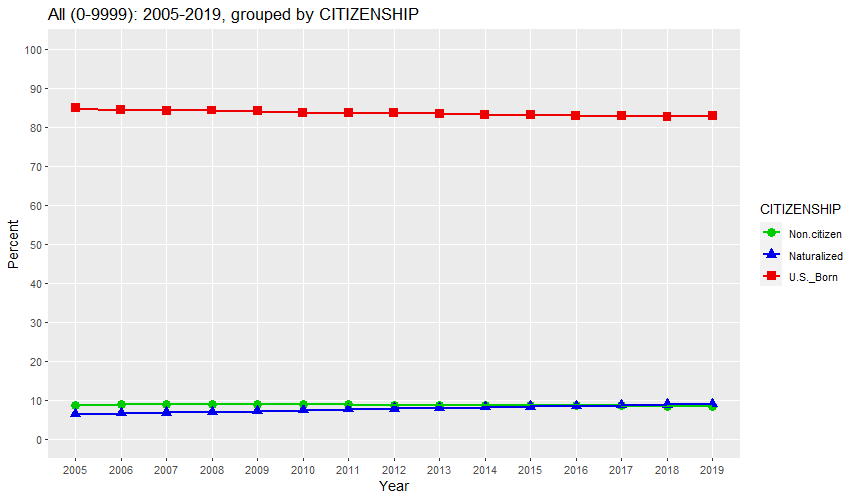
All (0-9999) Employed: 2005-2019, grouped by CITIZENSHIP (percent)

   Year       Count Non.citizen Naturalized U.S._Born
1  2005 137,147,492         8.7         6.4      84.9
2  2006 142,545,193         8.9         6.7      84.4
3  2007 143,630,939         9.0         6.8      84.3
4  2008 147,486,711         8.8         6.9      84.3
5  2009 141,943,601         8.7         7.2      84.1
6  2010 140,161,827         8.9         7.4      83.7
7  2011 141,478,171         8.8         7.7      83.5
8  2012 144,068,092         8.7         7.7      83.5
9  2013 146,224,090         8.7         7.9      83.4
10 2014 148,962,014         8.7         8.1      83.2
11 2015 151,593,280         8.7         8.3      83.0
12 2016 153,640,528         8.6         8.4      82.9
13 2017 156,087,352         8.5         8.6      82.9
14 2018 157,964,150         8.5         8.8      82.7
15 2019 160,034,580         8.3         8.9      82.8

URL parameters (short)=
?minyear=2005&maxyear=2019&STATE=&geo=NATION&occ=All%20(0-9999)&group=CITIZENSHIP&sortn=4&ymax=100&color=green3,blue2,red2&geomtype=Line%20Graph
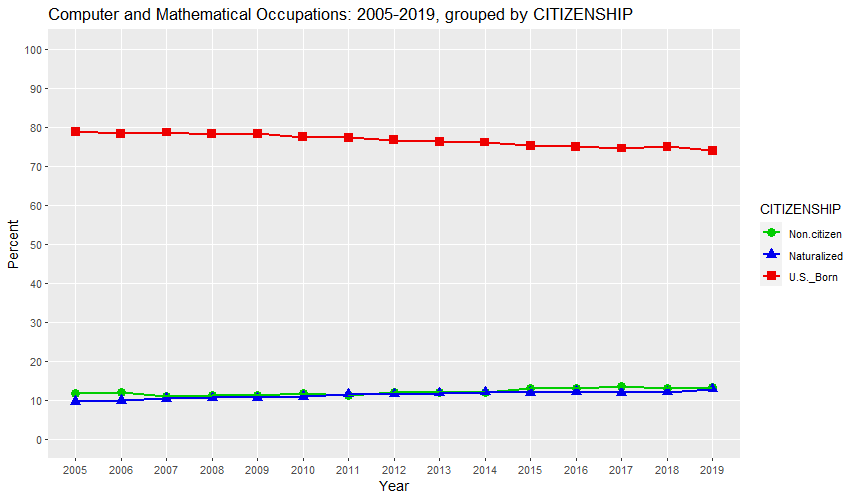
Computer and Mathematical Occupations: 2005-2019, grouped by CITIZENSHIP (percent)

   Year     Count Non.citizen Naturalized U.S._Born
1  2005 3,158,946        11.7         9.5      78.8
2  2006 3,273,828        11.9         9.8      78.2
3  2007 3,333,079        11.0        10.3      78.6
4  2008 3,475,760        11.2        10.5      78.2
5  2009 3,503,119        11.1        10.5      78.3
6  2010 3,441,249        11.7        10.9      77.4
7  2011 3,564,940        11.2        11.5      77.3
8  2012 3,715,877        11.9        11.5      76.7
9  2013 3,885,355        12.0        11.7      76.3
10 2014 4,131,948        12.0        12.0      76.1
11 2015 4,277,007        12.9        11.9      75.3
12 2016 4,525,376        12.9        12.1      75.0
13 2017 4,754,009        13.6        11.9      74.5
14 2018 5,033,745        13.0        12.0      75.0
15 2019 5,253,353        13.3        12.7      73.9

URL parameters (short)=
?minyear=2005&maxyear=2019&STATE=&geo=NATION&occ=Computer%20and%20Mathematical%20Occupations&group=CITIZENSHIP&sortn=4&ymax=100&color=green3,blue2,red2&geomtype=Line%20Graph
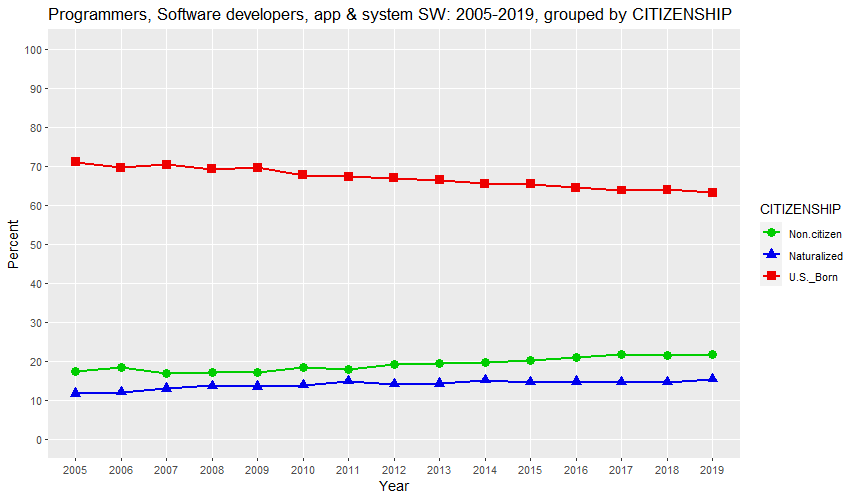
Programmers, Software developers, app & system SW: 2005-2019, grouped by CITIZENSHIP (percent)

   Year     Count Non.citizen Naturalized U.S._Born
1  2005 1,281,710        17.3        11.7      71.0
2  2006 1,315,830        18.4        12.0      69.6
3  2007 1,291,431        16.8        12.9      70.3
4  2008 1,335,926        17.1        13.6      69.3
5  2009 1,328,106        17.0        13.4      69.6
6  2010 1,316,879        18.5        13.8      67.7
7  2011 1,344,062        17.8        14.8      67.3
8  2012 1,450,233        19.0        14.1      66.9
9  2013 1,482,323        19.4        14.2      66.3
10 2014 1,547,484        19.5        15.0      65.4
11 2015 1,630,845        20.1        14.5      65.4
12 2016 1,710,728        20.9        14.7      64.4
13 2017 1,804,227        21.7        14.5      63.8
14 2018 1,853,801        21.5        14.5      64.0
15 2019 2,061,301        21.6        15.3      63.1

URL parameters (short)=
?minyear=2005&maxyear=2019&STATE=&geo=NATION&occ=Programmers,%20Software%20developers,%20app%20&%20system%20SW&group=CITIZENSHIP&sortn=4&ymax=100&color=green3,blue2,red2&geomtype=Line%20Graph
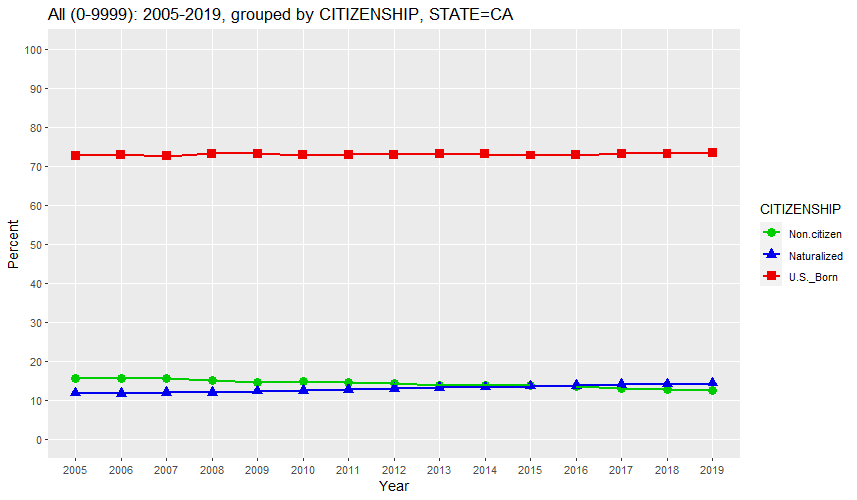
All (0-9999): 2005-2019, grouped by CITIZENSHIP, STATE=CA (percent)

   Year      Count Non.citizen Naturalized U.S._Born
1  2005 35,340,566        15.6        11.7      72.7
2  2006 36,457,549        15.4        11.7      72.9
3  2007 36,553,215        15.5        11.9      72.6
4  2008 36,756,666        14.9        11.9      73.2
5  2009 36,961,664        14.6        12.3      73.1
6  2010 37,349,363        14.7        12.4      72.8
7  2011 37,691,912        14.4        12.7      72.9
8  2012 38,041,430        14.2        12.9      73.0
9  2013 38,332,521        13.8        13.1      73.1
10 2014 38,802,500        13.8        13.2      73.0
11 2015 39,144,818        13.7        13.6      72.7
12 2016 39,250,017        13.5        13.7      72.8
13 2017 39,536,653        13.0        13.9      73.1
14 2018 39,557,045        12.7        14.1      73.2
15 2019 39,512,223        12.4        14.3      73.3

URL parameters (short)=
?minyear=2005&maxyear=2019&geo=NATION&occ=All%20(0-9999)&empstat=All&group=CITIZENSHIP&sortn=4&ymax=100&color=green3,blue2,red2&geomtype=Line%20Graph
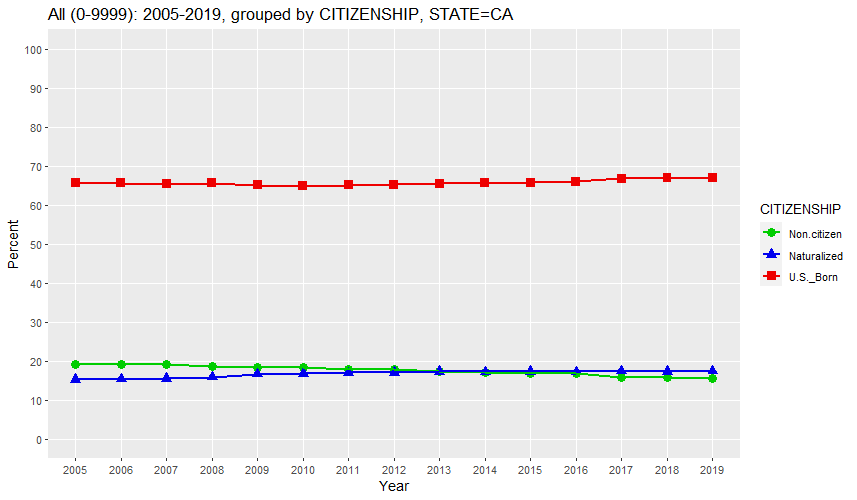
All (0-9999): 2005-2019, grouped by CITIZENSHIP, STATE=CA (percent)

   Year      Count Non.citizen Naturalized U.S._Born
1  2005 16,118,662        19.1        15.2      65.7
2  2006 16,924,321        19.0        15.4      65.6
3  2007 16,986,397        19.2        15.4      65.3
4  2008 17,289,071        18.6        15.8      65.6
5  2009 16,610,075        18.3        16.6      65.1
6  2010 16,360,737        18.3        16.8      64.9
7  2011 16,546,721        18.0        17.0      65.1
8  2012 16,944,551        17.7        17.0      65.2
9  2013 17,276,253        17.3        17.3      65.5
10 2014 17,746,121        17.2        17.2      65.6
11 2015 18,211,105        16.9        17.3      65.7
12 2016 18,472,665        16.8        17.2      66.0
13 2017 18,867,615        15.9        17.3      66.8
14 2018 19,074,849        15.8        17.3      66.9
15 2019 19,245,704        15.5        17.4      67.1

URL parameters (short)=
?minyear=2005&maxyear=2019&geo=NATION&occ=All%20(0-9999)&group=CITIZENSHIP&sortn=4&ymax=100&color=green3,blue2,red2&geomtype=Line%20Graph
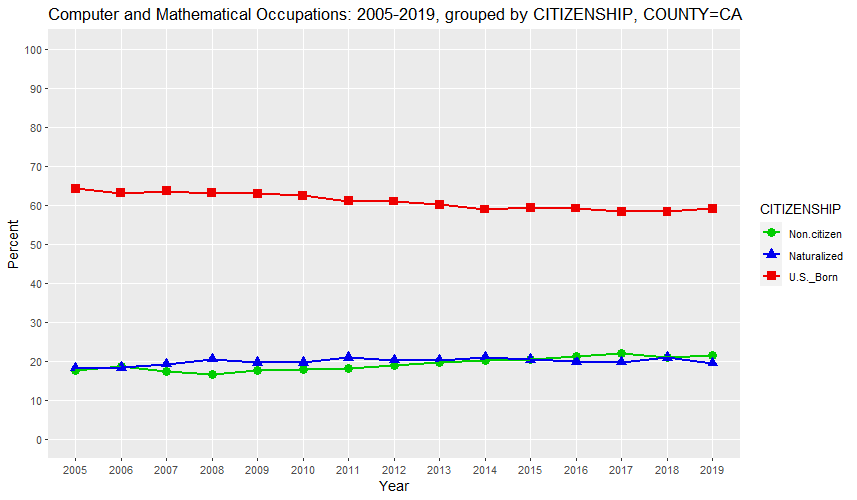
Computer and Mathematical Occupations: 2005-2019, grouped by CITIZENSHIP, COUNTY=CA (percent)

   Year   Count Non.citizen Naturalized U.S._Born
1  2005 438,517        17.7        18.1      64.2
2  2006 473,468        18.6        18.3      63.1
3  2007 482,385        17.3        19.2      63.5
4  2008 504,059        16.5        20.4      63.1
5  2009 499,707        17.6        19.5      62.9
6  2010 484,595        17.9        19.6      62.4
7  2011 511,241        18.1        20.9      61.1
8  2012 531,617        18.9        20.2      60.9
9  2013 554,689        19.6        20.3      60.1
10 2014 601,301        20.2        20.9      58.9
11 2015 649,690        20.4        20.3      59.3
12 2016 689,022        21.1        19.8      59.1
13 2017 704,837        22.0        19.7      58.3
14 2018 742,956        20.8        20.9      58.3
15 2019 790,303        21.5        19.4      59.0

URL parameters (short)=
?minyear=2005&maxyear=2019&STATE=&COUNTY=CA&geo=NATION&occ=Computer%20and%20Mathematical%20Occupations&group=CITIZENSHIP&sortn=4&ymax=100&color=green3,blue2,red2&geomtype=Line%20Graph
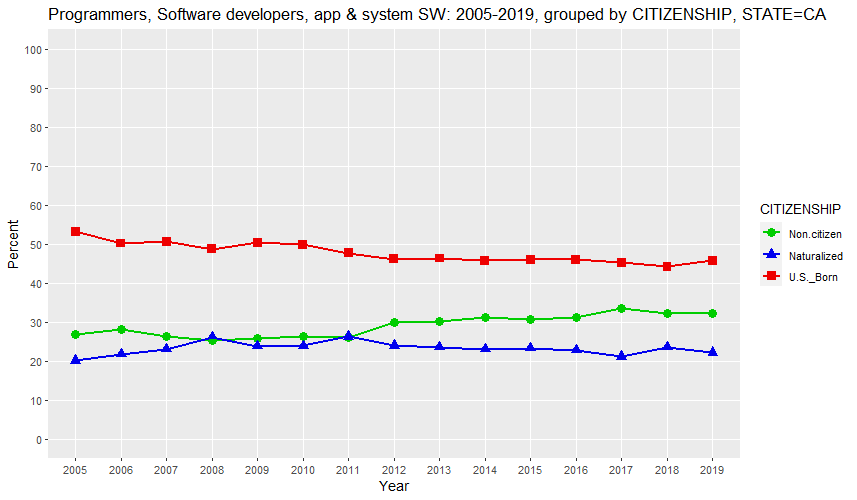
Programmers, Software developers, app & system SW: 2005-2019, grouped by CITIZENSHIP, STATE=CA (percent)

   Year   Count Non.citizen Naturalized U.S._Born
1  2005 188,889        26.7        20.1      53.2
2  2006 212,441        28.0        21.8      50.2
3  2007 210,303        26.4        23.0      50.6
4  2008 211,065        25.2        26.1      48.7
5  2009 216,943        25.8        23.8      50.3
6  2010 212,147        26.3        23.9      49.8
7  2011 222,821        26.1        26.3      47.6
8  2012 235,361        29.9        24.0      46.1
9  2013 248,460        30.1        23.5      46.3
10 2014 283,192        31.2        23.1      45.7
11 2015 302,577        30.7        23.4      45.9
12 2016 323,849        31.2        22.8      46.0
13 2017 340,950        33.6        21.1      45.3
14 2018 342,463        32.3        23.5      44.1
15 2019 385,638        32.1        22.2      45.7

URL parameters (short)=
?minyear=2005&maxyear=2019&geo=NATION&occ=Programmers,%20Software%20developers,%20app%20&%20system%20SW&group=CITIZENSHIP&sortn=4&ymax=100&color=green3,blue2,red2&geomtype=Line%20Graph
Non-citizen Percentage of Various Occupations by State
H-1B and Related Data by State
H-1B Data
OPT Data