East and South Bay Workforce: 2015
Employed Population by Citizenship Status, 2015
Alameda county Santa Clara county
----------------------------------- ----------------------------------
Citizen Naturalized Not a Citizen Naturalized Not a
by birth Citizen Citizen by birth Citizen Citizen Occupation
---------- ---------- ---------- ---------- ---------- ---------- ----------
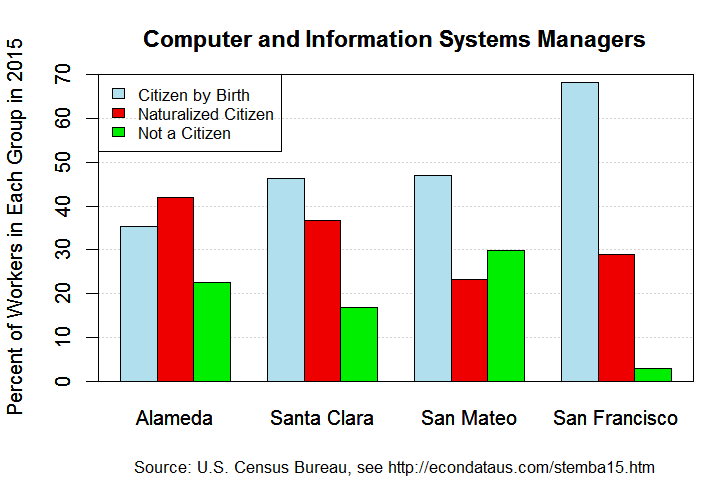
1,909 2,262 1,216 3,669 2,905 1,339 Computer and Information Systems Managers (MGR)
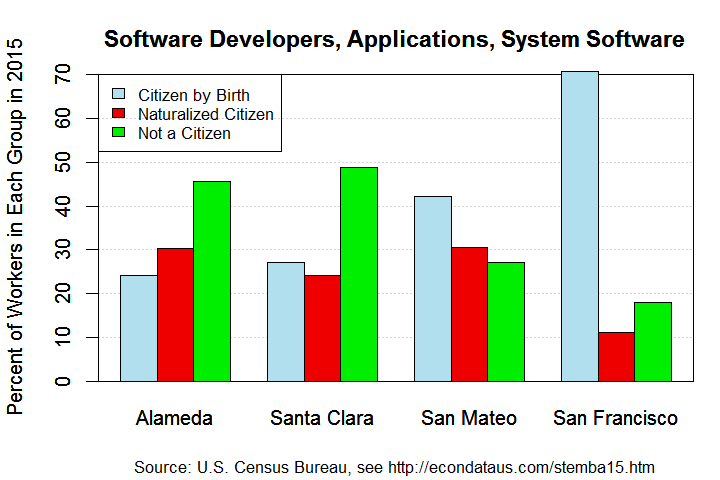
8,037 10,139 15,179 18,896 16,817 34,169 Software Developers, Applications and Systems Software (CMM)
3,526 1,011 1,046 3,291 2,982 2,114 Computer Programmers (CMM)
14,218 5,882 4,322 14,448 8,856 5,296 Other Computer and Mathematical (CMM)
---------- ---------- ---------- ---------- ---------- ---------- ----------
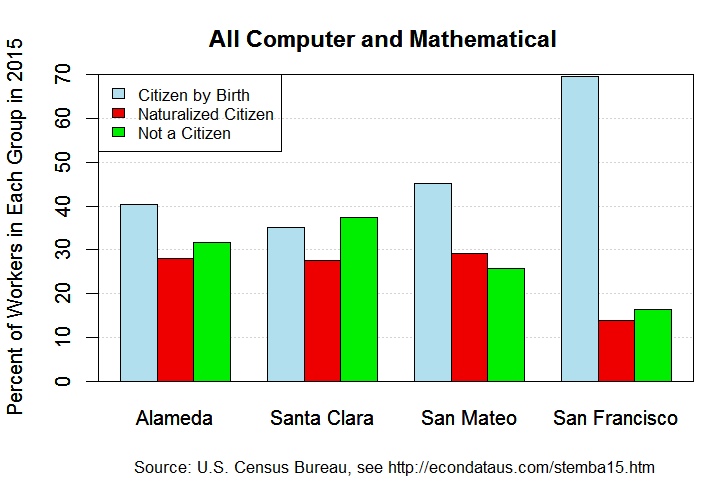
27,690 19,294 21,763 40,304 31,560 42,918 Total Computer and Mathematical (CMM & MGR)
527 461 114 2,688 2,191 1,199 Architectural and Engineering Managers (MGR)
10,058 9,625 4,159 19,772 18,775 14,305 Architectural and Engineering (ENG)
412 0 68 0 161 0 Natural Sciences Managers (MGR)
12,363 2,747 2,832 7,241 3,431 3,522 Life, physical, and social science (SCI)
2,450 448 155 2,447 1,779 322 Medical and Health Services Managers (MGR)
34,506 18,347 5,714 30,169 21,411 5,481 Medical and Health Services (MED & HLS)
3,449 3,325 899 4,159 2,021 1,327 Financial Managers (MGR)
7,383 5,259 1,856 7,825 7,182 2,705 Accountants and Auditors (FIN)
5,313 2,341 1,151 6,152 2,610 974 Other Financial (FIN)
56,437 14,343 8,434 63,678 25,148 16,788 Other Managers (MGR)
358,114 102,665 98,370 330,062 126,942 121,897 Other Workers
---------- ---------- ---------- ---------- ---------- ---------- ----------
518,702 178,855 145,515 514,497 243,211 211,438 TOTAL (all occupations)
==================================================================================
Percent of Employed Population by Citizenship Status, 2015
Alameda county Santa Clara county
----------------------------------- ----------------------------------
Citizen Naturalized Not a Citizen Naturalized Not a
by birth Citizen Citizen by birth Citizen Citizen Occupation
---------- ---------- ---------- ---------- ---------- ---------- ----------
35.4 42.0 22.6 46.4 36.7 16.9 Computer and Information Systems Managers (MGR)
24.1 30.4 45.5 27.0 24.1 48.9 Software Developers, Applications and Systems Software (CMM)
63.2 18.1 18.7 39.2 35.6 25.2 Computer Programmers (CMM)
58.2 24.1 17.7 50.5 31.0 18.5 Other Computer and Mathematical (CMM)
---------- ---------- ---------- ---------- ---------- ---------- ----------
40.3 28.1 31.7 35.1 27.5 37.4 Total Computer and Mathematical (CMM & MGR)
47.8 41.8 10.3 44.2 36.0 19.7 Architectural and Engineering Managers (MGR)
42.2 40.4 17.4 37.4 35.5 27.1 Architectural and Engineering (ENG)
85.8 0.0 14.2 0.0 100.0 0.0 Natural Sciences Managers (MGR)
68.9 15.3 15.8 51.0 24.2 24.8 Life, physical, and social science (SCI)
80.2 14.7 5.1 53.8 39.1 7.1 Medical and Health Services Managers (MGR)
58.9 31.3 9.8 52.9 37.5 9.6 Medical and Health Services (MED & HLS)
44.9 43.3 11.7 55.4 26.9 17.7 Financial Managers (MGR)
50.9 36.3 12.8 44.2 40.5 15.3 Accountants and Auditors (FIN)
60.3 26.6 13.1 63.2 26.8 10.0 Other Financial (FIN)
71.2 18.1 10.6 60.3 23.8 15.9 Other Managers (MGR)
64.0 18.4 17.6 57.0 21.9 21.1 Other Workers
---------- ---------- ---------- ---------- ---------- ---------- ----------
61.5 21.2 17.3 53.1 25.1 21.8 TOTAL (all occupations)
Source: Integrated Public Use Microdata Series (IPUMS), United States Census Bureau
Create extract with variables STATEFIP, COUNTY, MET2013, PUMA, CITIZEN, EMPSTAT, and OCC.
The variables YEAR, DATANUM, SERIAL, HHWT, GQ, PERNUM, and PERWT are automatically preselected.
For samples, select ACS for 2015. For data format, select STATA. For structure, select rectangular.
For more information, see IPUMS Documentation: User's Guide
Note: Citizen by birth = born in U.S., Guam, Puerto Rico, U.S. Virgin Islands or
Northern Marianas, or born abroad of American parent(s);
Tables and plots generated with R source code linked below.
North Bay Workforce: 2015
            Employed Population by Citizenship Status, 2015

San Mateo county                     San Francisco county
-----------------------------------  ----------------------------------
    Citizen  Naturalized      Not a     Citizen  Naturalized      Not a
   by birth     Citizen     Citizen    by birth     Citizen     Citizen  Occupation
 ----------  ----------  ----------  ----------  ----------  ----------  ----------
      1,526         758         970       3,266       1,382         140  Computer and Information Systems Managers (MGR)
      5,488       3,980       3,531      14,583       2,305       3,728  Software Developers, Applications and Systems Software (CMM)
        504         322         510       2,268         610         741  Computer Programmers (CMM)
      4,531       2,762       1,865      11,295       2,028       2,863  Other Computer and Mathematical (CMM)
 ----------  ----------  ----------  ----------  ----------  ----------  ----------
     12,049       7,822       6,876      31,412       6,325       7,472  Total Computer and Mathematical (CMM & MGR)
        760         657         111         967         189         639  Architectural and Engineering Managers (MGR)
      3,951       3,371       1,110       7,844       1,761       2,272  Architectural and Engineering (ENG)
        124          86           0         271          69           0  Natural Sciences Managers (MGR)
      4,769       3,101       1,413       6,759       1,277       1,432  Life, physical, and social science (SCI)
      1,584         355         144       1,277         430         391  Medical and Health Services Managers (MGR)
     14,531      10,763       3,249      19,658       6,437       2,235  Medical and Health Services (MED & HLS)
      2,072       1,371          52       6,330       1,141         683  Financial Managers (MGR)
      3,336       2,528       1,186       5,460       2,333         598  Accountants and Auditors (FIN)
      3,518       1,673         133       7,177       2,337         778  Other Financial (FIN)
     28,143       8,625       5,881      49,418      10,188       5,928  Other Managers (MGR)
    153,867      63,046      50,201     193,240      69,811      52,666  Other Workers
 ----------  ----------  ----------  ----------  ----------  ----------  ----------
    228,704     103,398      70,356     329,813     102,298      75,094  TOTAL (all occupations)
===================================================================================
      Percent of Employed Population by Citizenship Status, 2015

San Mateo county                     San Francisco county
-----------------------------------  ----------------------------------
    Citizen  Naturalized      Not a     Citizen  Naturalized      Not a
   by birth     Citizen     Citizen    by birth     Citizen     Citizen  Occupation
 ----------  ----------  ----------  ----------  ----------  ----------  ----------
       46.9        23.3        29.8        68.2        28.9         2.9  Computer and Information Systems Managers (MGR)
       42.2        30.6        27.2        70.7        11.2        18.1  Software Developers, Applications and Systems Software (CMM)
       37.7        24.1        38.2        62.7        16.9        20.5  Computer Programmers (CMM)
       49.5        30.2        20.4        69.8        12.5        17.7  Other Computer and Mathematical (CMM)
 ----------  ----------  ----------  ----------  ----------  ----------  ----------
       45.0        29.2        25.7        69.5        14.0        16.5  Total Computer and Mathematical (CMM & MGR)
       49.7        43.0         7.3        53.9        10.5        35.6  Architectural and Engineering Managers (MGR)
       46.9        40.0        13.2        66.0        14.8        19.1  Architectural and Engineering (ENG)
       59.0        41.0         0.0        79.7        20.3         0.0  Natural Sciences Managers (MGR)
       51.4        33.4        15.2        71.4        13.5        15.1  Life, physical, and social science (SCI)
       76.0        17.0         6.9        60.9        20.5        18.6  Medical and Health Services Managers (MGR)
       50.9        37.7        11.4        69.4        22.7         7.9  Medical and Health Services (MED & HLS)
       59.3        39.2         1.5        77.6        14.0         8.4  Financial Managers (MGR)
       47.3        35.9        16.8        65.1        27.8         7.1  Accountants and Auditors (FIN)
       66.1        31.4         2.5        69.7        22.7         7.6  Other Financial (FIN)
       66.0        20.2        13.8        75.4        15.5         9.0  Other Managers (MGR)
       57.6        23.6        18.8        61.2        22.1        16.7  Other Workers
 ----------  ----------  ----------  ----------  ----------  ----------  ----------
       56.8        25.7        17.5        65.0        20.2        14.8  TOTAL (all occupations)

Source: Integrated Public Use Microdata Series (IPUMS), United States Census Bureau
        Create extract with variables STATEFIP, COUNTY, MET2013, PUMA, CITIZEN, EMPSTAT, and OCC.
        The variables YEAR, DATANUM, SERIAL, HHWT, GQ, PERNUM, and PERWT are automatically preselected.
        For samples, select ACS for 2015. For data format, select STATA. For structure, select rectangular.
        For more information, see IPUMS Documentation: User's Guide
Note: Citizen by birth = born in U.S., Guam, Puerto Rico, U.S. Virgin Islands or
      Northern Marianas, or born abroad of American parent(s);
      Tables and plots generated with R source code linked below.
Source code for acs_stem15.R (common code for creating htm and pngs)
Source code for acs_stem_sv15.R (specific code for Silicon Valley)
Silicon Valley Workforce Statistics
San Francisco Bay Workforce Statistics
Information on H-1B Visas
Commentary on the Skills Gap
Go to Budget Home Page