Employed Population by Citizenship Status, 2015
Silicon Valley Area San Francisco Area
----------------------------------- ----------------------------------
Santa Clara & San Mateo counties Alameda & San Francisco counties
----------------------------------- ----------------------------------
Citizen Naturalized Not a Citizen Naturalized Not a
by birth Citizen Citizen by birth Citizen Citizen Occupation
---------- ---------- ---------- ---------- ---------- ---------- ----------
5,195 3,663 2,309 5,175 3,644 1,356 Computer and Information Systems Managers (MGR)
24,384 20,797 37,700 22,620 12,444 18,907 Software Developers, Applications and Systems Software (CMM)
3,795 3,304 2,624 5,794 1,621 1,787 Computer Programmers (CMM)
18,979 11,618 7,161 25,513 7,910 7,185 Other Computer and Mathematical (CMM)
---------- ---------- ---------- ---------- ---------- ---------- ----------
52,353 39,382 49,794 59,102 25,619 29,235 Total Computer and Mathematical (CMM & MGR)
3,448 2,848 1,310 1,494 650 753 Architectural and Engineering Managers (MGR)
23,723 22,146 15,415 17,902 11,386 6,431 Architectural and Engineering (ENG)
124 247 0 683 69 68 Natural Sciences Managers (MGR)
12,010 6,532 4,935 19,122 4,024 4,264 Life, physical, and social science (SCI)
4,031 2,134 466 3,727 878 546 Medical and Health Services Managers (MGR)
44,700 32,174 8,730 54,164 24,784 7,949 Medical and Health Services (MED & HLS)
6,231 3,392 1,379 9,779 4,466 1,582 Financial Managers (MGR)
11,161 9,710 3,891 12,843 7,592 2,454 Accountants and Auditors (FIN)
9,670 4,283 1,107 12,490 4,678 1,929 Other Financial (FIN)
91,821 33,773 22,669 105,855 24,531 14,362 Other Managers (MGR)
483,929 189,988 172,098 551,354 172,476 151,036 Other Workers
---------- ---------- ---------- ---------- ---------- ---------- ----------
743,201 346,609 281,794 848,515 281,153 220,609 TOTAL (all occupations)
==================================================================================
Percent of Employed Population by Citizenship Status, 2015
Silicon Valley Area San Francisco Area
----------------------------------- ----------------------------------
Santa Clara & San Mateo counties Alameda & San Francisco counties
----------------------------------- ----------------------------------
Citizen Naturalized Not a Citizen Naturalized Not a
by birth Citizen Citizen by birth Citizen Citizen Occupation
---------- ---------- ---------- ---------- ---------- ---------- ----------
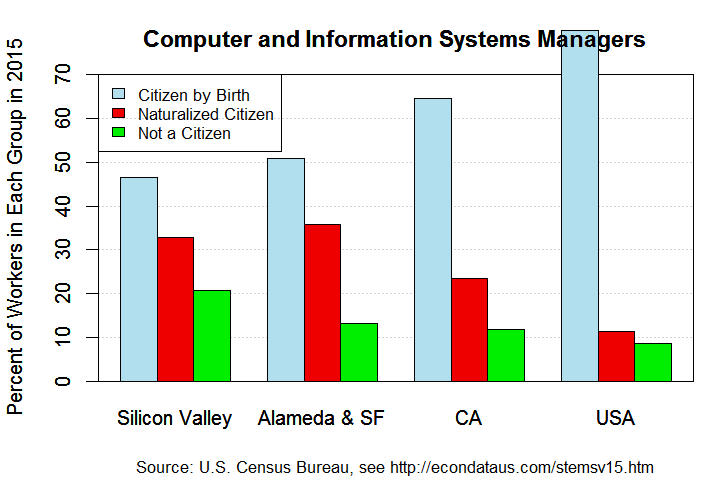
46.5 32.8 20.7 50.9 35.8 13.3 Computer and Information Systems Managers (MGR)
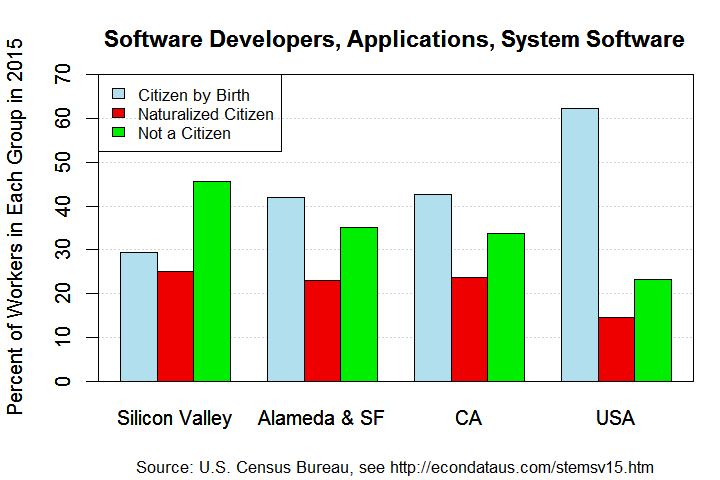
29.4 25.1 45.5 41.9 23.1 35.0 Software Developers, Applications and Systems Software (CMM)
39.0 34.0 27.0 63.0 17.6 19.4 Computer Programmers (CMM)
50.3 30.8 19.0 62.8 19.5 17.7 Other Computer and Mathematical (CMM)
---------- ---------- ---------- ---------- ---------- ---------- ----------
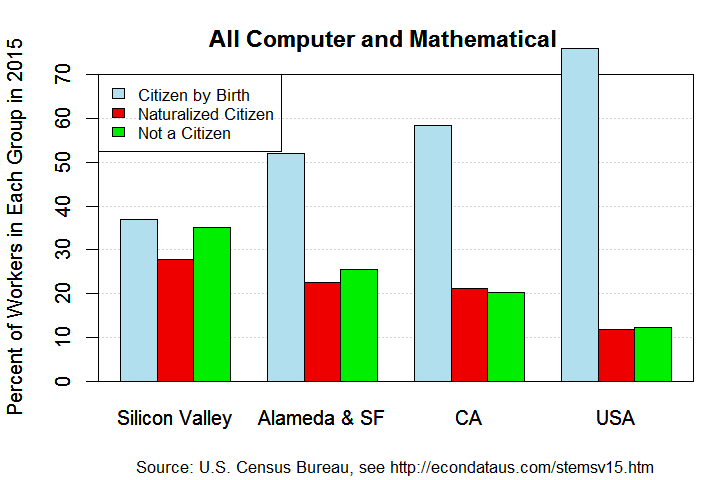
37.0 27.8 35.2 51.9 22.5 25.7 Total Computer and Mathematical (CMM & MGR)
45.3 37.4 17.2 51.6 22.4 26.0 Architectural and Engineering Managers (MGR)
38.7 36.1 25.2 50.1 31.9 18.0 Architectural and Engineering (ENG)
33.4 66.6 0.0 83.3 8.4 8.3 Natural Sciences Managers (MGR)
51.2 27.8 21.0 69.8 14.7 15.6 Life, physical, and social science (SCI)
60.8 32.2 7.0 72.4 17.0 10.6 Medical and Health Services Managers (MGR)
52.2 37.6 10.2 62.3 28.5 9.1 Medical and Health Services (MED & HLS)
56.6 30.8 12.5 61.8 28.2 10.0 Financial Managers (MGR)
45.1 39.2 15.7 56.1 33.2 10.7 Accountants and Auditors (FIN)
64.2 28.4 7.4 65.4 24.5 10.1 Other Financial (FIN)
61.9 22.8 15.3 73.1 16.9 9.9 Other Managers (MGR)
57.2 22.5 20.3 63.0 19.7 17.3 Other Workers
---------- ---------- ---------- ---------- ---------- ---------- ----------
54.2 25.3 20.5 62.8 20.8 16.3 TOTAL (all occupations)
Source: Integrated Public Use Microdata Series (IPUMS), United States Census Bureau
Create extract with variables STATEFIP, COUNTY, MET2013, PUMA, CITIZEN, EMPSTAT, and OCC.
The variables YEAR, DATANUM, SERIAL, HHWT, GQ, PERNUM, and PERWT are automatically preselected.
For samples, select ACS for 2015. For data format, select STATA. For structure, select rectangular.
For more information, see IPUMS Documentation: User's Guide
Note: Citizen by birth = born in U.S., Guam, Puerto Rico, U.S. Virgin Islands or
Northern Marianas, or born abroad of American parent(s);
Tables and plots generated with R source code linked below.
United States and California Workforce: 2015
            Employed Population by Citizenship Status, 2015

United States                        California
-----------------------------------  ----------------------------------
    Citizen  Naturalized      Not a     Citizen  Naturalized      Not a
   by birth     Citizen     Citizen    by birth     Citizen     Citizen  Occupation
 ----------  ----------  ----------  ----------  ----------  ----------  ----------
    465,890      66,548      50,199      42,503      15,558       7,863  Computer and Information Systems Managers (MGR)
    739,246     174,821     275,425     102,399      56,811      80,879  Software Developers, Applications and Systems Software (CMM)
    326,676      61,799      52,878      36,635      13,852      12,001  Computer Programmers (CMM)
  2,153,235     271,452     221,475     213,777      57,990      36,263  Other Computer and Mathematical (CMM)
 ----------  ----------  ----------  ----------  ----------  ----------  ----------
  3,685,047     574,620     599,977     395,314     144,211     137,006  Total Computer and Mathematical (CMM & MGR)
    121,798      20,083      12,212      14,101       6,980       4,434  Architectural and Engineering Managers (MGR)
  2,193,408     328,851     191,791     226,857     100,613      53,343  Architectural and Engineering (ENG)
     15,699       2,485       2,174       1,551         951         290  Natural Sciences Managers (MGR)
  1,032,154     141,228     152,731     127,818      33,377      24,343  Life, physical, and social science (SCI)
    582,030      60,183      18,380      51,538      16,150       3,935  Medical and Health Services Managers (MGR)
 10,363,080   1,454,766     613,214     825,131     311,135     104,202  Medical and Health Services (MED & HLS)
  1,007,395     115,328      52,774      94,990      28,372      10,782  Financial Managers (MGR)
  1,617,590     231,255      88,507     150,795      66,135      22,147  Accountants and Auditors (FIN)
  1,242,723     121,433      49,085     126,467      32,182      12,385  Other Financial (FIN)
 11,267,549   1,014,045     661,608   1,173,870     272,717     142,817  Other Managers (MGR)
 92,719,907   8,523,805  10,714,365   8,784,090   2,139,840   2,570,236  Other Workers
 ----------  ----------  ----------  ----------  ----------  ----------  ----------
125,848,380  12,588,082  13,156,818  11,972,522   3,152,663   3,085,920  TOTAL (all occupations)
===================================================================================
      Percent of Employed Population by Citizenship Status, 2015

United States                        California
-----------------------------------  ----------------------------------
    Citizen  Naturalized      Not a     Citizen  Naturalized      Not a
   by birth     Citizen     Citizen    by birth     Citizen     Citizen  Occupation
 ----------  ----------  ----------  ----------  ----------  ----------  ----------
       80.0        11.4         8.6        64.5        23.6        11.9  Computer and Information Systems Managers (MGR)
       62.1        14.7        23.2        42.7        23.7        33.7  Software Developers, Applications and Systems Software (CMM)
       74.0        14.0        12.0        58.6        22.2        19.2  Computer Programmers (CMM)
       81.4        10.3         8.4        69.4        18.8        11.8  Other Computer and Mathematical (CMM)
 ----------  ----------  ----------  ----------  ----------  ----------  ----------
       75.8        11.8        12.3        58.4        21.3        20.3  Total Computer and Mathematical (CMM & MGR)
       79.0        13.0         7.9        55.3        27.4        17.4  Architectural and Engineering Managers (MGR)
       80.8        12.1         7.1        59.6        26.4        14.0  Architectural and Engineering (ENG)
       77.1        12.2        10.7        55.6        34.1        10.4  Natural Sciences Managers (MGR)
       77.8        10.6        11.5        68.9        18.0        13.1  Life, physical, and social science (SCI)
       88.1         9.1         2.8        72.0        22.5         5.5  Medical and Health Services Managers (MGR)
       83.4        11.7         4.9        66.5        25.1         8.4  Medical and Health Services (MED & HLS)
       85.7         9.8         4.5        70.8        21.2         8.0  Financial Managers (MGR)
       83.5        11.9         4.6        63.1        27.7         9.3  Accountants and Auditors (FIN)
       87.9         8.6         3.5        73.9        18.8         7.2  Other Financial (FIN)
       87.1         7.8         5.1        73.9        17.2         9.0  Other Managers (MGR)
       82.8         7.6         9.6        65.1        15.9        19.0  Other Workers
 ----------  ----------  ----------  ----------  ----------  ----------  ----------
       83.0         8.3         8.7        65.7        17.3        16.9  TOTAL (all occupations)

Source: Integrated Public Use Microdata Series (IPUMS), United States Census Bureau
        Create extract with variables STATEFIP, COUNTY, MET2013, PUMA, CITIZEN, EMPSTAT, and OCC.
        The variables YEAR, DATANUM, SERIAL, HHWT, GQ, PERNUM, and PERWT are automatically preselected.
        For samples, select ACS for 2015. For data format, select STATA. For structure, select rectangular.
        For more information, see IPUMS Documentation: User's Guide
Note: Citizen by birth = born in U.S., Guam, Puerto Rico, U.S. Virgin Islands or
      Northern Marianas, or born abroad of American parent(s);
      Tables and plots generated with R source code linked below.