Government and Washington DC Metro Area Workforce: 2013
Employed Population by Citizenship Status, 2013
Federal Government State Government
----------------------------------- ----------------------------------
Citizen Naturalized Not a Citizen Naturalized Not a
by birth Citizen Citizen by birth Citizen Citizen Occupation
---------- ---------- ---------- ---------- ---------- ---------- ----------
18,811 1,731 751 21,586 1,543 135 Computer and Information Systems Managers (MGR)
31,588 2,341 745 12,294 1,693 2,649 Software Developers, Applications and Systems Software (CMM)
10,580 1,203 210 19,303 3,643 1,068 Computer Programmers (CMM)
150,057 13,270 3,661 120,919 11,104 6,929 Other Computer and Mathematical (CMM)
---------- ---------- ---------- ---------- ---------- ---------- ----------
211,036 18,545 5,367 174,102 17,983 10,781 Total Computer and Mathematical (CMM & MGR)
6,392 620 39 1,975 392 262 Architectural and Engineering Managers (MGR)
144,920 15,495 2,179 70,601 12,658 4,318 Architectural and Engineering (ENG)
1,270 0 263 1,900 58 320 Natural Sciences Managers (MGR)
104,000 10,616 9,877 130,510 11,400 21,596 Life, physical, and social science (SCI)
18,854 2,419 263 24,194 1,853 697 Medical and Health Services Managers (MGR)
258,413 38,100 5,622 392,040 57,339 17,046 Medical and Health Services (MED & HLS)
20,461 1,994 1,241 18,224 672 439 Financial Managers (MGR)
59,262 7,176 1,654 80,697 10,223 2,405 Accountants and Auditors (FIN)
58,885 5,357 1,621 37,424 4,228 708 Other Financial (FIN)
380,394 22,679 13,645 447,869 22,577 10,248 Other Managers (MGR)
3,069,261 216,899 63,073 4,765,544 283,954 201,299 Other Workers
---------- ---------- ---------- ---------- ---------- ---------- ----------
4,333,148 339,900 104,844 6,145,080 423,337 270,119 TOTAL (all occupations)
==================================================================================
Percent of Employed Population by Citizenship Status, 2013
Federal Government State Government
----------------------------------- ----------------------------------
Citizen Naturalized Not a Citizen Naturalized Not a
by birth Citizen Citizen by birth Citizen Citizen Occupation
---------- ---------- ---------- ---------- ---------- ---------- ----------
88.3 8.1 3.5 92.8 6.6 0.6 Computer and Information Systems Managers (MGR)
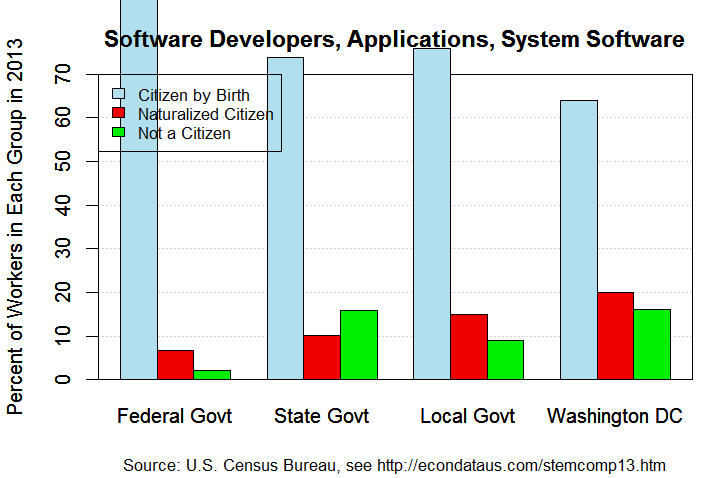
91.1 6.8 2.1 73.9 10.2 15.9 Software Developers, Applications and Systems Software (CMM)
88.2 10.0 1.8 80.4 15.2 4.4 Computer Programmers (CMM)
89.9 7.9 2.2 87.0 8.0 5.0 Other Computer and Mathematical (CMM)
---------- ---------- ---------- ---------- ---------- ---------- ----------
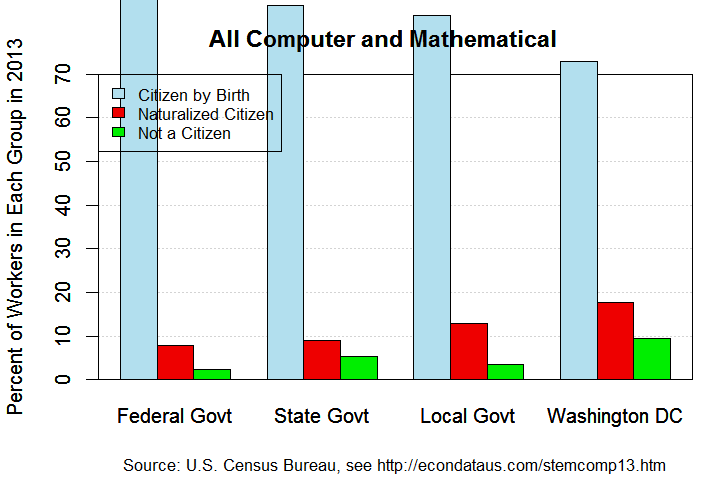
89.8 7.9 2.3 85.8 8.9 5.3 Total Computer and Mathematical (CMM & MGR)
90.7 8.8 0.6 75.1 14.9 10.0 Architectural and Engineering Managers (MGR)
89.1 9.5 1.3 80.6 14.5 4.9 Architectural and Engineering (ENG)
82.8 0.0 17.2 83.4 2.5 14.0 Natural Sciences Managers (MGR)
83.5 8.5 7.9 79.8 7.0 13.2 Life, physical, and social science (SCI)
87.5 11.2 1.2 90.5 6.9 2.6 Medical and Health Services Managers (MGR)
85.5 12.6 1.9 84.1 12.3 3.7 Medical and Health Services (MED & HLS)
86.3 8.4 5.2 94.3 3.5 2.3 Financial Managers (MGR)
87.0 10.5 2.4 86.5 11.0 2.6 Accountants and Auditors (FIN)
89.4 8.1 2.5 88.3 10.0 1.7 Other Financial (FIN)
91.3 5.4 3.3 93.2 4.7 2.1 Other Managers (MGR)
91.6 6.5 1.9 90.8 5.4 3.8 Other Workers
---------- ---------- ---------- ---------- ---------- ---------- ----------
90.7 7.1 2.2 89.9 6.2 3.9 TOTAL (all occupations)
Source: Integrated Public Use Microdata Series (IPUMS), United States Census Bureau
Create extract with variables STATEFIP, COUNTY, MET2013, PUMA, CITIZEN, EMPSTAT, and OCC.
The variables YEAR, DATANUM, SERIAL, HHWT, GQ, PERNUM, and PERWT are automatically preselected.
For samples, select ACS for 2013. For data format, select STATA. For structure, select rectangular.
For more information, see IPUMS Documentation: User's Guide
Note: Citizen by birth = born in U.S., Guam, Puerto Rico, U.S. Virgin Islands or
Northern Marianas, or born abroad of American parent(s);
Tables and plots generated with R source code linked below.
Government and Washington DC Metro Area Workforce: 2013
            Employed Population by Citizenship Status, 2013

Local Government                     Washington-Arlington-Alexandria
-----------------------------------  ----------------------------------
    Citizen  Naturalized      Not a     Citizen  Naturalized      Not a
   by birth     Citizen     Citizen    by birth     Citizen     Citizen  Occupation
 ----------  ----------  ----------  ----------  ----------  ----------  ----------
     17,275       1,941         532      19,058       4,191       1,064  Computer and Information Systems Managers (MGR)
      4,677         921         558      37,823      11,769       9,455  Software Developers, Applications and Systems Software (CMM)
     10,333       2,575         578       8,326       3,172       1,586  Computer Programmers (CMM)
     89,701      13,477       3,478     107,846      22,945       9,990  Other Computer and Mathematical (CMM)
 ----------  ----------  ----------  ----------  ----------  ----------  ----------
    121,986      18,914       5,146     173,053      42,077      22,095  Total Computer and Mathematical (CMM & MGR)
      2,360         239           0       2,568         433         115  Architectural and Engineering Managers (MGR)
     61,935      13,371       1,876      53,280      10,754       4,653  Architectural and Engineering (ENG)
        263           0           0       1,279         148         254  Natural Sciences Managers (MGR)
     82,913       8,852       3,177      36,524       9,194      10,190  Life, physical, and social science (SCI)
     17,441       2,561         127       9,013       2,268         177  Medical and Health Services Managers (MGR)
    399,549      63,458      18,024     123,147      44,037      21,251  Medical and Health Services (MED & HLS)
     28,850       2,392         517      21,293       6,077       3,314  Financial Managers (MGR)
     66,996      11,664       2,182      45,367      13,820       6,391  Accountants and Auditors (FIN)
     51,040       5,576         525      27,754       4,073       2,541  Other Financial (FIN)
    530,346      29,697       6,978     290,085      39,889      23,120  Other Managers (MGR)
  7,636,312     541,382     204,581   1,464,165     270,463     343,762  Other Workers
 ----------  ----------  ----------  ----------  ----------  ----------  ----------
  8,999,991     698,106     243,133   2,247,528     443,233     437,863  TOTAL (all occupations)
===================================================================================
      Percent of Employed Population by Citizenship Status, 2013

Local Government                     Washington-Arlington-Alexandria
-----------------------------------  ----------------------------------
    Citizen  Naturalized      Not a     Citizen  Naturalized      Not a
   by birth     Citizen     Citizen    by birth     Citizen     Citizen  Occupation
 ----------  ----------  ----------  ----------  ----------  ----------  ----------
       87.5         9.8         2.7        78.4        17.2         4.4  Computer and Information Systems Managers (MGR)
       76.0        15.0         9.1        64.1        19.9        16.0  Software Developers, Applications and Systems Software (CMM)
       76.6        19.1         4.3        63.6        24.2        12.1  Computer Programmers (CMM)
       84.1        12.6         3.3        76.6        16.3         7.1  Other Computer and Mathematical (CMM)
 ----------  ----------  ----------  ----------  ----------  ----------  ----------
       83.5        13.0         3.5        72.9        17.7         9.3  Total Computer and Mathematical (CMM & MGR)
       90.8         9.2         0.0        82.4        13.9         3.7  Architectural and Engineering Managers (MGR)
       80.2        17.3         2.4        77.6        15.7         6.8  Architectural and Engineering (ENG)
      100.0         0.0         0.0        76.1         8.8        15.1  Natural Sciences Managers (MGR)
       87.3         9.3         3.3        65.3        16.4        18.2  Life, physical, and social science (SCI)
       86.6        12.7         0.6        78.7        19.8         1.5  Medical and Health Services Managers (MGR)
       83.1        13.2         3.7        65.4        23.4        11.3  Medical and Health Services (MED & HLS)
       90.8         7.5         1.6        69.4        19.8        10.8  Financial Managers (MGR)
       82.9        14.4         2.7        69.2        21.1         9.7  Accountants and Auditors (FIN)
       89.3         9.8         0.9        80.8        11.9         7.4  Other Financial (FIN)
       93.5         5.2         1.2        82.2        11.3         6.5  Other Managers (MGR)
       91.1         6.5         2.4        70.4        13.0        16.5  Other Workers
 ----------  ----------  ----------  ----------  ----------  ----------  ----------
       90.5         7.0         2.4        71.8        14.2        14.0  TOTAL (all occupations)

Source: Integrated Public Use Microdata Series (IPUMS), United States Census Bureau
        Create extract with variables STATEFIP, COUNTY, MET2013, PUMA, CITIZEN, EMPSTAT, and OCC.
        The variables YEAR, DATANUM, SERIAL, HHWT, GQ, PERNUM, and PERWT are automatically preselected.
        For samples, select ACS for 2013. For data format, select STATA. For structure, select rectangular.
        For more information, see IPUMS Documentation: User's Guide
Note: Citizen by birth = born in U.S., Guam, Puerto Rico, U.S. Virgin Islands or
      Northern Marianas, or born abroad of American parent(s);
      Tables and plots generated with R source code linked below.
Source code for acs_stem.R (common code for creating htm and pngs)
Source code for acs_stem_sv13.R (specific code for Silicon Valley)
Source code for acs_stem_tx13.R (specific code for Texas)
Source code for acs_stem_gov13.R (specific code for Government)
Silicon Valley Workforce Statistics
Texas Workforce Statistics
Information on H-1B Visas
Commentary on the Skills Gap
Go to Budget Home Page