H-1B Data
OPT Data
The output in this article was generated by an expanded version of the R Shiny app at this link. This app uses Census data from IPUMS-USA (Integrated Public Use Microdata Series from the United States). The specific samples included are the 5% State sample for 1980 and 1990, the 5% Sample for 2000, and the ACS (American Community Survey) for the years 2001 through 2018. These surveys are all described at this link.
The following table shows the 50 U.S. counties with the lowest percentage of U.S. born software developers, sorted by that percentage. The individual foreign birthplaces listed are India and China because those are the birthplaces that have the largest percentage of software developers overall.
Programmers, Software developers, app & system SW: 2018, grouped by BIRTHPLACE_TECH (percent)

   Year                 COUNTY  Count U.S._Born India China Other
1  2018    Middlesex County NJ 18,228      18.7  61.3   6.7  13.3
2  2018       Hudson County NJ 13,746      21.2  53.1  10.2  15.5
3  2018      Forsyth County GA  5,898      21.4  68.6   1.9   8.1
4  2018      Tolland County CT  1,432      24.3  75.7   0.0   0.0
5  2018      Alameda County CA 48,897      24.6  50.0  12.0  13.3
6  2018  Santa Clara County CA 88,430      24.9  32.8  23.2  19.1
7  2018       Mercer County NJ  3,861      27.5  41.5  11.7  19.3
8  2018     Somerset County NJ  6,526      28.6  39.0  18.4  14.0
9  2018    San Mateo County CA 17,104      29.8  23.0  16.8  30.4
10 2018   New Castle County DE  3,964      31.4  33.9  10.7  24.0
11 2018      El Paso County TX  1,318      31.6   0.0   0.0  68.4
12 2018      Passaic County NJ  1,748      34.8  20.9   0.0  44.2
13 2018  San Joaquin County CA  1,787      35.0  36.4  13.9  14.7
14 2018         Will County IL  1,471      36.2  57.0   3.7   3.2
15 2018    Fort Bend County TX  3,425      36.7  30.0   3.4  29.9
16 2018       Lorain County OH  1,155      38.1   0.0   0.0  61.9
17 2018 Contra Costa County CA 12,080      38.7  28.7  11.2  21.4
18 2018      Broward County FL  6,694      40.1   5.5   2.4  52.0
19 2018       Bergen County NJ  7,455      40.5  17.4   7.1  35.1
20 2018     Richmond County NY  2,217      41.1   1.8   0.0  57.1
21 2018       Collin County TX 18,895      41.6  35.6   3.7  19.0
22 2018       McLean County IL  2,005      41.9  53.6   0.0   4.4
23 2018       Benton County AR  1,909      43.1  39.4   0.0  17.5
24 2018      Henrico County VA  3,773      43.8  46.1   2.9   7.2
25 2018       Orange County CA 23,486      45.5  19.3   9.6  25.6
26 2018         King County WA 80,283      45.5  21.1  13.8  19.5
27 2018      Chester County PA  7,391      45.6  43.3   7.5   3.5
28 2018         Yolo County CA  1,378      46.7  30.9   9.5  12.8
29 2018      Loudoun County VA 14,311      46.9  34.7   3.0  15.4
30 2018  Mecklenburg County NC  8,839      47.0  48.2   0.0   4.8
31 2018       Albany County NY  1,779      47.7  29.7  17.0   5.6
32 2018     Delaware County OH  2,818      48.3  36.4   6.3   9.0
33 2018        Essex County NJ  3,106      48.6   9.9  12.5  29.0
34 2018       Morris County NJ  4,937      48.8  25.4   2.8  23.1
35 2018       Dallas County TX 17,573      50.1  38.3   0.9  10.6
36 2018    Fairfield County CT  8,295      50.2  25.5   8.1  16.2
37 2018         Lake County IL  7,041      50.7  19.3  11.0  19.1
38 2018       Denton County TX 10,928      51.3  30.7   2.0  16.1
39 2018   Washington County OR 13,413      51.3  22.8   6.4  19.6
40 2018       Harris County TX 18,668      51.3  30.8   4.3  13.6
41 2018       Camden County NJ  1,675      51.5   5.1  16.8  26.6
42 2018    Champaign County IL  1,403      51.5  10.6   0.0  37.8
43 2018        Duval County FL  6,060      51.9  29.3   4.2  14.6
44 2018  Los Angeles County CA 44,444      52.2  12.2   5.8  29.8
45 2018      Oakland County MI 13,294      52.7  27.1   9.0  11.2
46 2018    Jefferson County AL  2,739      52.8  22.3   4.8  20.0
47 2018      Johnson County KS  9,543      52.9  36.3   5.9   4.9
48 2018   Montgomery County MD 13,303      53.0   7.1  14.4  25.5
49 2018       DuPage County IL 12,402      53.1  34.1   8.4   4.5
50 2018        Bronx County NY  3,092      53.7  10.9   0.0  35.4

URL parameters (short)=
?minyear=2018&maxyear=2018&STATE=&geo=COUNTY&occ=Programmers,%20Software%20developers,%20app%20&%20system%20SW&group=BIRTHPLACE_TECH&sortn=4&sortdir=Ascending&mincount=1000&totrows=50
The following table shows the 50 U.S. counties with the highest percentage of India born software developers, sorted by that percentage. The reason for sorting by India is that this is the foreign country with the highest percentages and hence with the highest likely risk of bias and/or nepotism in hiring.
Programmers, Software developers, app & system SW: 2018, grouped by BIRTHPLACE_TECH (percent)

   Year                 COUNTY  Count U.S._Born India China Other
1  2018      Tolland County CT  1,432      24.3  75.7   0.0   0.0
2  2018      Forsyth County GA  5,898      21.4  68.6   1.9   8.1
3  2018    Middlesex County NJ 18,228      18.7  61.3   6.7  13.3
4  2018         Will County IL  1,471      36.2  57.0   3.7   3.2
5  2018       McLean County IL  2,005      41.9  53.6   0.0   4.4
6  2018       Hudson County NJ 13,746      21.2  53.1  10.2  15.5
7  2018      Alameda County CA 48,897      24.6  50.0  12.0  13.3
8  2018  Mecklenburg County NC  8,839      47.0  48.2   0.0   4.8
9  2018      Henrico County VA  3,773      43.8  46.1   2.9   7.2
10 2018      Chester County PA  7,391      45.6  43.3   7.5   3.5
11 2018   Rensselaer County NY  1,010      57.6  42.4   0.0   0.0
12 2018       Mercer County NJ  3,861      27.5  41.5  11.7  19.3
13 2018       Butler County OH  1,252      60.4  39.6   0.0   0.0
14 2018       Benton County AR  1,909      43.1  39.4   0.0  17.5
15 2018     Somerset County NJ  6,526      28.6  39.0  18.4  14.0
16 2018       Dallas County TX 17,573      50.1  38.3   0.9  10.6
17 2018     Delaware County OH  2,818      48.3  36.4   6.3   9.0
18 2018  San Joaquin County CA  1,787      35.0  36.4  13.9  14.7
19 2018      Johnson County KS  9,543      52.9  36.3   5.9   4.9
20 2018       Collin County TX 18,895      41.6  35.6   3.7  19.0
21 2018      Loudoun County VA 14,311      46.9  34.7   3.0  15.4
22 2018       DuPage County IL 12,402      53.1  34.1   8.4   4.5
23 2018   New Castle County DE  3,964      31.4  33.9  10.7  24.0
24 2018  Santa Clara County CA 88,430      24.9  32.8  23.2  19.1
25 2018     Hartford County CT  6,685      54.5  32.1   1.5  11.9
26 2018       Warren County OH  1,409      59.1  31.7   0.0   9.2
27 2018         Yolo County CA  1,378      46.7  30.9   9.5  12.8
28 2018       Harris County TX 18,668      51.3  30.8   4.3  13.6
29 2018       Denton County TX 10,928      51.3  30.7   2.0  16.1
30 2018    Fort Bend County TX  3,425      36.7  30.0   3.4  29.9
31 2018       Albany County NY  1,779      47.7  29.7  17.0   5.6
32 2018       Marion County IN  4,174      62.5  29.6   0.0   7.9
33 2018        Duval County FL  6,060      51.9  29.3   4.2  14.6
34 2018     Hennepin County MN 16,824      62.7  28.9   0.9   7.4
35 2018 Contra Costa County CA 12,080      38.7  28.7  11.2  21.4
36 2018   Williamson County TN  2,015      69.2  28.3   2.5   0.0
37 2018    St. Louis County MO 10,818      59.1  27.7   4.2   9.0
38 2018        Anoka County MN  1,419      72.9  27.1   0.0   0.0
39 2018      Oakland County MI 13,294      52.7  27.1   9.0  11.2
40 2018         Lake County IN  1,342      73.8  26.2   0.0   0.0
41 2018     Guilford County NC  1,029      74.2  25.8   0.0   0.0
42 2018    Fairfield County CT  8,295      50.2  25.5   8.1  16.2
43 2018       Morris County NJ  4,937      48.8  25.4   2.8  23.1
44 2018        Union County NJ  3,373      57.7  25.1   2.7  14.5
45 2018 Hillsborough County FL  8,414      54.4  24.9   0.9  19.7
46 2018   Montgomery County PA 10,420      65.5  24.4   2.8   7.4
47 2018       Medina County OH  1,024      76.3  23.7   0.0   0.0
48 2018    San Mateo County CA 17,104      29.8  23.0  16.8  30.4
49 2018   Washington County OR 13,413      51.3  22.8   6.4  19.6
50 2018         Leon County FL  1,380      64.4  22.8   0.0  12.8

URL parameters (short)=
?minyear=2018&maxyear=2018&STATE=&geo=COUNTY&occ=Programmers,%20Software%20developers,%20app%20&%20system%20SW&group=BIRTHPLACE_TECH&sortn=5&mincount=1000&totrows=50
The following two graphs and tables show the change in demographics of software developers in Hudson and Middlesex counties in New Jersey from 1980 to 2018. As can be seen, the percentage of their software developers who were born in India were 53.1 and 61.3, respectively. These were the two largest percentages for counties with over 10,000 developers. These two counties border New York City. Hence, many of these jobs may be connected with the financial industry.
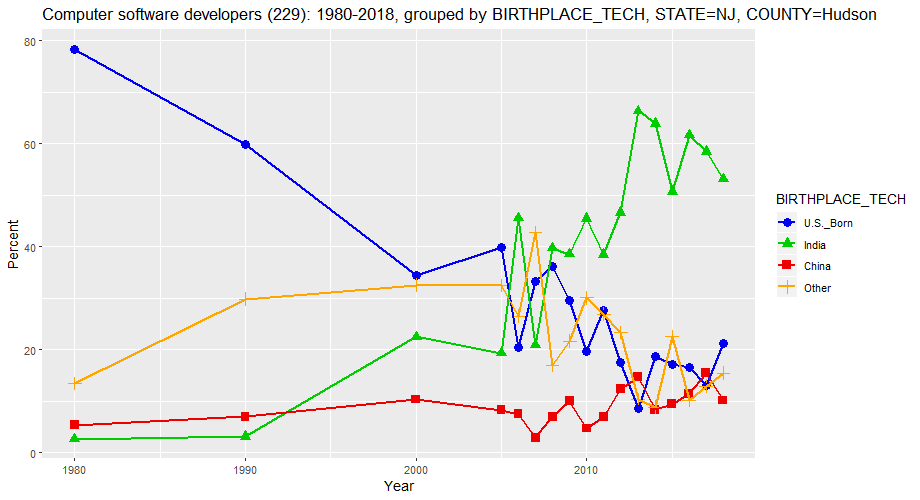
Computer software developers (229): 1980-2018, grouped by BIRTHPLACE_TECH, STATE=NJ, COUNTY=Hudson (percent)

   Year           COUNTY  Count U.S._Born India China Other
1  1980 Hudson County NJ    740      78.4   2.7   5.4  13.5
2  1990 Hudson County NJ  1,992      59.9   3.2   7.0  29.9
3  2000 Hudson County NJ  4,507      34.5  22.5  10.4  32.6
4  2005 Hudson County NJ  4,738      39.8  19.4   8.3  32.5
5  2006 Hudson County NJ  5,239      20.4  45.5   7.5  26.6
6  2007 Hudson County NJ  5,482      33.3  20.9   3.0  42.8
7  2008 Hudson County NJ  6,118      36.2  39.7   7.0  17.0
8  2009 Hudson County NJ  4,847      29.6  38.6  10.1  21.7
9  2010 Hudson County NJ  5,793      19.6  45.5   4.8  30.1
10 2011 Hudson County NJ  7,817      27.7  38.5   6.9  26.9
11 2012 Hudson County NJ  8,703      17.6  46.6  12.4  23.4
12 2013 Hudson County NJ  7,022       8.6  66.4  14.7  10.4
13 2014 Hudson County NJ  7,728      18.8  63.9   8.4   8.9
14 2015 Hudson County NJ  9,209      17.2  50.7   9.5  22.6
15 2016 Hudson County NJ 10,092      16.6  61.7  11.5  10.3
16 2017 Hudson County NJ  8,836      13.1  58.4  15.5  13.0
17 2018 Hudson County NJ 13,746      21.2  53.1  10.2  15.5

URL parameters (short)=
?minyear=1980&maxyear=2018&STATE=NJ&COUNTY=Hudson&geo=COUNTY&occ=Computer%20software%20developers%20(229)&group=BIRTHPLACE_TECH&sortn=4&mincount=1&totrows=50&color=blue2,green3,red2,orange1&geomtype=Line%20Graph
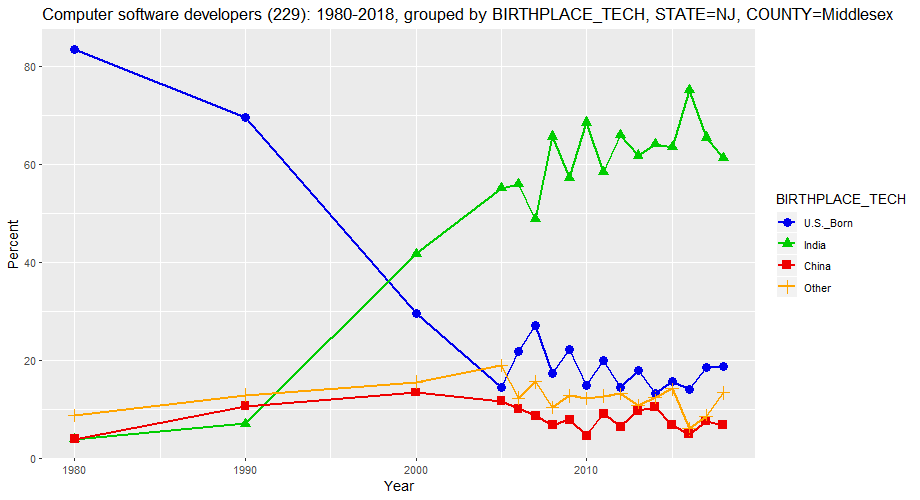
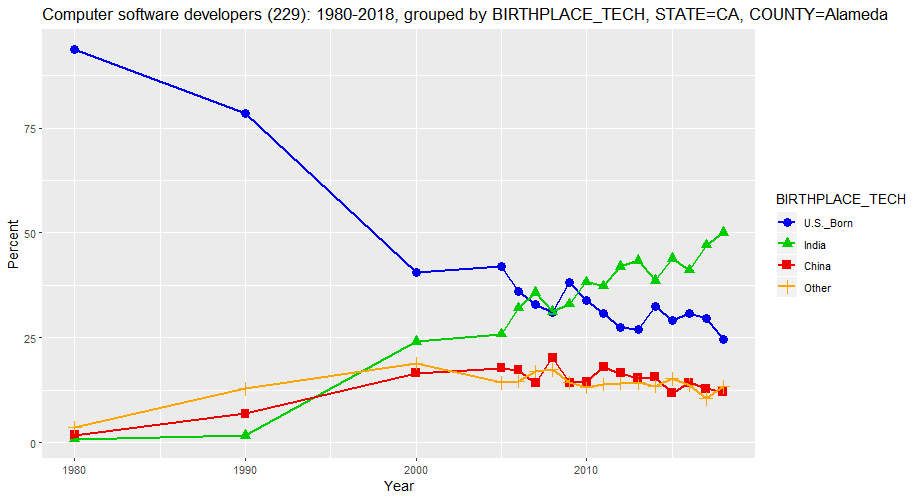
Computer software developers (229): 1980-2018, grouped by BIRTHPLACE_TECH, STATE=NJ, COUNTY=Middlesex (percent)

   Year              COUNTY  Count U.S._Born India China Other
1  1980 Middlesex County NJ  2,060      83.5   3.9   3.9   8.7
2  1990 Middlesex County NJ  5,449      69.6   7.0  10.6  12.8
3  2000 Middlesex County NJ 14,303      29.4  41.7  13.4  15.5
4  2005 Middlesex County NJ 13,286      14.4  55.1  11.6  18.9
5  2006 Middlesex County NJ 11,687      21.8  55.9  10.0  12.2
6  2007 Middlesex County NJ 14,980      27.0  48.8   8.6  15.5
7  2008 Middlesex County NJ 16,213      17.3  65.7   6.7  10.4
8  2009 Middlesex County NJ 13,138      22.2  57.2   7.8  12.7
9  2010 Middlesex County NJ 14,448      14.8  68.5   4.5  12.2
10 2011 Middlesex County NJ 14,470      20.0  58.3   9.0  12.7
11 2012 Middlesex County NJ 14,885      14.5  65.9   6.4  13.2
12 2013 Middlesex County NJ 12,948      17.9  61.7   9.7  10.7
13 2014 Middlesex County NJ 14,795      13.2  64.1  10.4  12.4
14 2015 Middlesex County NJ 13,812      15.7  63.4   6.7  14.1
15 2016 Middlesex County NJ 13,830      14.0  75.1   4.8   6.0
16 2017 Middlesex County NJ 15,402      18.5  65.4   7.5   8.5
17 2018 Middlesex County NJ 18,228      18.7  61.3   6.7  13.3

URL parameters (short)=
?minyear=1980&maxyear=2018&STATE=NJ&COUNTY=Middlesex&geo=COUNTY&occ=Computer%20software%20developers%20(229)&group=BIRTHPLACE_TECH&sortn=4&mincount=1&totrows=50&color=blue2,green3,red2,orange1&geomtype=Line%20Graph
The following two graphs and tables show the change in demographics of software developers in Alameda and Santa Clara counties in California from 1980 to 2018. As can be seen, the percentage of their software developers who were born in India were 50.0 and 32.8, respectively. These counties are in the area known as "Silicon Valley". Regarding the boundaries of this area, Wikipedia says the following:
The geographical boundaries of Silicon Valley have changed over the years, traditionally Silicon Valley is known as Santa Clara County, southern San Mateo County and southern Alameda county. However, over the years this geographical area has been expanded to include San Francisco County, Contra Costa County, and the northern parts of Alameda County and San Mateo County, this shift has occurred due to the expansion in the local economy and the development of new technologies.
One item of note in the two graphs above and the two graphs below (and many of those following) is that the percentages of software developers born in India tend to have been close to zero until 1990 at which point they began to grow. This is likely due to the H-1B visa which was created by the Immigration Act of 1990. This connection to the H-1B visa seems to have been generally less for software developers born in China and other countries.
 <
<Computer software developers (229): 1980-2018, grouped by BIRTHPLACE_TECH, STATE=CA, COUNTY=Alameda (percent) Year COUNTY Count U.S._Born India China Other 1 1980 Alameda County CA 2,260 93.8 0.9 1.8 3.5 2 1990 Alameda County CA 6,794 78.5 1.7 6.9 12.8 3 2000 Alameda County CA 20,473 40.5 24.1 16.6 18.9 4 2005 Alameda County CA 18,805 42.0 25.9 17.8 14.3 5 2006 Alameda County CA 19,851 36.0 32.1 17.3 14.6 6 2007 Alameda County CA 24,022 33.0 35.8 14.2 17.0 7 2008 Alameda County CA 17,616 31.1 31.2 20.3 17.4 8 2009 Alameda County CA 21,447 38.3 33.1 14.3 14.4 9 2010 Alameda County CA 20,199 34.0 38.3 14.6 13.1 10 2011 Alameda County CA 20,975 30.8 37.3 18.1 13.8 11 2012 Alameda County CA 24,480 27.4 41.9 16.6 14.2 12 2013 Alameda County CA 25,526 27.0 43.4 15.4 14.3 13 2014 Alameda County CA 29,970 32.4 38.6 15.6 13.4 14 2015 Alameda County CA 38,938 29.2 43.8 11.8 15.2 15 2016 Alameda County CA 44,341 30.9 41.1 14.3 13.7 16 2017 Alameda County CA 39,393 29.6 47.0 12.9 10.4 17 2018 Alameda County CA 48,897 24.6 50.0 12.0 13.3 URL parameters (short)= ?minyear=1980&maxyear=2018&COUNTY=Alameda&geo=COUNTY&occ=Computer%20software%20developers%20(229)&group=BIRTHPLACE_TECH&sortn=4&mincount=1&totrows=50&color=blue2,green3,red2,orange1&geomtype=Line%20Graph
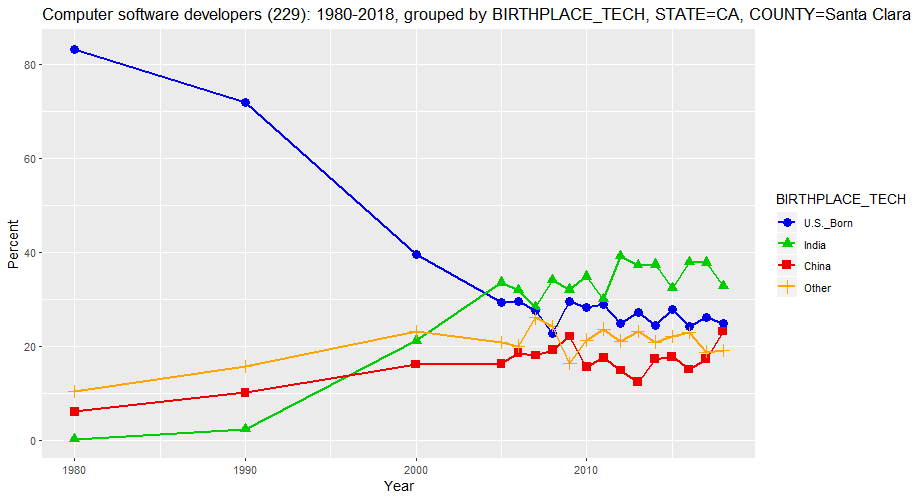
Computer software developers (229): 1980-2018, grouped by BIRTHPLACE_TECH, STATE=CA, COUNTY=Santa Clara (percent)

   Year                COUNTY  Count U.S._Born India China Other
1  1980 Santa Clara County CA  6,900      83.2   0.3   6.1  10.4
2  1990 Santa Clara County CA 12,993      71.8   2.4  10.1  15.7
3  2000 Santa Clara County CA 47,667      39.6  21.2  16.1  23.1
4  2005 Santa Clara County CA 39,754      29.3  33.6  16.3  20.9
5  2006 Santa Clara County CA 52,282      29.5  32.0  18.5  20.0
6  2007 Santa Clara County CA 47,764      27.6  28.3  18.1  26.0
7  2008 Santa Clara County CA 52,573      22.6  34.0  19.2  24.2
8  2009 Santa Clara County CA 48,555      29.5  32.0  22.1  16.4
9  2010 Santa Clara County CA 52,260      28.3  34.8  15.6  21.3
10 2011 Santa Clara County CA 54,744      28.8  30.0  17.6  23.6
11 2012 Santa Clara County CA 58,637      24.9  39.1  14.9  21.1
12 2013 Santa Clara County CA 63,361      27.2  37.3  12.4  23.1
13 2014 Santa Clara County CA 74,352      24.5  37.3  17.3  20.9
14 2015 Santa Clara County CA 78,269      27.8  32.4  17.8  22.1
15 2016 Santa Clara County CA 85,011      24.2  37.8  15.1  22.9
16 2017 Santa Clara County CA 90,412      26.2  37.8  17.3  18.8
17 2018 Santa Clara County CA 88,430      24.9  32.8  23.2  19.1

URL parameters (short)=
?minyear=1980&maxyear=2018&COUNTY=Santa%20Clara&geo=COUNTY&occ=Computer%20software%20developers%20(229)&group=BIRTHPLACE_TECH&sortn=4&mincount=1&totrows=50&color=blue2,green3,red2,orange1&geomtype=Line%20Graph
The following graph and table are for Forsyth County, Georgia, a suburban community just north of Atlanta. It shows very rapid growth in the Indian-born population in the last few years and this is mentioned in an article titled Forsyth County has fastest-growing Asian population in U.S.. Another article states the following:
"The majority of them are in IT," Sharma said. "They're coming on [H-1B visas, which allows companies to hire foreign workers for specialty positions] or [L-1 visas for managerial, executive or specialized knowledge], then applying for their green cards and then settling here."
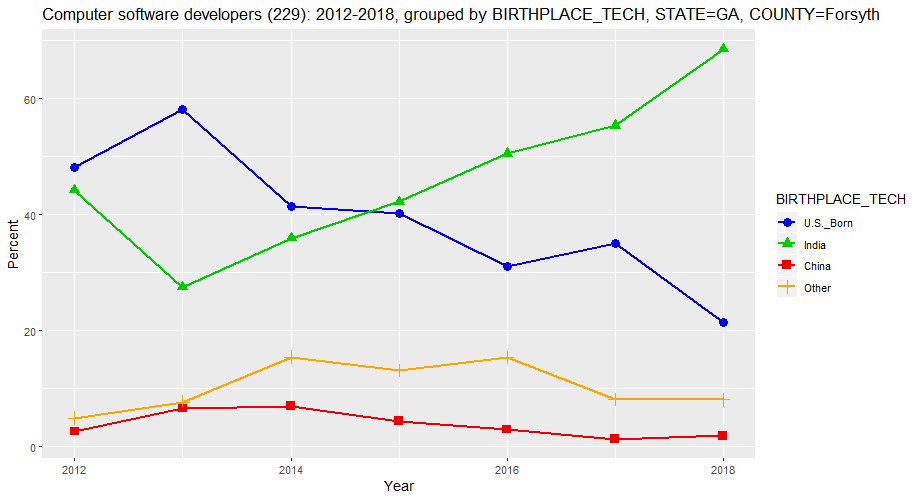
Computer software developers (229): 2012-2018, grouped by BIRTHPLACE_TECH, STATE=GA, COUNTY=Forsyth (percent)

  Year            COUNTY Count U.S._Born India China Other
1 2012 Forsyth County GA 2,007      48.2  44.2   2.6   4.9
2 2013 Forsyth County GA 3,360      58.2  27.5   6.6   7.7
3 2014 Forsyth County GA 3,020      41.5  36.0   7.0  15.5
4 2015 Forsyth County GA 3,737      40.2  42.2   4.4  13.1
5 2016 Forsyth County GA 4,275      31.1  50.5   3.0  15.4
6 2017 Forsyth County GA 4,449      35.1  55.4   1.3   8.2
7 2018 Forsyth County GA 5,898      21.4  68.6   1.9   8.1

URL parameters (short)=
?minyear=2012&maxyear=2018&STATE=GA&COUNTY=Forsyth&geo=COUNTY&occ=Computer%20software%20developers%20(229)&group=BIRTHPLACE_TECH&sortn=4&mincount=1&totrows=50&color=blue2,green3,red2,orange1&geomtype=Line%20Graph
The following graph and table are for Mecklenburg County, North Carolina which contains Charlotte. As can be seen, nearly half (48.2%) of the software developers there in 2018 were born in India.
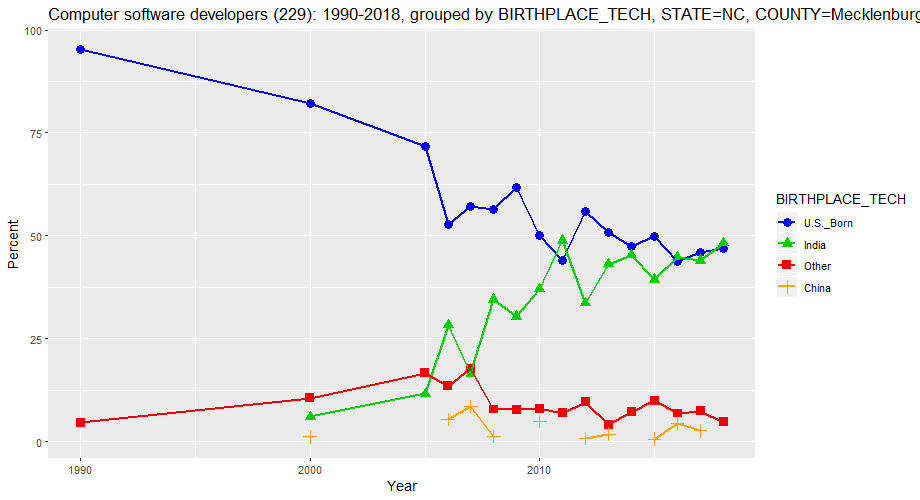
Computer software developers (229): 1990-2018, grouped by BIRTHPLACE_TECH, STATE=NC, COUNTY=Mecklenburg (percent)

   Year                COUNTY  Count U.S._Born India Other China
1  1990 Mecklenburg County NC  2,127      95.3    NA   4.7    NA
2  2000 Mecklenburg County NC  5,538      82.2   6.0  10.6   1.2
3  2005 Mecklenburg County NC  4,116      71.6  11.6  16.7    NA
4  2006 Mecklenburg County NC  6,205      52.8  28.3  13.5   5.4
5  2007 Mecklenburg County NC  4,826      57.2  16.5  17.7   8.6
6  2008 Mecklenburg County NC  5,578      56.3  34.5   7.9   1.3
7  2009 Mecklenburg County NC  5,336      61.8  30.4   7.8    NA
8  2010 Mecklenburg County NC  5,944      50.0  37.0   8.0   4.9
9  2011 Mecklenburg County NC  6,194      44.2  48.9   7.0    NA
10 2012 Mecklenburg County NC  6,492      55.8  33.6   9.7   0.9
11 2013 Mecklenburg County NC  7,519      50.9  43.1   4.2   1.8
12 2014 Mecklenburg County NC  7,355      47.5  45.3   7.2    NA
13 2015 Mecklenburg County NC 10,685      49.9  39.4  10.0   0.7
14 2016 Mecklenburg County NC  9,557      43.9  44.8   6.9   4.5
15 2017 Mecklenburg County NC 10,694      45.9  44.0   7.4   2.7
16 2018 Mecklenburg County NC  8,839      47.0  48.2   4.8    NA

URL parameters (short)=
?minyear=1990&maxyear=2018&STATE=NC&COUNTY=Mecklenburg&geo=COUNTY&occ=Computer%20software%20developers%20(229)&group=BIRTHPLACE_TECH&sortn=4&mincount=1&totrows=50&color=blue2,green3,red2,orange1&geomtype=Line%20Graph
The following graph and table are for Chester County, Pennsylvania just west of Philadelphia. As can be seen, 43.3% of the software developers there in 2018 were born in India.
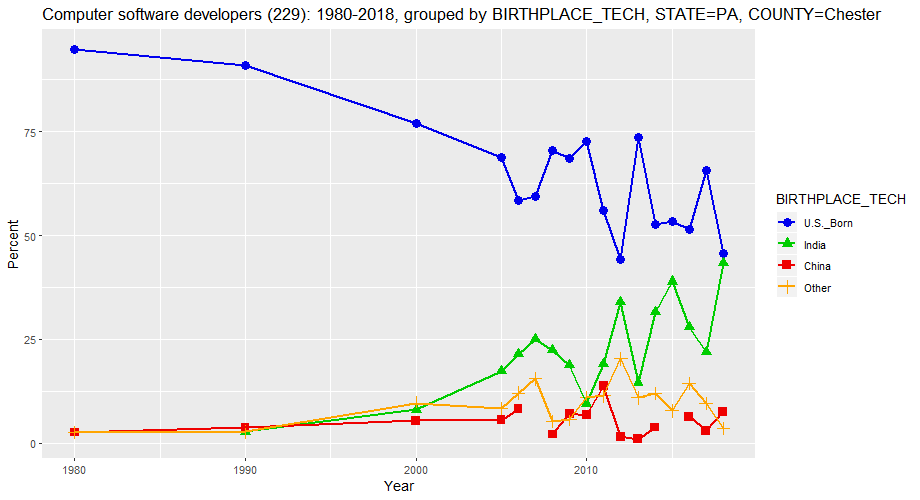
Computer software developers (229): 1980-2018, grouped by BIRTHPLACE_TECH, STATE=PA, COUNTY=Chester (percent)

   Year            COUNTY Count U.S._Born India China Other
1  1980 Chester County PA   780      94.9    NA   2.6   2.6
2  1990 Chester County PA 1,999      90.9   2.7   3.7   2.7
3  2000 Chester County PA 4,712      77.0   8.0   5.4   9.6
4  2005 Chester County PA 5,658      68.8  17.4   5.5   8.3
5  2006 Chester County PA 4,678      58.3  21.4   8.2  12.0
6  2007 Chester County PA 4,773      59.5  25.1    NA  15.5
7  2008 Chester County PA 5,900      70.4  22.3   2.1   5.2
8  2009 Chester County PA 3,769      68.5  18.8   7.1   5.7
9  2010 Chester County PA 5,436      72.8   9.5   6.7  11.0
10 2011 Chester County PA 6,655      55.9  19.0  13.7  11.4
11 2012 Chester County PA 5,371      44.3  33.9   1.5  20.3
12 2013 Chester County PA 5,438      73.6  14.5   1.0  10.9
13 2014 Chester County PA 5,965      52.7  31.5   3.8  12.0
14 2015 Chester County PA 7,387      53.3  38.9    NA   7.8
15 2016 Chester County PA 6,603      51.5  27.9   6.3  14.4
16 2017 Chester County PA 7,853      65.7  21.8   2.9   9.5
17 2018 Chester County PA 7,391      45.6  43.3   7.5   3.5

URL parameters (short)=
?minyear=1980&maxyear=2018&STATE=PA&COUNTY=Chester&geo=COUNTY&occ=Computer%20software%20developers%20(229)&group=BIRTHPLACE_TECH&sortn=4&mincount=1&totrows=50&color=blue2,green3,red2,orange1&geomtype=Line%20Graph
The following graph and table are for Somerset County, New Jersey. Somerset County borders Middlesex County which itself borders New York City. As can be seen, 39.0% of the software developers there in 2018 were born in India.
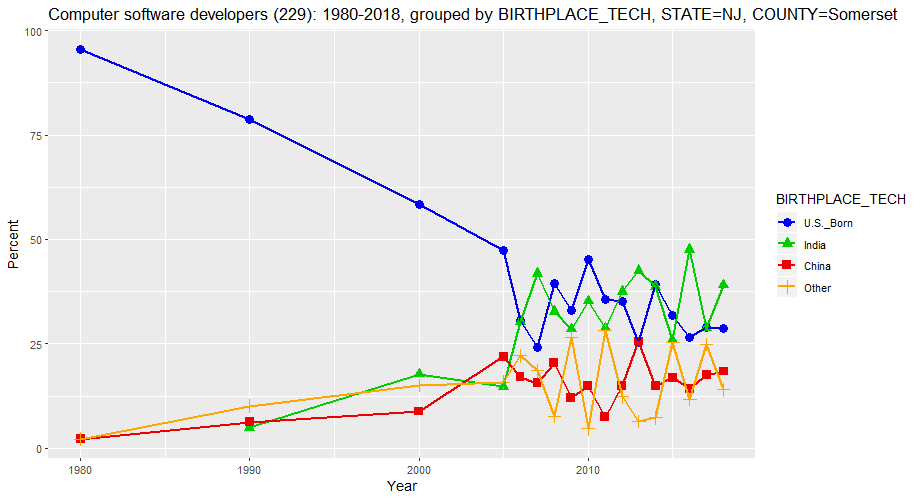
Computer software developers (229): 1980-2018, grouped by BIRTHPLACE_TECH, STATE=NJ, COUNTY=Somerset (percent)

   Year             COUNTY Count U.S._Born India China Other
1  1980 Somerset County NJ   900      95.6    NA   2.2   2.2
2  1990 Somerset County NJ 2,630      78.7   4.9   6.2  10.1
3  2000 Somerset County NJ 4,903      58.4  17.7   8.8  15.0
4  2005 Somerset County NJ 3,920      47.4  14.8  21.9  15.9
5  2006 Somerset County NJ 4,680      30.5  30.3  17.1  22.2
6  2007 Somerset County NJ 5,196      24.1  41.8  15.6  18.6
7  2008 Somerset County NJ 4,707      39.4  32.7  20.3   7.6
8  2009 Somerset County NJ 4,841      32.9  28.5  12.1  26.5
9  2010 Somerset County NJ 5,047      45.2  35.2  14.9   4.7
10 2011 Somerset County NJ 4,068      35.5  28.8   7.4  28.3
11 2012 Somerset County NJ 5,173      35.2  37.5  14.9  12.3
12 2013 Somerset County NJ 4,448      25.4  42.5  25.6   6.5
13 2014 Somerset County NJ 4,948      39.2  38.7  14.9   7.3
14 2015 Somerset County NJ 3,955      31.9  25.8  16.9  25.4
15 2016 Somerset County NJ 5,316      26.6  47.6  14.2  11.6
16 2017 Somerset County NJ 3,903      29.0  28.7  17.5  24.8
17 2018 Somerset County NJ 6,526      28.6  39.0  18.4  14.0

URL parameters (short)=
?minyear=1980&maxyear=2018&STATE=NJ&COUNTY=Somerset&geo=COUNTY&occ=Computer%20software%20developers%20(229)&group=BIRTHPLACE_TECH&sortn=4&mincount=1&totrows=50&color=blue2,green3,red2,orange1&geomtype=Line%20Graph
The following two graphs and tables are for Dallas and Collin counties, Texas. Dallas County contains the city of Dallas and Collin County is just north of it. As can be seen, 38.3 and 35.6 percent of the software developers in Dallas and Collin counties, respectively, were born in India.
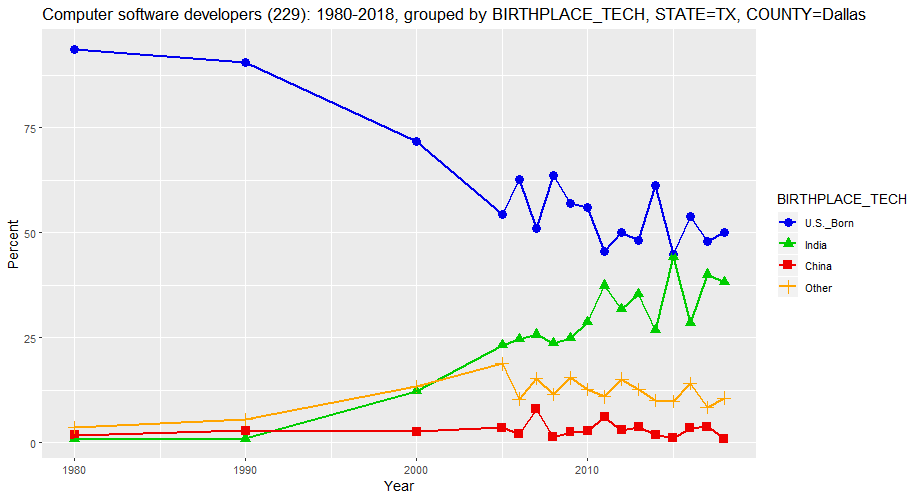
Computer software developers (229): 1980-2018, grouped by BIRTHPLACE_TECH, STATE=TX, COUNTY=Dallas (percent)

   Year           COUNTY  Count U.S._Born India China Other
1  1980 Dallas County TX  4,420      93.7   0.9   1.8   3.6
2  1990 Dallas County TX  8,219      90.5   1.0   2.9   5.6
3  2000 Dallas County TX 15,500      71.7  12.3   2.6  13.4
4  2005 Dallas County TX 10,597      54.3  23.3   3.6  18.8
5  2006 Dallas County TX 11,483      62.8  24.7   2.1  10.4
6  2007 Dallas County TX  9,740      51.0  25.7   8.0  15.3
7  2008 Dallas County TX 12,135      63.5  23.7   1.3  11.5
8  2009 Dallas County TX 10,692      57.0  24.9   2.6  15.5
9  2010 Dallas County TX 10,993      55.9  28.6   2.8  12.7
10 2011 Dallas County TX 13,313      45.6  37.4   6.1  10.9
11 2012 Dallas County TX 15,642      50.1  31.8   3.0  15.2
12 2013 Dallas County TX 16,077      48.2  35.4   3.7  12.7
13 2014 Dallas County TX 14,853      61.1  26.8   2.0  10.1
14 2015 Dallas County TX 13,934      44.8  44.3   1.1   9.9
15 2016 Dallas County TX 17,763      53.9  28.5   3.5  14.2
16 2017 Dallas County TX 16,730      47.9  40.0   3.8   8.4
17 2018 Dallas County TX 17,573      50.1  38.3   0.9  10.6

URL parameters (short)=
?minyear=1980&maxyear=2018&STATE=TX&COUNTY=Dallas&geo=COUNTY&occ=Computer%20software%20developers%20(229)&group=BIRTHPLACE_TECH&sortn=4&mincount=1&totrows=50&color=blue2,green3,red2,orange1&geomtype=Line%20Graph
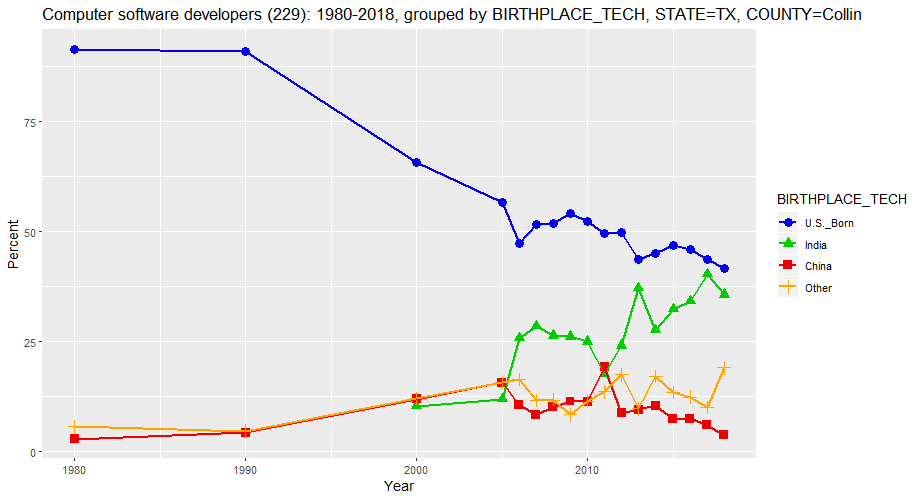
Computer software developers (229): 1980-2018, grouped by BIRTHPLACE_TECH, STATE=TX, COUNTY=Collin (percent)

   Year           COUNTY  Count U.S._Born India China Other
1  1980 Collin County TX    700      91.4    NA   2.9   5.7
2  1990 Collin County TX  3,000      91.0    NA   4.3   4.7
3  2000 Collin County TX 12,925      65.8  10.3  11.9  12.0
4  2005 Collin County TX 14,681      56.7  11.9  15.7  15.7
5  2006 Collin County TX 14,303      47.2  25.8  10.6  16.4
6  2007 Collin County TX 13,986      51.5  28.5   8.4  11.6
7  2008 Collin County TX 15,528      51.9  26.3  10.1  11.7
8  2009 Collin County TX 12,437      54.2  26.1  11.4   8.3
9  2010 Collin County TX 13,108      52.3  24.9  11.4  11.4
10 2011 Collin County TX 13,554      49.6  17.6  19.1  13.6
11 2012 Collin County TX 14,937      49.8  24.1   8.7  17.4
12 2013 Collin County TX 12,099      43.7  37.1   9.5   9.7
13 2014 Collin County TX 18,317      45.0  27.6  10.4  17.1
14 2015 Collin County TX 19,712      46.8  32.3   7.4  13.4
15 2016 Collin County TX 17,323      46.0  34.2   7.5  12.4
16 2017 Collin County TX 19,963      43.7  40.3   6.0  10.0
17 2018 Collin County TX 18,895      41.6  35.6   3.7  19.0

URL parameters (short)=
?minyear=1980&maxyear=2018&STATE=TX&COUNTY=Collin&geo=COUNTY&occ=Computer%20software%20developers%20(229)&group=BIRTHPLACE_TECH&sortn=4&mincount=1&totrows=50&color=blue2,green3,red2,orange1&geomtype=Line%20Graph
The following graph and table are for Johnson County, Kansas, just southwest of Kansas City, Missouri. As can be seen, 36.3% of the software developers there in 2018 were born in India.
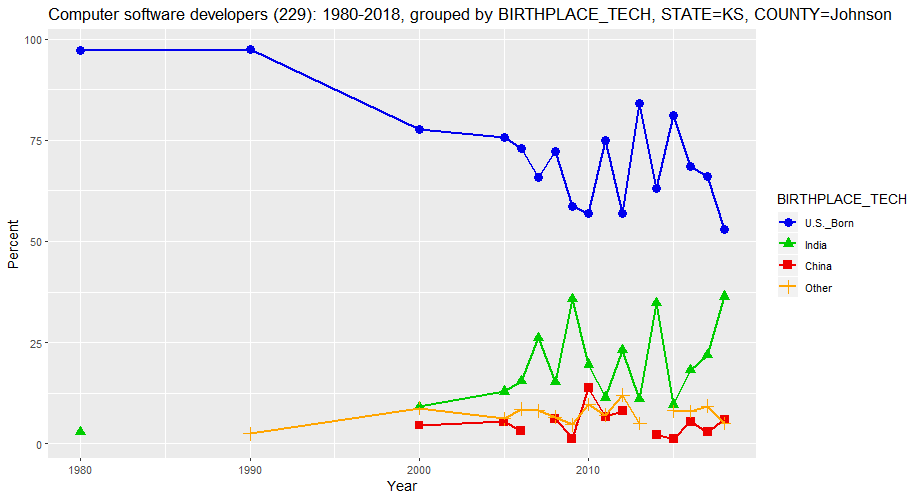
Computer software developers (229): 1980-2018, grouped by BIRTHPLACE_TECH, STATE=KS, COUNTY=Johnson (percent)

   Year            COUNTY Count U.S._Born India China Other
1  1980 Johnson County KS   720      97.2   2.8    NA    NA
2  1990 Johnson County KS 1,781      97.6    NA    NA   2.4
3  2000 Johnson County KS 5,659      77.7   9.1   4.5   8.8
4  2005 Johnson County KS 5,791      75.8  12.8   5.3   6.1
5  2006 Johnson County KS 6,762      73.0  15.4   3.1   8.5
6  2007 Johnson County KS 5,366      65.8  26.1    NA   8.1
7  2008 Johnson County KS 5,258      72.2  15.1   6.1   6.5
8  2009 Johnson County KS 5,378      58.6  35.7   1.2   4.6
9  2010 Johnson County KS 6,232      57.0  19.5  13.7   9.7
10 2011 Johnson County KS 5,052      75.1  11.3   6.6   7.0
11 2012 Johnson County KS 5,614      56.9  23.1   8.0  12.0
12 2013 Johnson County KS 5,520      84.0  11.0    NA   5.0
13 2014 Johnson County KS 5,730      63.1  34.7   2.2    NA
14 2015 Johnson County KS 7,743      81.2   9.6   1.1   8.1
15 2016 Johnson County KS 9,725      68.6  18.1   5.3   7.9
16 2017 Johnson County KS 8,509      66.0  21.9   2.8   9.3
17 2018 Johnson County KS 9,543      52.9  36.3   5.9   4.9

URL parameters (short)=
?minyear=1980&maxyear=2018&STATE=KS&COUNTY=Johnson&geo=COUNTY&occ=Computer%20software%20developers%20(229)&group=BIRTHPLACE_TECH&sortn=4&mincount=1&totrows=50&color=blue2,green3,red2,orange1&geomtype=Line%20Graph
The following graph and table are for Loudoun County, Virginia, just northwest of Washington DC. As can be seen, 34.7% of the software developers there in 2018 were born in India.
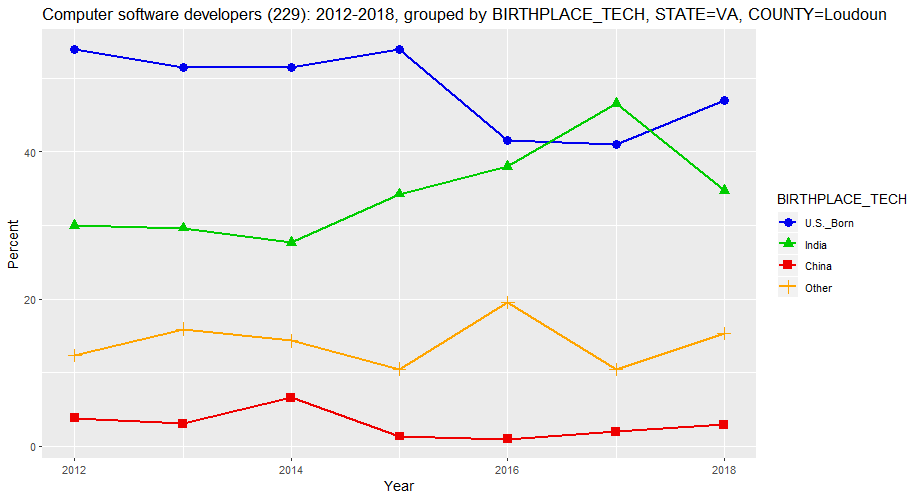
Computer software developers (229): 2012-2018, grouped by BIRTHPLACE_TECH, STATE=VA, COUNTY=Loudoun (percent)

  Year            COUNTY  Count U.S._Born India China Other
1 2012 Loudoun County VA  7,930      53.9  29.9   3.9  12.3
2 2013 Loudoun County VA  9,373      51.4  29.6   3.1  15.9
3 2014 Loudoun County VA  7,910      51.4  27.6   6.6  14.3
4 2015 Loudoun County VA 10,101      53.9  34.2   1.4  10.5
5 2016 Loudoun County VA 12,582      41.5  38.0   1.0  19.5
6 2017 Loudoun County VA 12,867      41.1  46.5   2.0  10.4
7 2018 Loudoun County VA 14,311      46.9  34.7   3.0  15.4

URL parameters (short)=
?minyear=2012&maxyear=2018&STATE=VA&COUNTY=Loudoun&geo=COUNTY&occ=Computer%20software%20developers%20(229)&group=BIRTHPLACE_TECH&sortn=4&mincount=1&totrows=50&color=blue2,green3,red2,orange1&geomtype=Line%20Graph
The following graph and table are for DuPage County, Illinois, just west of Chicago, As can be seen, 34.1% of the software developers there in 2018 were born in India.
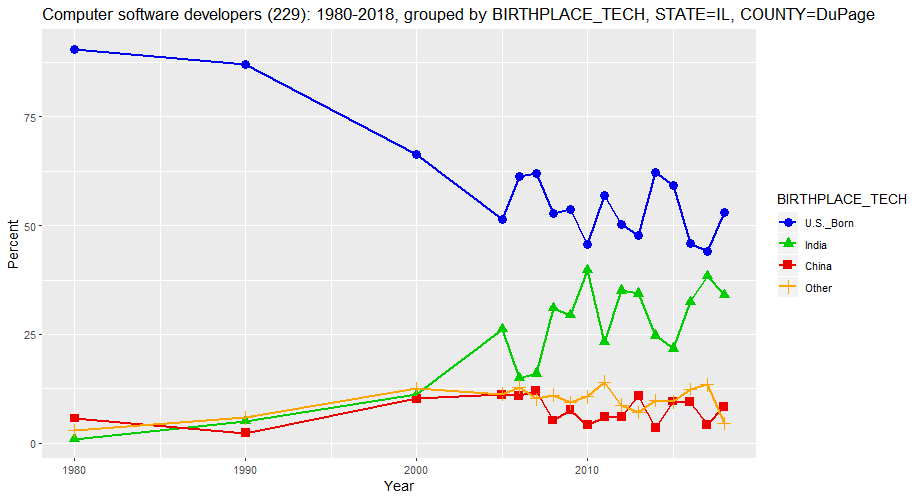
Computer software developers (229): 1980-2018, grouped by BIRTHPLACE_TECH, STATE=IL, COUNTY=DuPage (percent)

   Year           COUNTY  Count U.S._Born India China Other
1  1980 DuPage County IL  2,120      90.6   0.9   5.7   2.8
2  1990 DuPage County IL  5,121      86.9   5.0   2.3   5.8
3  2000 DuPage County IL 12,832      66.3  11.1  10.2  12.5
4  2005 DuPage County IL  9,946      51.4  26.2  11.1  11.3
5  2006 DuPage County IL  7,487      61.4  14.9  10.8  12.8
6  2007 DuPage County IL  8,297      61.9  16.0  11.9  10.2
7  2008 DuPage County IL  9,992      52.8  31.0   5.2  11.0
8  2009 DuPage County IL  8,102      53.8  29.4   7.5   9.3
9  2010 DuPage County IL  6,459      45.6  39.7   4.1  10.6
10 2011 DuPage County IL  7,639      56.9  23.1   6.0  14.0
11 2012 DuPage County IL  8,716      50.2  35.1   6.0   8.7
12 2013 DuPage County IL  9,134      47.7  34.3  10.9   7.1
13 2014 DuPage County IL  9,005      62.1  24.7   3.4   9.8
14 2015 DuPage County IL  9,163      59.1  21.8   9.6   9.5
15 2016 DuPage County IL  8,223      45.8  32.5   9.4  12.4
16 2017 DuPage County IL  9,767      44.0  38.4   4.2  13.4
17 2018 DuPage County IL 12,402      53.1  34.1   8.4   4.5

URL parameters (short)=
?minyear=1980&maxyear=2018&STATE=IL&COUNTY=DuPage&geo=COUNTY&occ=Computer%20software%20developers%20(229)&group=BIRTHPLACE_TECH&sortn=4&mincount=1&totrows=50&color=blue2,green3,red2,orange1&geomtype=Line%20Graph
The following graph and table are for Hartford County, Connecticut, which contains the city of Hartford, As can be seen, 32.1% of the software developers there in 2018 were born in India.
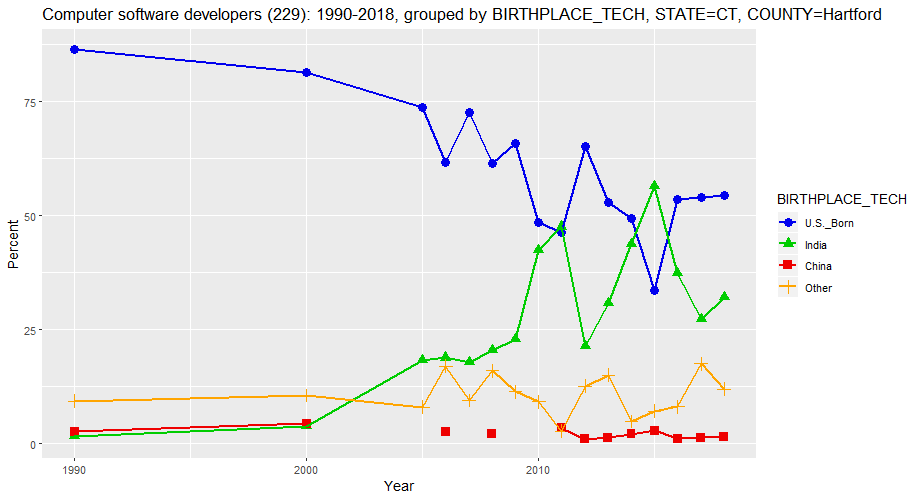
Computer software developers (229): 1990-2018, grouped by BIRTHPLACE_TECH, STATE=CT, COUNTY=Hartford (percent)

   Year             COUNTY Count U.S._Born India China Other
1  1990 Hartford County CT 4,958      86.5   1.6   2.6   9.3
2  2000 Hartford County CT 6,630      81.4   3.7   4.4  10.5
3  2005 Hartford County CT 4,067      73.7  18.3    NA   8.0
4  2006 Hartford County CT 5,685      61.7  18.8   2.6  17.0
5  2007 Hartford County CT 6,926      72.7  17.9    NA   9.4
6  2008 Hartford County CT 5,044      61.4  20.5   2.2  15.9
7  2009 Hartford County CT 5,551      65.8  22.9    NA  11.3
8  2010 Hartford County CT 5,774      48.5  42.4    NA   9.1
9  2011 Hartford County CT 5,230      46.3  47.5   3.4   2.8
10 2012 Hartford County CT 5,783      65.1  21.4   1.0  12.6
11 2013 Hartford County CT 7,867      52.9  30.8   1.3  15.0
12 2014 Hartford County CT 5,782      49.4  43.8   2.0   4.8
13 2015 Hartford County CT 7,509      33.6  56.5   2.8   7.1
14 2016 Hartford County CT 6,984      53.6  37.3   1.0   8.0
15 2017 Hartford County CT 6,529      54.1  27.2   1.2  17.5
16 2018 Hartford County CT 6,685      54.5  32.1   1.5  11.9

URL parameters (short)=
?minyear=1990&maxyear=2018&STATE=CT&COUNTY=Hartford&geo=COUNTY&occ=Computer%20software%20developers%20(229)&group=BIRTHPLACE_TECH&sortn=4&mincount=1&totrows=50&color=blue2,green3,red2,orange1&geomtype=Line%20Graph
The following graph and table are for the entire state of Utah. The reason for looking at Utah is that one of its Senators, Mike Lee, has been lobbying to pass the bill S386 by unanimous consent in the U.S. Senate. This bill is named the "Fairness for High-Skilled Immigrants Act of 2019" and would eliminate the per-country numerical limitation for employment-based immigrants and increase the per-country numerical limitation for family-sponsored immigrants, among other things. This would mainly benefit Indian workers who have been caught in a backlog due to the country cap on employment-based green cards. However, the following table shows that only 3.3 percent of the software developers in Utah in 2018 were born in India. This does bring up the question of why Mike Lee is the main proponent of this bill. It seems to affect relatively few of his current constituents. In addition, any negative affects on U.S. or non-Indian workers would seem to be relatively small in Utah, at least as long as Utah continues to have such little diversity in its own workforce. In any event, this would seem to be an argument for being very skeptical of Mike Lee's support for this bill since Utah will likely be one of the states least affected by it, assuming that the law does work as advertised and that there are no ulterior motives.
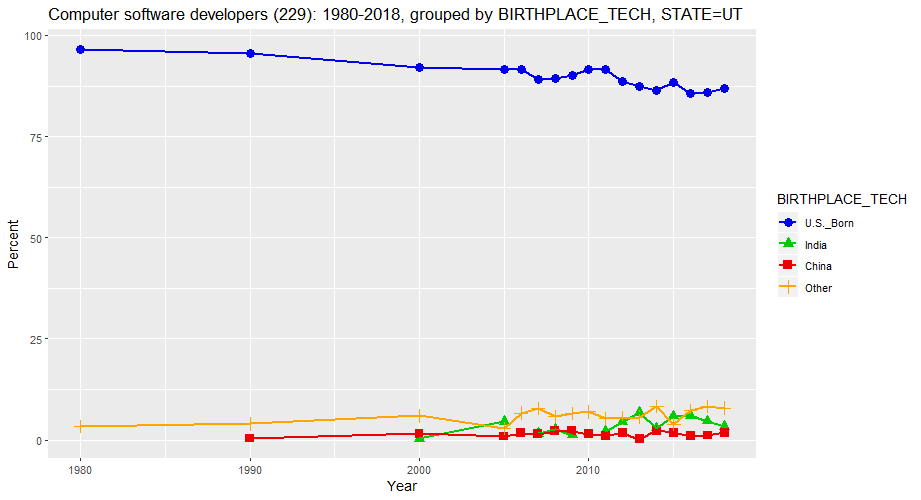
Computer software developers (229): 1980-2018, grouped by BIRTHPLACE_TECH, STATE=UT (percent)

   Year STATE  Count U.S._Born India China Other
1  1980    UT  2,360      96.6    NA    NA   3.4
2  1990    UT  4,945      95.6    NA   0.4   4.0
3  2000    UT 12,980      92.1   0.3   1.6   6.0
4  2005    UT 13,600      91.6   4.6   0.9   2.9
5  2006    UT 12,875      91.6    NA   1.7   6.7
6  2007    UT 15,562      89.1   1.6   1.5   7.8
7  2008    UT 14,713      89.4   2.7   2.1   5.8
8  2009    UT 13,599      90.1   1.2   2.2   6.6
9  2010    UT 17,544      91.6    NA   1.4   7.0
10 2011    UT 16,935      91.6   2.1   1.1   5.3
11 2012    UT 17,266      88.5   4.4   1.7   5.4
12 2013    UT 20,115      87.3   6.8   0.3   5.7
13 2014    UT 18,069      86.5   2.9   2.3   8.3
14 2015    UT 19,092      88.5   5.8   1.8   3.8
15 2016    UT 24,847      85.7   6.1   1.0   7.3
16 2017    UT 27,182      85.9   4.6   1.1   8.3
17 2018    UT 26,901      87.0   3.3   1.8   7.9

URL parameters (short)=
?minyear=1980&maxyear=2018&STATE=UT&geo=STATE&occ=Computer%20software%20developers%20(229)&group=BIRTHPLACE_TECH&sortn=4&mincount=1&totrows=50&color=blue2,green3,red2,orange1&geomtype=Line%20Graph
The following graph and table are for the entire United States. As can be seen, the percentage of software developers who were born in India has been increasing steadily since 1990, reaching about 17.7 percent in 2018. This is far above the 3.3 percent for Utah. Hence, it would seem wise to be skeptical of Mike Lee's support for S386, a bill involving issues in which his state would seem to currently have less at stake than the average state.
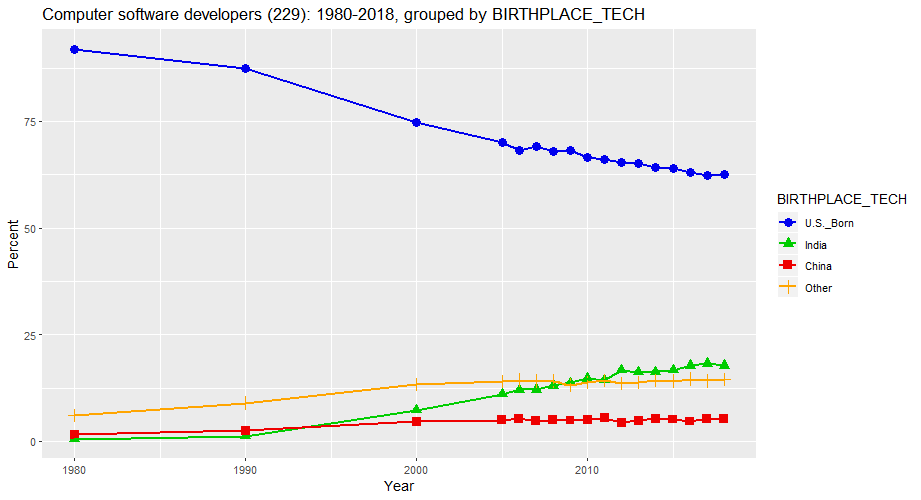 <
<Computer software developers (229): 1980-2018, grouped by BIRTHPLACE_TECH (percent) Year Count U.S._Born India China Other 1 1980 311,180 91.9 0.5 1.5 6.0 2 1990 644,172 87.4 1.2 2.4 9.0 3 2000 1,349,011 74.8 7.2 4.6 13.4 4 2005 1,279,997 70.0 11.1 4.9 14.0 5 2006 1,315,056 68.3 12.1 5.3 14.4 6 2007 1,290,484 69.0 12.1 4.7 14.1 7 2008 1,332,875 67.9 13.0 4.9 14.1 8 2009 1,325,989 68.3 13.7 4.9 13.2 9 2010 1,315,823 66.6 14.7 5.0 13.8 10 2011 1,343,537 66.0 14.3 5.4 14.3 11 2012 1,449,897 65.4 16.6 4.4 13.6 12 2013 1,480,496 65.2 16.2 4.8 13.8 13 2014 1,546,979 64.2 16.3 5.3 14.3 14 2015 1,630,473 64.1 16.7 5.1 14.1 15 2016 1,710,581 63.1 17.7 4.6 14.6 16 2017 1,803,306 62.4 18.2 5.3 14.2 17 2018 1,853,801 62.6 17.7 5.2 14.5 URL parameters (short)= ?minyear=1980&maxyear=2018&STATE=&geo=NATION&occ=Computer%20software%20developers%20(229)&group=BIRTHPLACE_TECH&sortn=4&mincount=1&totrows=50&color=blue2,green3,red2,orange1&geomtype=Line%20GraphTo see an analysis of the demographics of software developers in the United States by citizenship status instead of birthplace, see this link.