H-1B Data
OPT Data
The output in this article was generated by an expanded version of the R Shiny app at this link. This app uses Census data from IPUMS-USA (Integrated Public Use Microdata Series from the United States). The specific samples included are the 5% State sample for 1980 and 1990, the 5% Sample for 2000, and the ACS (American Community Survey) for the years 2001 through 2022. These surveys are all described at this link.
The following table shows the 50 U.S. counties with the lowest percentage of U.S. born software developers, sorted by that percentage. The individual foreign birthplaces listed are India and China because those are the birthplaces that have the largest percentage of software developers overall.
Computer software developers (229): 2022, grouped by BIRTHPLACE_TECH (percent)

   Year                     COUNTY   Count U.S._Born India China Other
1  2022        Middlesex County NJ  20,195      17.3  63.3   8.7  10.8
2  2022          Forsyth County GA   9,706      22.5  66.9   2.8   7.7
3  2022           Hudson County NJ  13,024      24.2  43.5  15.5  16.8
4  2022      Santa Clara County CA 119,586      24.6  37.0  19.9  18.5
5  2022        Fort Bend County TX   8,745      26.9  40.4  11.8  20.9
6  2022             Lake County IL   5,837      28.8  44.1   9.6  17.5
7  2022          Alameda County CA  52,841      28.9  45.4  13.8  11.9
8  2022           Monroe County PA   1,404      31.4   8.3   0.0  60.3
9  2022           Bergen County NJ   9,299      31.8  30.3   8.8  29.1
10 2022           Warren County OH   4,000      32.9  50.4   7.0   9.7
11 2022         Somerset County NJ   5,288      33.1  35.4  16.0  15.5
12 2022      San Joaquin County CA   6,182      33.4  59.6   0.7   6.3
13 2022          Passaic County NJ   3,051      33.5  32.2   0.0  34.3
14 2022        San Mateo County CA  21,398      34.6  16.8  28.3  20.3
15 2022         Marathon County WI   1,217      35.7  64.3   0.0   0.0
16 2022           Collin County TX  33,252      35.9  42.4   5.2  16.5
17 2022         Delaware County OH   4,905      37.2  55.9   1.2   5.6
18 2022          Broward County FL  11,318      37.2  26.4   1.4  34.9
19 2022            Union County NJ   2,866      37.5  20.9  11.4  30.1
20 2022     Contra Costa County CA  14,274      38.4  31.9   5.2  24.6
21 2022           Racine County WI   1,143      40.9  35.8   0.0  23.4
22 2022          Loudoun County VA  17,178      41.2  41.5   7.6   9.7
23 2022             King County WA 114,185      41.5  22.8  17.2  18.6
24 2022          Oakland County MI  15,821      41.7  33.6  10.8  14.0
25 2022           Queens County NY  16,022      43.0  11.4  19.6  25.9
26 2022       Williamson County TX  20,217      43.5  33.5   2.0  21.0
27 2022           Dallas County TX  27,738      44.0  41.3   1.5  13.1
28 2022         Tompkins County NY   1,004      44.9   6.9   9.0  39.2
29 2022          Henrico County VA   6,424      45.4  37.8   3.9  12.9
30 2022           Benton County AR   5,411      46.7  41.7   0.0  11.6
31 2022       Palm Beach County FL   5,989      47.4  11.3   2.1  39.3
32 2022       New Castle County DE   5,820      47.6  33.3   0.0  19.1
33 2022           McLean County IL   2,548      47.8  52.2   0.0   0.0
34 2022 East Baton Rouge Parish LA   2,160      48.1  37.9   0.0  14.0
35 2022          Norfolk County MA  11,620      48.3  17.6  10.9  23.2
36 2022   San Bernardino County CA   7,347      48.3  24.3   8.6  18.8
37 2022           Nassau County NY   7,476      48.6  19.0  15.2  17.2
38 2022          Johnson County IA   1,183      48.8  32.0   0.0  19.2
39 2022           Morris County NJ   5,738      50.7  30.4   3.4  15.5
40 2022           Orange County CA  31,311      51.0  17.2   6.7  25.1
41 2022        Snohomish County WA  17,443      51.2  23.4   8.1  17.3
42 2022        Baltimore County MD   5,342      52.4  23.4   3.8  20.4
43 2022            Bronx County NY   1,595      52.5   0.0   0.0  47.5
44 2022           Denton County TX  16,333      52.8  27.8   4.3  15.0
45 2022       Washington County OR  12,301      52.8  30.7   1.5  14.9
46 2022       Montgomery County MD  19,513      53.3  16.7  10.8  19.2
47 2022       Greenville County SC   2,813      53.5  27.5   0.0  19.1
48 2022     Hillsborough County FL  12,312      54.3  25.1   0.2  20.4
49 2022             Wake County NC  26,702      54.5  30.7   3.2  11.5
50 2022           Mercer County NJ   4,535      54.9  22.3   9.3  13.6

URL parameters (short)=
?minyear=2022&maxyear=2022&STATE=&geo=COUNTY&occ=Computer%20software%20developers%20(229)&group=BIRTHPLACE_TECH&sortn=4&sortdir=Ascending&mincount=1000&totrows=50&color=blue2,green3,red2,orange1&geomtype=Line%20Graph
The following table shows the 50 U.S. counties with the highest percentage of India born software developers, sorted by that percentage. The reason for sorting by India is that this is the foreign country with the highest percentages and hence with the highest likely risk of bias and/or nepotism in hiring.
Computer software developers (229): 2022, grouped by BIRTHPLACE_TECH (percent)

   Year                     COUNTY   Count U.S._Born India China Other
1  2022          Forsyth County GA   9,706      22.5  66.9   2.8   7.7
2  2022         Marathon County WI   1,217      35.7  64.3   0.0   0.0
3  2022        Middlesex County NJ  20,195      17.3  63.3   8.7  10.8
4  2022      San Joaquin County CA   6,182      33.4  59.6   0.7   6.3
5  2022         Delaware County OH   4,905      37.2  55.9   1.2   5.6
6  2022           McLean County IL   2,548      47.8  52.2   0.0   0.0
7  2022           Warren County OH   4,000      32.9  50.4   7.0   9.7
8  2022          Alameda County CA  52,841      28.9  45.4  13.8  11.9
9  2022             Lake County IL   5,837      28.8  44.1   9.6  17.5
10 2022           Hudson County NJ  13,024      24.2  43.5  15.5  16.8
11 2022           Collin County TX  33,252      35.9  42.4   5.2  16.5
12 2022           Benton County AR   5,411      46.7  41.7   0.0  11.6
13 2022          Loudoun County VA  17,178      41.2  41.5   7.6   9.7
14 2022           Dallas County TX  27,738      44.0  41.3   1.5  13.1
15 2022        Fort Bend County TX   8,745      26.9  40.4  11.8  20.9
16 2022 East Baton Rouge Parish LA   2,160      48.1  37.9   0.0  14.0
17 2022          Henrico County VA   6,424      45.4  37.8   3.9  12.9
18 2022      Santa Clara County CA 119,586      24.6  37.0  19.9  18.5
19 2022             Linn County IA   2,117      64.1  35.9   0.0   0.0
20 2022           Racine County WI   1,143      40.9  35.8   0.0  23.4
21 2022           Kenton County KY   1,374      64.4  35.6   0.0   0.0
22 2022         Somerset County NJ   5,288      33.1  35.4  16.0  15.5
23 2022          Oakland County MI  15,821      41.7  33.6  10.8  14.0
24 2022       Williamson County TX  20,217      43.5  33.5   2.0  21.0
25 2022       New Castle County DE   5,820      47.6  33.3   0.0  19.1
26 2022          Passaic County NJ   3,051      33.5  32.2   0.0  34.3
27 2022          Johnson County IA   1,183      48.8  32.0   0.0  19.2
28 2022          Johnson County KS   8,332      61.2  32.0   0.6   6.3
29 2022     Contra Costa County CA  14,274      38.4  31.9   5.2  24.6
30 2022             Wake County NC  26,702      54.5  30.7   3.2  11.5
31 2022       Washington County OR  12,301      52.8  30.7   1.5  14.9
32 2022           Morris County NJ   5,738      50.7  30.4   3.4  15.5
33 2022        Hunterdon County NJ   1,502      55.8  30.3   0.0  13.9
34 2022           Bergen County NJ   9,299      31.8  30.3   8.8  29.1
35 2022          Chester County PA   9,896      56.8  28.3   3.4  11.5
36 2022          Alachua County FL   2,218      68.2  28.0   0.0   3.8
37 2022           Denton County TX  16,333      52.8  27.8   4.3  15.0
38 2022       Greenville County SC   2,813      53.5  27.5   0.0  19.1
39 2022          Broward County FL  11,318      37.2  26.4   1.4  34.9
40 2022        Frederick County MD   3,406      56.2  25.8   1.6  16.4
41 2022     Hillsborough County FL  12,312      54.3  25.1   0.2  20.4
42 2022        St. Louis County MO  12,446      64.8  25.0   5.2   5.0
43 2022      Mecklenburg County NC  13,253      58.5  24.8   0.5  16.2
44 2022   San Bernardino County CA   7,347      48.3  24.3   8.6  18.8
45 2022        Baltimore County MD   5,342      52.4  23.4   3.8  20.4
46 2022        Snohomish County WA  17,443      51.2  23.4   8.1  17.3
47 2022       Burlington County NJ   3,394      75.1  23.0   0.0   1.9
48 2022             King County WA 114,185      41.5  22.8  17.2  18.6
49 2022        El Dorado County CA   1,587      64.5  22.6   7.2   5.7
50 2022           Mercer County NJ   4,535      54.9  22.3   9.3  13.6

URL parameters (short)=
?minyear=2022&maxyear=2022&STATE=&geo=COUNTY&occ=Computer%20software%20developers%20(229)&group=BIRTHPLACE_TECH&sortn=5&mincount=1000&totrows=50&color=blue2,green3,red2,orange1&geomtype=Line%20Graph
As shown in the tables above, Forsyth County, Georgia, a suburban community just north of Atlanta, had the second lowest percentage of U.S. born software developers (22.5%) and highest percentage of India-born software developers (66.9%) of any U.S. county with over 1,000 software developers in 2022. The following graph and table show very rapid growth in the Indian-born population in the last few years and this is mentioned in an article titled Forsyth County has fastest-growing Asian population in U.S.. Another article states the following:
"The majority of them are in IT," Sharma said. "They're coming on [H-1B visas, which allows companies to hire foreign workers for specialty positions] or [L-1 visas for managerial, executive or specialized knowledge], then applying for their green cards and then settling here."
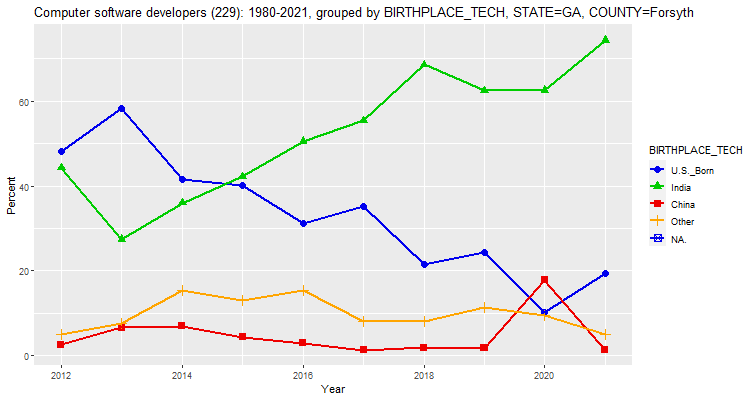
Computer software developers (229): 1980-2021, grouped by BIRTHPLACE_TECH, STATE=GA, COUNTY=Forsyth (percent)

   Year            COUNTY Count U.S._Born India China Other NA.
1  2012 Forsyth County GA 2,007      48.2  44.2   2.6   4.9  NA
2  2013 Forsyth County GA 3,360      58.2  27.5   6.6   7.7  NA
3  2014 Forsyth County GA 3,020      41.5  36.0   7.0  15.5  NA
4  2015 Forsyth County GA 3,737      40.2  42.2   4.4  13.1  NA
5  2016 Forsyth County GA 4,275      31.1  50.5   3.0  15.4  NA
6  2017 Forsyth County GA 4,449      35.1  55.4   1.3   8.2  NA
7  2018 Forsyth County GA 5,898      21.4  68.6   1.9   8.1  NA
8  2019 Forsyth County GA 6,827      24.4  62.5   1.8  11.4  NA
9  2020 Forsyth County GA 8,646      10.1  62.5  17.8   9.5  NA
10 2021 Forsyth County GA 7,762      19.3  74.3   1.3   5.1  NA
11 2022 Forsyth County GA 9,706      22.5  66.9   2.8   7.7  NA

URL parameters (short)=
?minyear=1980&maxyear=2021&STATE=GA&COUNTY=Forsyth&geo=COUNTY&occ=Computer%20software%20developers%20(229)&group=BIRTHPLACE_TECH&sortn=4&mincount=1&totrows=50&color=blue2,green3,red2,orange1&geomtype=Line%20Graph
The next 5 U.S. counties with the lowest percentage of U.S. born software developers in 2021 are Mercer, Somerset, Hudson, Middlesex, and Bergen counties, all in New Jersey. The following graph and table are for Somerset County. Somerset County borders Middlesex County which itself borders New York City. As can be seen, over half (52%) of the software developers there in 2021 were born in India.
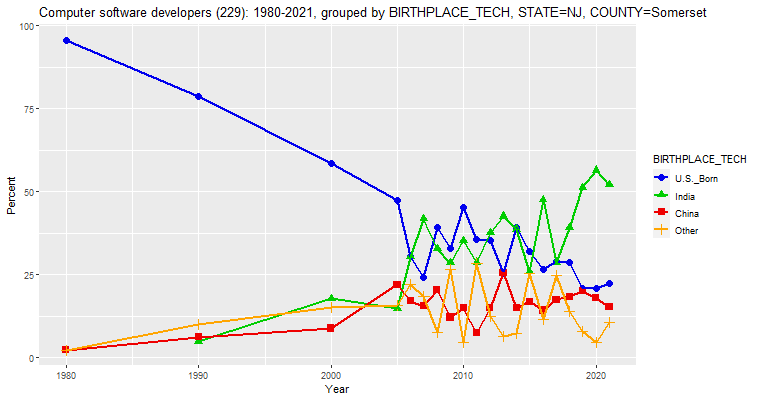
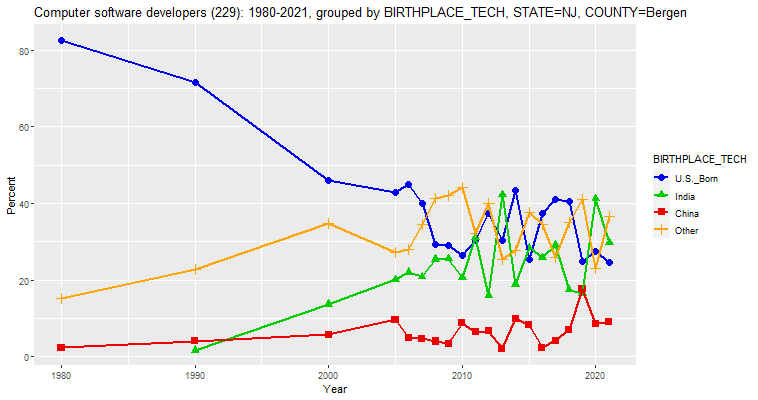
Computer software developers (229): 1980-2021, grouped by BIRTHPLACE_TECH, STATE=NJ, COUNTY=Somerset (percent)

   Year             COUNTY Count U.S._Born India China Other
1  1980 Somerset County NJ   900      95.6    NA   2.2   2.2
2  1990 Somerset County NJ 2,630      78.7   4.9   6.2  10.1
3  2000 Somerset County NJ 4,903      58.4  17.7   8.8  15.0
4  2005 Somerset County NJ 3,920      47.4  14.8  21.9  15.9
5  2006 Somerset County NJ 4,680      30.5  30.3  17.1  22.2
6  2007 Somerset County NJ 5,196      24.1  41.8  15.6  18.6
7  2008 Somerset County NJ 4,707      39.4  32.7  20.3   7.6
8  2009 Somerset County NJ 4,841      32.9  28.5  12.1  26.5
9  2010 Somerset County NJ 5,047      45.2  35.2  14.9   4.7
10 2011 Somerset County NJ 4,068      35.5  28.8   7.4  28.3
11 2012 Somerset County NJ 5,173      35.2  37.5  14.9  12.3
12 2013 Somerset County NJ 4,448      25.4  42.5  25.6   6.5
13 2014 Somerset County NJ 4,948      39.2  38.7  14.9   7.3
14 2015 Somerset County NJ 3,955      31.9  25.8  16.9  25.4
15 2016 Somerset County NJ 5,316      26.6  47.6  14.2  11.6
16 2017 Somerset County NJ 3,903      29.0  28.7  17.5  24.8
17 2018 Somerset County NJ 6,526      28.6  39.0  18.4  14.0
18 2019 Somerset County NJ 5,656      20.9  51.1  20.1   7.9
19 2020 Somerset County NJ 5,029      21.0  56.4  17.9   4.7
20 2021 Somerset County NJ 5,926      22.3  52.0  15.2  10.5

URL parameters (short)=
?minyear=1980&maxyear=2021&STATE=NJ&COUNTY=Somerset&geo=COUNTY&occ=Computer%20software%20developers%20(229)&group=BIRTHPLACE_TECH&sortn=4&mincount=1&totrows=50&color=blue2,green3,red2,orange1&geomtype=Line%20Graph
The following 3 graphs and tables show the change in demographics of software developers in Hudson, Middlesex, and Bergen counties in New Jersey from 1980 to 2021. As can be seen, the percentage of their software developers in 2021 who were born in India were 36.5, 60.5, and 29.8, respectively. These three counties border New York City. Hence, many of these jobs may be connected with the financial industry.
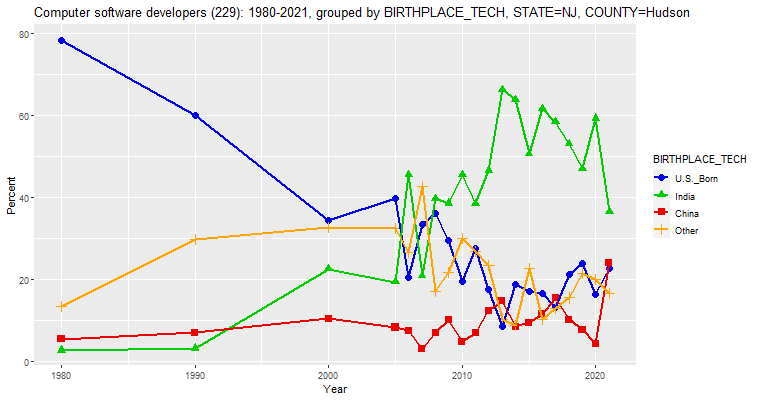
Computer software developers (229): 1980-2021, grouped by BIRTHPLACE_TECH, STATE=NJ, COUNTY=Hudson (percent)

   Year           COUNTY  Count U.S._Born India China Other
1  1980 Hudson County NJ    740      78.4   2.7   5.4  13.5
2  1990 Hudson County NJ  1,992      59.9   3.2   7.0  29.9
3  2000 Hudson County NJ  4,507      34.5  22.5  10.4  32.6
4  2005 Hudson County NJ  4,738      39.8  19.4   8.3  32.5
5  2006 Hudson County NJ  5,239      20.4  45.5   7.5  26.6
6  2007 Hudson County NJ  5,482      33.3  20.9   3.0  42.8
7  2008 Hudson County NJ  6,118      36.2  39.7   7.0  17.0
8  2009 Hudson County NJ  4,847      29.6  38.6  10.1  21.7
9  2010 Hudson County NJ  5,793      19.6  45.5   4.8  30.1
10 2011 Hudson County NJ  7,817      27.7  38.5   6.9  26.9
11 2012 Hudson County NJ  8,703      17.6  46.6  12.4  23.4
12 2013 Hudson County NJ  7,022       8.6  66.4  14.7  10.4
13 2014 Hudson County NJ  7,728      18.8  63.9   8.4   8.9
14 2015 Hudson County NJ  9,209      17.2  50.7   9.5  22.6
15 2016 Hudson County NJ 10,092      16.6  61.7  11.5  10.3
16 2017 Hudson County NJ  8,836      13.1  58.4  15.5  13.0
17 2018 Hudson County NJ 13,746      21.2  53.1  10.2  15.5
18 2019 Hudson County NJ 13,171      23.8  47.0   7.8  21.4
19 2020 Hudson County NJ 14,332      16.4  59.3   4.3  19.9
20 2021 Hudson County NJ 13,585      22.7  36.5  24.1  16.7

URL parameters (short)=
?minyear=1980&maxyear=2021&STATE=NJ&COUNTY=Hudson&geo=COUNTY&occ=Computer%20software%20developers%20(229)&group=BIRTHPLACE_TECH&sortn=4&mincount=1&totrows=50&color=blue2,green3,red2,orange1&geomtype=Line%20Graph
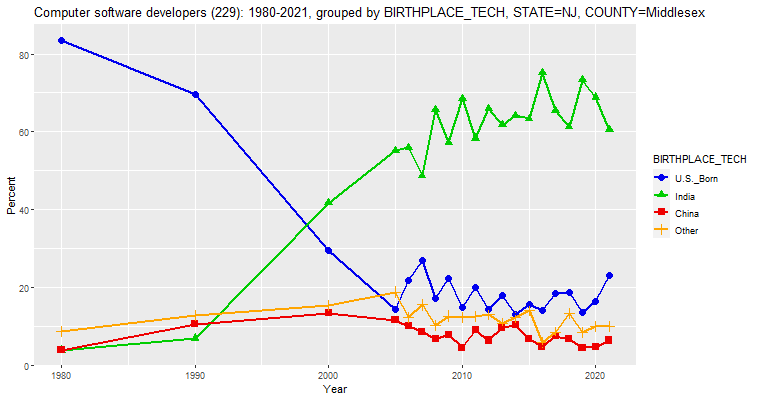
Computer software developers (229): 1980-2021, grouped by BIRTHPLACE_TECH, STATE=NJ, COUNTY=Middlesex (percent)

   Year              COUNTY  Count U.S._Born India China Other
1  1980 Middlesex County NJ  2,060      83.5   3.9   3.9   8.7
2  1990 Middlesex County NJ  5,449      69.6   7.0  10.6  12.8
3  2000 Middlesex County NJ 14,303      29.4  41.7  13.4  15.5
4  2005 Middlesex County NJ 13,286      14.4  55.1  11.6  18.9
5  2006 Middlesex County NJ 11,687      21.8  55.9  10.0  12.2
6  2007 Middlesex County NJ 14,980      27.0  48.8   8.6  15.5
7  2008 Middlesex County NJ 16,213      17.3  65.7   6.7  10.4
8  2009 Middlesex County NJ 13,138      22.2  57.2   7.8  12.7
9  2010 Middlesex County NJ 14,448      14.8  68.5   4.5  12.2
10 2011 Middlesex County NJ 14,470      20.0  58.3   9.0  12.7
11 2012 Middlesex County NJ 14,885      14.5  65.9   6.4  13.2
12 2013 Middlesex County NJ 12,948      17.9  61.7   9.7  10.7
13 2014 Middlesex County NJ 14,795      13.2  64.1  10.4  12.4
14 2015 Middlesex County NJ 13,812      15.7  63.4   6.7  14.1
15 2016 Middlesex County NJ 13,830      14.0  75.1   4.8   6.0
16 2017 Middlesex County NJ 15,402      18.5  65.4   7.5   8.5
17 2018 Middlesex County NJ 18,228      18.7  61.3   6.7  13.3
18 2019 Middlesex County NJ 15,499      13.6  73.3   4.6   8.6
19 2020 Middlesex County NJ 19,249      16.3  68.9   4.7  10.1
20 2021 Middlesex County NJ 23,379      23.2  60.5   6.4   9.9

URL parameters (short)=
?minyear=1980&maxyear=2021&STATE=NJ&COUNTY=Middlesex&geo=COUNTY&occ=Computer%20software%20developers%20(229)&group=BIRTHPLACE_TECH&sortn=4&mincount=1&totrows=50&color=blue2,green3,red2,orange1&geomtype=Line%20Graph
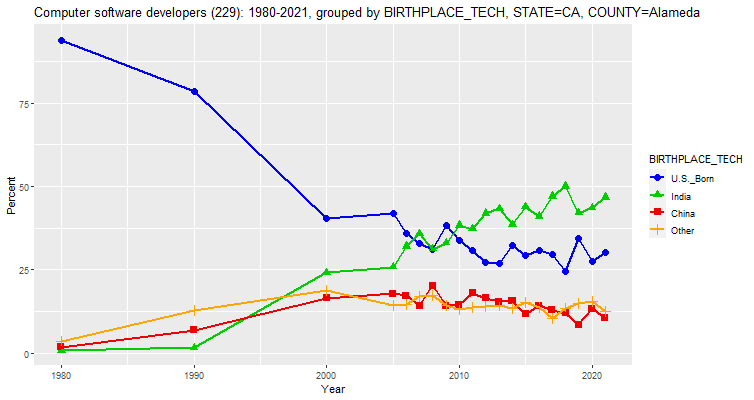
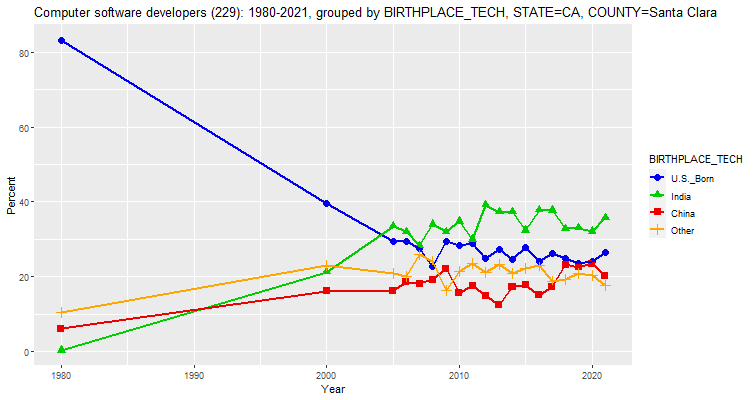
Computer software developers (229): 1980-2021, grouped by BIRTHPLACE_TECH, STATE=NJ, COUNTY=Bergen (percent)

   Year           COUNTY Count U.S._Born India China Other
1  1980 Bergen County NJ 1,720      82.6    NA   2.3  15.1
2  1990 Bergen County NJ 4,103      71.5   1.7   4.1  22.8
3  2000 Bergen County NJ 7,449      45.9  13.7   5.7  34.7
4  2005 Bergen County NJ 7,581      42.9  20.1   9.7  27.3
5  2006 Bergen County NJ 6,956      45.0  22.0   5.0  28.0
6  2007 Bergen County NJ 6,333      39.9  20.9   4.6  34.6
7  2008 Bergen County NJ 8,038      29.4  25.4   4.0  41.2
8  2009 Bergen County NJ 5,900      28.9  25.5   3.4  42.2
9  2010 Bergen County NJ 5,918      26.5  20.7   8.8  44.1
10 2011 Bergen County NJ 5,917      30.4  31.0   6.4  32.2
11 2012 Bergen County NJ 4,666      37.3  16.0   6.6  40.1
12 2013 Bergen County NJ 9,472      30.3  42.3   2.1  25.3
13 2014 Bergen County NJ 6,923      43.5  18.9  10.0  27.7
14 2015 Bergen County NJ 8,399      25.5  28.5   8.3  37.8
15 2016 Bergen County NJ 6,816      37.4  25.9   2.3  34.5
16 2017 Bergen County NJ 5,208      41.0  29.1   4.1  25.8
17 2018 Bergen County NJ 7,455      40.5  17.4   7.1  35.1
18 2019 Bergen County NJ 8,746      24.8  16.4  17.6  41.1
19 2020 Bergen County NJ 6,977      27.4  41.1   8.6  22.9
20 2021 Bergen County NJ 9,319      24.6  29.8   9.0  36.6

URL parameters (short)=
?minyear=1980&maxyear=2021&STATE=NJ&COUNTY=Bergen&geo=COUNTY&occ=Computer%20software%20developers%20(229)&group=BIRTHPLACE_TECH&sortn=4&mincount=1&totrows=50&color=blue2,green3,red2,orange1&geomtype=Line%20Graph
The following two graphs and tables show the change in demographics of software developers in Alameda and Santa Clara counties in California from 1980 to 2021. As can be seen, the percentage of their software developers in 2021 who were born in India were 46.8 and 35.8, respectively. These counties are in the area known as "Silicon Valley". Regarding the boundaries of this area, Wikipedia says the following:
The geographical boundaries of Silicon Valley have changed over the years, traditionally Silicon Valley is known as Santa Clara County, southern San Mateo County and southern Alameda county. However, over the years this geographical area has been expanded to include San Francisco County, Contra Costa County, and the northern parts of Alameda County and San Mateo County, this shift has occurred due to the expansion in the local economy and the development of new technologies.
One item of note in the two graphs above and the two graphs below (and many of those following) is that the percentages of software developers born in India tend to have been close to zero until 1990 at which point they began to grow. This is likely due to the H-1B visa which was created by the Immigration Act of 1990. This connection to the H-1B visa seems to have been generally less for software developers born in China and other countries.
 <
<Computer software developers (229): 1980-2021, grouped by BIRTHPLACE_TECH, STATE=CA, COUNTY=Alameda (percent) Year COUNTY Count U.S._Born India China Other 1 1980 Alameda County CA 2,260 93.8 0.9 1.8 3.5 2 1990 Alameda County CA 6,794 78.5 1.7 6.9 12.8 3 2000 Alameda County CA 20,473 40.5 24.1 16.6 18.9 4 2005 Alameda County CA 18,805 42.0 25.9 17.8 14.3 5 2006 Alameda County CA 19,851 36.0 32.1 17.3 14.6 6 2007 Alameda County CA 24,022 33.0 35.8 14.2 17.0 7 2008 Alameda County CA 17,616 31.1 31.2 20.3 17.4 8 2009 Alameda County CA 21,447 38.3 33.1 14.3 14.4 9 2010 Alameda County CA 20,199 34.0 38.3 14.6 13.1 10 2011 Alameda County CA 20,975 30.8 37.3 18.1 13.8 11 2012 Alameda County CA 24,480 27.4 41.9 16.6 14.2 12 2013 Alameda County CA 25,526 27.0 43.4 15.4 14.3 13 2014 Alameda County CA 29,970 32.4 38.6 15.6 13.4 14 2015 Alameda County CA 38,938 29.2 43.8 11.8 15.2 15 2016 Alameda County CA 44,341 30.9 41.1 14.3 13.7 16 2017 Alameda County CA 39,393 29.6 47.0 12.9 10.4 17 2018 Alameda County CA 48,897 24.6 50.0 12.0 13.3 18 2019 Alameda County CA 52,530 34.5 42.0 8.6 14.9 19 2020 Alameda County CA 48,235 27.4 43.6 13.4 15.6 20 2021 Alameda County CA 54,867 30.3 46.8 10.5 12.4 URL parameters (short)= ?minyear=1980&maxyear=2021&COUNTY=Alameda&geo=COUNTY&occ=Computer%20software%20developers%20(229)&group=BIRTHPLACE_TECH&sortn=4&mincount=1&totrows=50&color=blue2,green3,red2,orange1&geomtype=Line%20Graph
Computer software developers (229): 1980-2021, grouped by BIRTHPLACE_TECH, STATE=CA, COUNTY=Santa Clara (percent)

   Year                COUNTY   Count U.S._Born India China Other
1  1980 Santa Clara County CA   6,900      83.2   0.3   6.1  10.4
2  1990 Santa Clara County CA  12,993      71.8   2.4  10.1  15.7
3  2000 Santa Clara County CA  47,667      39.6  21.2  16.1  23.1
4  2005 Santa Clara County CA  39,754      29.3  33.6  16.3  20.9
5  2006 Santa Clara County CA  52,282      29.5  32.0  18.5  20.0
6  2007 Santa Clara County CA  47,764      27.6  28.3  18.1  26.0
7  2008 Santa Clara County CA  52,573      22.6  34.0  19.2  24.2
8  2009 Santa Clara County CA  48,555      29.5  32.0  22.1  16.4
9  2010 Santa Clara County CA  52,260      28.3  34.8  15.6  21.3
10 2011 Santa Clara County CA  54,744      28.8  30.0  17.6  23.6
11 2012 Santa Clara County CA  58,637      24.9  39.1  14.9  21.1
12 2013 Santa Clara County CA  63,361      27.2  37.3  12.4  23.1
13 2014 Santa Clara County CA  74,352      24.5  37.3  17.3  20.9
14 2015 Santa Clara County CA  78,269      27.8  32.4  17.8  22.1
15 2016 Santa Clara County CA  85,011      24.2  37.8  15.1  22.9
16 2017 Santa Clara County CA  90,412      26.2  37.8  17.3  18.8
17 2018 Santa Clara County CA  88,430      24.9  32.8  23.2  19.1
18 2019 Santa Clara County CA 104,152      23.5  33.0  22.6  21.0
19 2020 Santa Clara County CA 113,295      24.0  32.1  23.5  20.4
20 2021 Santa Clara County CA  95,365      26.5  35.8  20.2  17.5

URL parameters (short)=
?minyear=1980&maxyear=2021&COUNTY=Santa%20Clara&geo=COUNTY&occ=Computer%20software%20developers%20(229)&group=BIRTHPLACE_TECH&sortn=4&mincount=1&totrows=50&color=blue2,green3,red2,orange1&geomtype=Line%20Graph
The following two graphs and tables are for Dallas and Collin counties, Texas. Dallas County contains the city of Dallas and Collin County is just north of it. As can be seen, 41.3 and 42.4 percent of the software developers in 2022 in Dallas and Collin counties, respectively, were born in India.
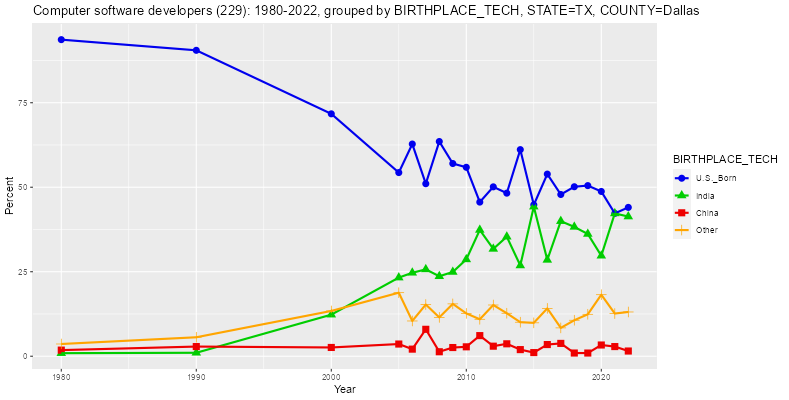
Computer software developers (229): 1980-2022, grouped by BIRTHPLACE_TECH, STATE=TX, COUNTY=Dallas (percent)

   Year           COUNTY  Count U.S._Born India China Other
1  1980 Dallas County TX  4,420      93.7   0.9   1.8   3.6
2  1990 Dallas County TX  8,219      90.5   1.0   2.9   5.6
3  2000 Dallas County TX 15,500      71.7  12.3   2.6  13.4
4  2005 Dallas County TX 10,597      54.3  23.3   3.6  18.8
5  2006 Dallas County TX 11,483      62.8  24.7   2.1  10.4
6  2007 Dallas County TX  9,740      51.0  25.7   8.0  15.3
7  2008 Dallas County TX 12,135      63.5  23.7   1.3  11.5
8  2009 Dallas County TX 10,692      57.0  24.9   2.6  15.5
9  2010 Dallas County TX 10,993      55.9  28.6   2.8  12.7
10 2011 Dallas County TX 13,313      45.6  37.4   6.1  10.9
11 2012 Dallas County TX 15,642      50.1  31.8   3.0  15.2
12 2013 Dallas County TX 16,077      48.2  35.4   3.7  12.7
13 2014 Dallas County TX 14,853      61.1  26.8   2.0  10.1
14 2015 Dallas County TX 13,934      44.8  44.3   1.1   9.9
15 2016 Dallas County TX 17,763      53.9  28.5   3.5  14.2
16 2017 Dallas County TX 16,730      47.9  40.0   3.8   8.4
17 2018 Dallas County TX 17,573      50.1  38.3   0.9  10.6
18 2019 Dallas County TX 19,305      50.5  36.2   0.9  12.4
19 2020 Dallas County TX 23,308      48.7  29.7   3.3  18.2
20 2021 Dallas County TX 21,395      42.3  42.3   2.9  12.6
21 2022 Dallas County TX 27,738      44.0  41.3   1.5  13.1

URL parameters (short)=
?minyear=1980&maxyear=2022&STATE=TX&COUNTY=Dallas&geo=COUNTY&occ=Computer%20software%20developers%20(229)&group=BIRTHPLACE_TECH&sortn=5&mincount=1&totrows=50&color=blue2,green3,red2,orange1&geomtype=Line%20Graph
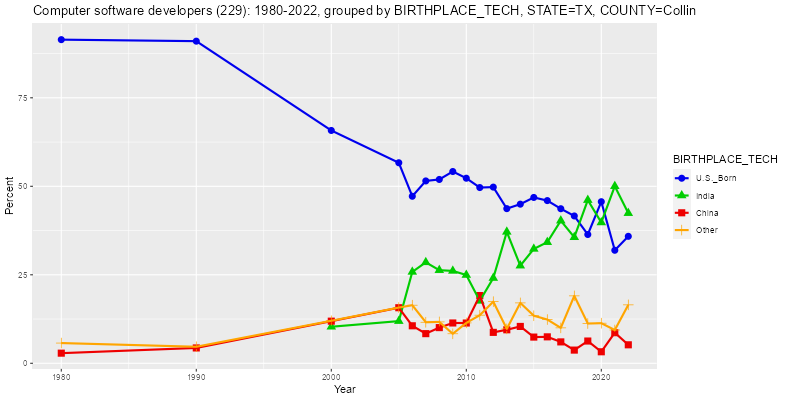
Computer software developers (229): 1980-2022, grouped by BIRTHPLACE_TECH, STATE=TX, COUNTY=Collin (percent)

   Year           COUNTY  Count U.S._Born India China Other
1  1980 Collin County TX    700      91.4    NA   2.9   5.7
2  1990 Collin County TX  3,000      91.0    NA   4.3   4.7
3  2000 Collin County TX 12,925      65.8  10.3  11.9  12.0
4  2005 Collin County TX 14,681      56.7  11.9  15.7  15.7
5  2006 Collin County TX 14,303      47.2  25.8  10.6  16.4
6  2007 Collin County TX 13,986      51.5  28.5   8.4  11.6
7  2008 Collin County TX 15,528      51.9  26.3  10.1  11.7
8  2009 Collin County TX 12,437      54.2  26.1  11.4   8.3
9  2010 Collin County TX 13,108      52.3  24.9  11.4  11.4
10 2011 Collin County TX 13,554      49.6  17.6  19.1  13.6
11 2012 Collin County TX 14,937      49.8  24.1   8.7  17.4
12 2013 Collin County TX 12,099      43.7  37.1   9.5   9.7
13 2014 Collin County TX 18,317      45.0  27.6  10.4  17.1
14 2015 Collin County TX 19,712      46.8  32.3   7.4  13.4
15 2016 Collin County TX 17,323      46.0  34.2   7.5  12.4
16 2017 Collin County TX 19,963      43.7  40.3   6.0  10.0
17 2018 Collin County TX 18,895      41.6  35.6   3.7  19.0
18 2019 Collin County TX 23,945      36.4  46.1   6.3  11.2
19 2020 Collin County TX 24,489      45.6  39.8   3.3  11.3
20 2021 Collin County TX 28,062      31.9  50.0   8.6   9.4
21 2022 Collin County TX 33,252      35.9  42.4   5.2  16.5

URL parameters (short)=
?minyear=1980&maxyear=2022&STATE=TX&COUNTY=Collin&geo=COUNTY&occ=Computer%20software%20developers%20(229)&group=BIRTHPLACE_TECH&sortn=5&mincount=1&totrows=50&color=blue2,green3,red2,orange1&geomtype=Line%20Graph
The following graph and table are for Fort Bend County, Texas. Fort Bend County is just southwest of the city of Houston. As can be seen, 40.4 of its software developers in 2022 were born in India.
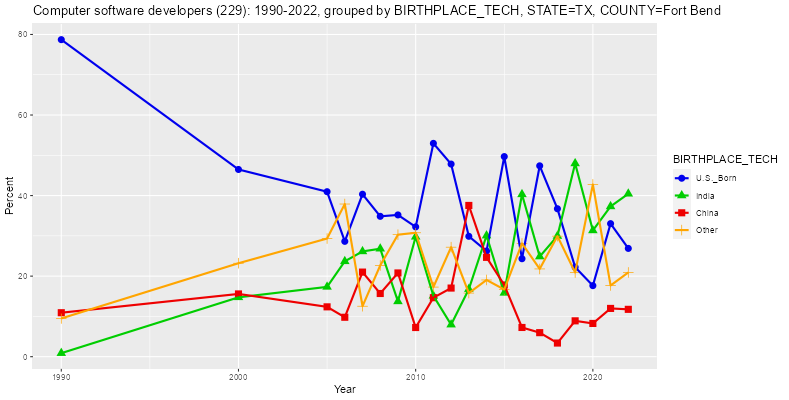
Computer software developers (229): 1990-2022, grouped by BIRTHPLACE_TECH, STATE=TX, COUNTY=Fort Bend (percent)

   Year              COUNTY  Count U.S._Born India China Other
1  1990 Fort Bend County TX    916      78.7   0.9  10.9   9.5
2  2000 Fort Bend County TX  2,728      46.5  14.7  15.6  23.2
3  2005 Fort Bend County TX  2,683      41.0  17.3  12.4  29.3
4  2006 Fort Bend County TX  3,831      28.6  23.7   9.8  37.9
5  2007 Fort Bend County TX  3,352      40.3  26.1  21.0  12.5
6  2008 Fort Bend County TX  3,085      34.8  26.8  15.7  22.7
7  2009 Fort Bend County TX  3,526      35.2  13.7  20.8  30.3
8  2010 Fort Bend County TX  3,218      32.2  29.8   7.2  30.8
9  2011 Fort Bend County TX  3,680      53.0  15.1  14.6  17.3
10 2012 Fort Bend County TX  2,917      47.8   8.0  17.0  27.2
11 2013 Fort Bend County TX  5,350      29.9  16.8  37.6  15.8
12 2014 Fort Bend County TX  4,152      26.2  30.1  24.7  19.1
13 2015 Fort Bend County TX  5,157      49.7  15.8  17.8  16.7
14 2016 Fort Bend County TX  6,122      24.3  40.3   7.3  28.1
15 2017 Fort Bend County TX  5,700      47.4  24.9   6.0  21.8
16 2018 Fort Bend County TX  3,425      36.7  30.0   3.4  29.9
17 2019 Fort Bend County TX  5,876      22.2  48.0   8.9  20.9
18 2020 Fort Bend County TX 10,892      17.6  31.3   8.3  42.8
19 2021 Fort Bend County TX  9,763      33.0  37.3  12.0  17.7
20 2022 Fort Bend County TX  8,745      26.9  40.4  11.8  20.9

URL parameters (short)=
?minyear=1990&maxyear=2022&STATE=TX&COUNTY=Fort%20Bend&geo=COUNTY&occ=Computer%20software%20developers%20(229)&group=BIRTHPLACE_TECH&sortn=5&mincount=1&totrows=50&color=blue2,green3,red2,orange1&geomtype=Line%20Graph
The following graph and table are for Williamson County, Texas. Williamson County is just north of the city of Austin. As can be seen, 33.5 of its software developers in 2022 were born in India.
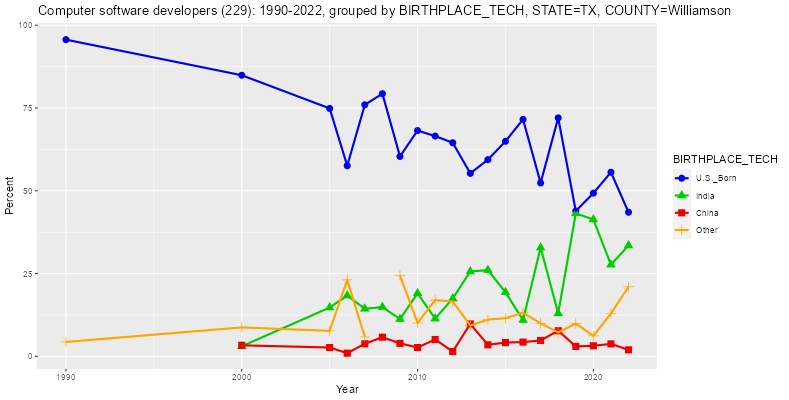
Computer software developers (229): 1990-2022, grouped by BIRTHPLACE_TECH, STATE=TX, COUNTY=Williamson (percent)

   Year               COUNTY  Count U.S._Born India China Other
1  1990 Williamson County TX  1,354      95.6    NA    NA   4.4
2  2000 Williamson County TX  4,052      84.9   3.0   3.3   8.7
3  2005 Williamson County TX  5,574      74.9  14.7   2.7   7.7
4  2006 Williamson County TX  5,596      57.6  18.4   1.0  23.1
5  2007 Williamson County TX  4,461      76.0  14.4   3.8   5.9
6  2008 Williamson County TX  4,977      79.3  14.9   5.8    NA
7  2009 Williamson County TX  5,398      60.4  11.3   3.9  24.4
8  2010 Williamson County TX  7,246      68.2  19.0   2.7  10.1
9  2011 Williamson County TX  5,493      66.5  11.4   5.1  17.0
10 2012 Williamson County TX  6,692      64.5  17.5   1.5  16.6
11 2013 Williamson County TX  7,379      55.3  25.6   9.8   9.3
12 2014 Williamson County TX  6,664      59.4  26.0   3.5  11.1
13 2015 Williamson County TX  9,212      64.9  19.4   4.2  11.5
14 2016 Williamson County TX  8,397      71.6  11.0   4.3  13.2
15 2017 Williamson County TX  9,423      52.4  32.9   4.8  10.0
16 2018 Williamson County TX  9,860      72.0  13.0   7.7   7.2
17 2019 Williamson County TX 13,848      43.9  43.2   3.0   9.9
18 2020 Williamson County TX 12,738      49.3  41.3   3.2   6.2
19 2021 Williamson County TX 17,270      55.6  27.7   3.8  12.9
20 2022 Williamson County TX 20,217      43.5  33.5   2.0  21.0

URL parameters (short)=
?minyear=1990&maxyear=2022&STATE=TX&COUNTY=Williamson&geo=COUNTY&occ=Computer%20software%20developers%20(229)&group=BIRTHPLACE_TECH&sortn=5&mincount=1&totrows=50&color=blue2,green3,red2,orange1&geomtype=Line%20Graph
The following table shows the 50 U.S. states and DC, sorted by the percentage of U.S. born software developers. The individual foreign birthplaces listed are India and China because those are the birthplaces that have the largest percentage of software developers overall.
2021  Total count = 2,284,606

AMERICAN COMMUNITIES SURVEY: 2021

Computer software developers (229): 2021, grouped by BIRTHPLACE_TECH (percent)

   Year STATE   Count U.S._Born India China Other
1  2021    NJ  96,497      39.3  35.6   9.5  15.6
2  2021    CA 402,995      46.6  23.0  10.7  19.8
3  2021    WA 140,318      49.0  21.9  12.0  17.1
4  2021    TX 195,749      56.0  25.3   3.8  14.9
5  2021    GA  60,800      60.7  24.7   2.7  11.9
6  2021    MA  84,459      61.6  13.7   7.4  17.4
7  2021    IL  84,731      62.2  16.3   4.7  16.8
8  2021    CT  23,395      63.3  21.7   2.8  12.1
9  2021    VA  94,741      64.2  17.7   3.4  14.7
10 2021    DE   4,856      66.0  23.8   4.9   5.3
11 2021    NY 116,585      66.1   7.6   5.9  20.4
12 2021    NC  62,919      66.3  21.2   2.4  10.1
13 2021    FL  98,152      66.5   9.9   1.0  22.7
14 2021    HI   2,926      66.5   0.0   1.9  31.6
15 2021    AZ  49,374      70.9  16.5   1.8  10.8
16 2021    MD  69,062      71.5  10.8   3.6  14.0
17 2021    NV   9,265      73.0  11.2   6.1   9.7
18 2021    PA  76,582      73.2  15.7   2.2   9.0
19 2021    AR  11,399      73.6  22.2   0.0   4.2
20 2021    MI  50,282      74.1  16.4   2.4   7.1
21 2021    SD   4,639      74.8  17.3   1.3   6.6
22 2021    ND   2,088      75.1   0.0   0.0  24.9
23 2021    OH  59,399      77.8  12.1   1.3   8.8
24 2021    KS  21,914      78.4  16.0   1.5   4.1
25 2021    MN  44,463      78.6   7.0   1.5  12.9
26 2021    MO  33,508      79.2  11.8   1.4   7.5
27 2021    IN  27,359      79.5  10.9   0.7   8.8
28 2021    TN  26,491      79.7  15.2   0.8   4.4
29 2021    OR  29,722      80.5   4.8   1.6  13.1
30 2021    RI   7,407      80.9   8.3   3.6   7.2
31 2021    CO  70,416      81.0   5.4   0.5  13.1
32 2021    NE  11,869      81.5  10.7   0.0   7.8
33 2021    LA  10,300      82.5   6.9   0.3  10.4
34 2021    NM   6,348      83.0   0.0   1.0  16.0
35 2021    KY  12,514      83.6  11.6   0.0   4.8
36 2021    NH  14,502      83.8   5.1   1.0  10.1
37 2021    DC   5,967      83.8   3.7   1.9  10.6
38 2021    UT  31,985      84.0   4.6   1.3  10.1
39 2021    SC  16,110      84.4   6.9   0.7   8.0
40 2021    WY     667      86.1  13.9   0.0   0.0
41 2021    WI  35,084      86.2   6.5   2.8   4.6
42 2021    OK  13,153      86.2   5.6   0.7   7.6
43 2021    ID   7,602      86.2   4.8   0.0   9.0
44 2021    IA  15,290      86.8   5.3   0.0   7.8
45 2021    AL  21,517      88.4   3.4   1.7   6.5
46 2021    ME   5,125      92.6   0.0   0.0   7.4
47 2021    VT   2,604      93.4   0.0   0.0   6.6
48 2021    MS   4,137      93.7   0.7   0.0   5.6
49 2021    MT   2,727      96.2   0.0   0.0   3.8
50 2021    WV   3,446      96.5   1.7   0.0   1.7
51 2021    AK   1,166     100.0   0.0   0.0   0.0

URL parameters (short)=
?minyear=2021&maxyear=2021&STATE=&geo=STATE&occ=Computer%20software%20developers%20(229)&group=BIRTHPLACE_TECH&sortn=4&sortdir=Ascending&mincount=1&totrows=100&color=blue2,green3,red2,orange1&geomtype=Line%20Graph
The following graphs and tables show the percentages for the four states with the lowest percentage of U.S. born software developers in 2022. Those states are New Jersey, California, Washington, and Texas.
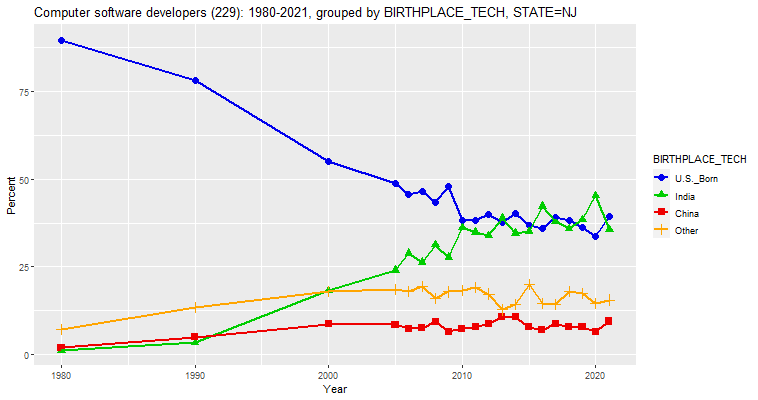
Computer software developers (229): 1980-2021, grouped by BIRTHPLACE_TECH, STATE=NJ (percent)

   Year STATE  Count U.S._Born India China Other
1  1980    NJ 15,520      89.4   1.3   2.1   7.2
2  1990    NJ 34,167      78.0   3.5   5.0  13.5
3  2000    NJ 68,260      54.9  18.3   8.7  18.1
4  2005    NJ 65,871      48.6  24.1   8.6  18.7
5  2006    NJ 60,366      45.6  28.8   7.5  18.1
6  2007    NJ 64,150      46.4  26.3   7.6  19.6
7  2008    NJ 67,423      43.3  31.2   9.4  16.0
8  2009    NJ 60,486      47.8  27.7   6.5  17.9
9  2010    NJ 59,849      38.2  36.1   7.4  18.3
10 2011    NJ 60,756      38.1  34.8   7.9  19.2
11 2012    NJ 61,755      40.0  33.8   8.9  17.3
12 2013    NJ 61,941      37.8  38.8  10.7  12.8
13 2014    NJ 66,562      40.3  34.6  10.8  14.4
14 2015    NJ 69,410      36.9  35.2   7.9  20.1
15 2016    NJ 71,402      36.0  42.2   7.0  14.7
16 2017    NJ 70,269      39.1  37.9   8.8  14.2
17 2018    NJ 78,855      38.2  35.9   7.9  18.1
18 2019    NJ 75,567      36.2  38.4   7.9  17.4
19 2020    NJ 79,128      33.7  45.2   6.5  14.5
20 2021    NJ 96,497      39.3  35.6   9.5  15.6

URL parameters (short)=
?minyear=1980&maxyear=2021&STATE=NJ&geo=STATE&occ=Computer%20software%20developers%20(229)&group=BIRTHPLACE_TECH&sortn=4&mincount=1&totrows=50&color=blue2,green3,red2,orange1&geomtype=Line%20Graph
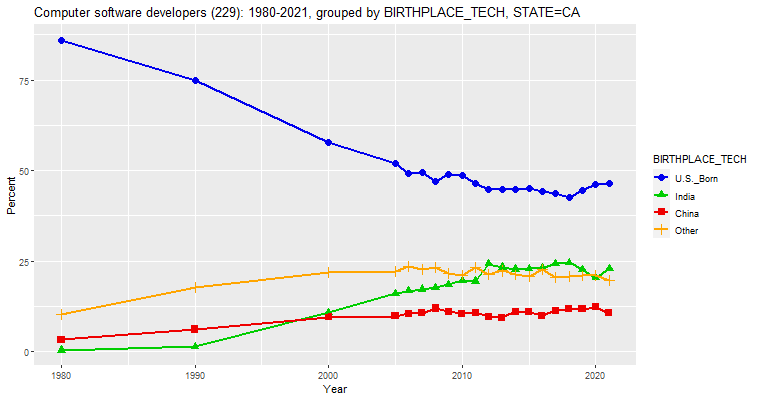
Computer software developers (229): 1980-2021, grouped by BIRTHPLACE_TECH, STATE=CA (percent)

   Year STATE   Count U.S._Born India China Other
1  1980    CA  42,500      85.9   0.4   3.3  10.4
2  1990    CA  89,177      74.7   1.4   6.2  17.7
3  2000    CA 210,067      57.8  10.8   9.5  21.9
4  2005    CA 188,705      52.1  16.0   9.8  22.1
5  2006    CA 212,441      49.2  16.8  10.6  23.5
6  2007    CA 210,177      49.5  17.2  10.6  22.7
7  2008    CA 210,675      47.1  17.7  12.0  23.2
8  2009    CA 216,884      48.9  18.6  11.0  21.6
9  2010    CA 212,055      48.7  19.6  10.6  21.2
10 2011    CA 222,821      46.5  19.5  10.8  23.3
11 2012    CA 235,317      44.8  24.2   9.7  21.3
12 2013    CA 248,460      44.9  23.3   9.5  22.3
13 2014    CA 283,149      44.8  22.7  11.0  21.5
14 2015    CA 302,577      45.1  23.0  11.0  20.9
15 2016    CA 323,849      44.2  23.1  10.0  22.7
16 2017    CA 340,950      43.8  24.4  11.3  20.5
17 2018    CA 342,463      42.7  24.6  11.8  20.9
18 2019    CA 385,638      44.6  22.6  11.7  21.0
19 2020    CA 421,944      46.1  20.4  12.4  21.2
20 2021    CA 402,995      46.6  23.0  10.7  19.8

URL parameters (short)=
?minyear=1980&maxyear=2021&geo=STATE&occ=Computer%20software%20developers%20(229)&group=BIRTHPLACE_TECH&sortn=4&mincount=1&totrows=50&color=blue2,green3,red2,orange1&geomtype=Line%20Graph
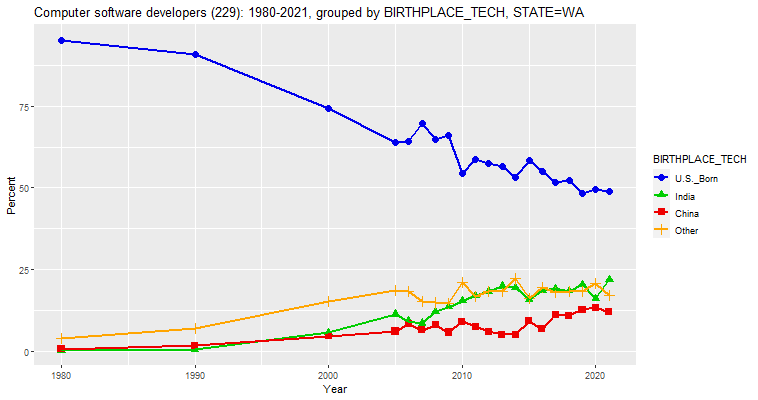
Computer software developers (229): 1980-2021, grouped by BIRTHPLACE_TECH, STATE=WA (percent)

   Year STATE   Count U.S._Born India China Other
1  1980    WA   5,700      95.1   0.4   0.7   3.9
2  1990    WA  12,372      90.7   0.5   1.7   7.1
3  2000    WA  39,621      74.3   5.7   4.7  15.3
4  2005    WA  52,956      64.0  11.3   6.1  18.5
5  2006    WA  51,583      64.1   9.3   8.3  18.3
6  2007    WA  52,440      69.8   8.6   6.5  15.2
7  2008    WA  54,017      64.9  12.2   8.0  14.8
8  2009    WA  63,346      66.0  13.6   5.8  14.6
9  2010    WA  59,400      54.4  15.4   9.1  21.1
10 2011    WA  67,648      58.6  17.0   7.6  16.8
11 2012    WA  70,406      57.4  18.4   6.0  18.2
12 2013    WA  72,461      56.7  20.0   5.1  18.2
13 2014    WA  71,505      53.3  19.4   5.1  22.2
14 2015    WA  79,425      58.5  15.9   9.3  16.2
15 2016    WA  86,443      55.1  18.5   6.8  19.6
16 2017    WA  94,231      51.7  19.1  11.2  18.0
17 2018    WA 106,603      52.4  18.5  10.9  18.2
18 2019    WA 127,954      48.3  20.4  12.7  18.5
19 2020    WA 132,356      49.6  16.2  13.4  20.9
20 2021    WA 140,318      49.0  21.9  12.0  17.1

URL parameters (short)=
?minyear=1980&maxyear=2021&STATE=WA&geo=STATE&occ=Computer%20software%20developers%20(229)&group=BIRTHPLACE_TECH&sortn=4&mincount=1&totrows=50&color=blue2,green3,red2,orange1&geomtype=Line%20Graph
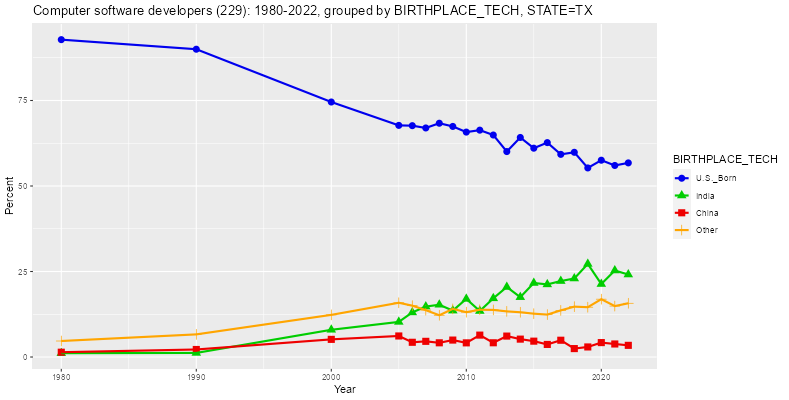
Computer software developers (229): 1980-2022, grouped by BIRTHPLACE_TECH, STATE=TX (percent)

   Year STATE   Count U.S._Born India China Other
1  1980    TX  21,360      92.8   1.1   1.4   4.7
2  1990    TX  45,169      90.0   1.2   2.2   6.6
3  2000    TX  98,662      74.6   8.0   5.2  12.3
4  2005    TX  92,843      67.7  10.3   6.2  15.9
5  2006    TX  97,016      67.6  13.0   4.3  15.0
6  2007    TX  91,256      67.0  14.7   4.6  13.7
7  2008    TX  96,849      68.4  15.3   4.2  12.2
8  2009    TX  90,754      67.4  13.6   5.0  14.1
9  2010    TX  99,589      65.8  17.0   4.1  13.1
10 2011    TX 104,529      66.3  13.4   6.4  13.8
11 2012    TX 110,163      64.9  17.2   4.2  13.8
12 2013    TX 112,015      60.1  20.5   6.1  13.3
13 2014    TX 117,947      64.2  17.5   5.2  13.1
14 2015    TX 123,576      61.1  21.6   4.6  12.7
15 2016    TX 127,412      62.7  21.2   3.7  12.4
16 2017    TX 133,351      59.3  22.2   4.9  13.6
17 2018    TX 133,851      59.9  23.0   2.5  14.7
18 2019    TX 165,832      55.3  27.2   2.9  14.6
19 2020    TX 179,749      57.5  21.3   4.2  16.9
20 2021    TX 195,749      56.0  25.3   3.8  14.9
21 2022    TX 222,364      56.8  24.1   3.4  15.7

URL parameters (short)=
?minyear=1980&maxyear=2022&STATE=TX&geo=STATE&occ=Computer%20software%20developers%20(229)&group=BIRTHPLACE_TECH&sortn=5&mincount=1&totrows=50&color=blue2,green3,red2,orange1&geomtype=Line%20Graph
The following graph and table are for the entire state of Utah. The reason for looking at Utah is that one of its Senators, Mike Lee, had been lobbying to pass the bill S386 by unanimous consent in the U.S. Senate in 2019. This bill was named the "Fairness for High-Skilled Immigrants Act of 2019" and would eliminate the per-country numerical limitation for employment-based immigrants and increase the per-country numerical limitation for family-sponsored immigrants, among other things. This would mainly benefit Indian workers who have been caught in a backlog due to the country cap on employment-based green cards. However, the following table shows that only 4.6 percent of the software developers in Utah in 2021 were born in India. This does bring up the question of why Mike Lee is the main proponent of this bill. It seems to affect relatively few of his current constituents. In addition, any negative affects on U.S. or non-Indian workers would seem to be relatively small in Utah, at least as long as Utah continues to have such little diversity in its own workforce. In any event, this would seem to be an argument for being very skeptical of Mike Lee's support for this bill since Utah will likely be one of the states least affected by it, assuming that the law does work as advertised and that there are no ulterior motives.
According to this article, S386 cleared the Senate but expired with the 116th Congress. However, it contends that it's sure to come back in the new 117th Congress. You can see a list of clients lobbying on S386 in this article from Open Secrets. As can be seen from the first page, it includes tech companies, tech consulting companies, and various associations.
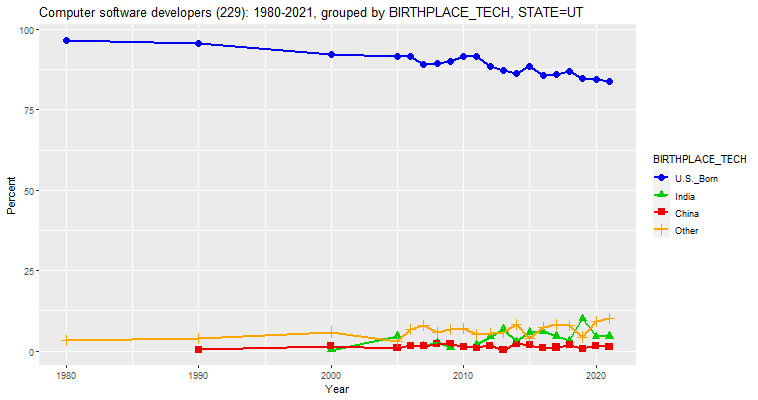
Computer software developers (229): 1980-2021, grouped by BIRTHPLACE_TECH, STATE=UT (percent)

   Year STATE  Count U.S._Born India China Other
1  1980    UT  2,360      96.6    NA    NA   3.4
2  1990    UT  4,945      95.6    NA   0.4   4.0
3  2000    UT 12,980      92.1   0.3   1.6   6.0
4  2005    UT 13,600      91.6   4.6   0.9   2.9
5  2006    UT 12,875      91.6    NA   1.7   6.7
6  2007    UT 15,562      89.1   1.6   1.5   7.8
7  2008    UT 14,713      89.4   2.7   2.1   5.8
8  2009    UT 13,599      90.1   1.2   2.2   6.6
9  2010    UT 17,544      91.6    NA   1.4   7.0
10 2011    UT 16,935      91.6   2.1   1.1   5.3
11 2012    UT 17,266      88.5   4.4   1.7   5.4
12 2013    UT 20,115      87.3   6.8   0.3   5.7
13 2014    UT 18,069      86.5   2.9   2.3   8.3
14 2015    UT 19,092      88.5   5.8   1.8   3.8
15 2016    UT 24,847      85.7   6.1   1.0   7.3
16 2017    UT 27,182      85.9   4.6   1.1   8.3
17 2018    UT 26,901      87.0   3.3   1.8   7.9
18 2019    UT 30,598      84.8  10.0   0.7   4.4
19 2020    UT 36,388      84.5   4.5   1.6   9.4
20 2021    UT 31,985      84.0   4.6   1.3  10.1

URL parameters (short)=
?minyear=1980&maxyear=2021&STATE=UT&geo=STATE&occ=Computer%20software%20developers%20(229)&group=BIRTHPLACE_TECH&sortn=4&mincount=1&totrows=50&color=blue2,green3,red2,orange1&geomtype=Line%20Graph
The following graph and table are for the entire United States. As can be seen, the percentage of software developers who were born in India has been increasing steadily since 1990, reaching about 16.8 percent in 2022. This is far above the 4.6 percent for Utah. Hence, it would seem wise to be skeptical of Mike Lee's support for S386, a bill involving issues in which his state would seem to currently have less at stake than the average state.
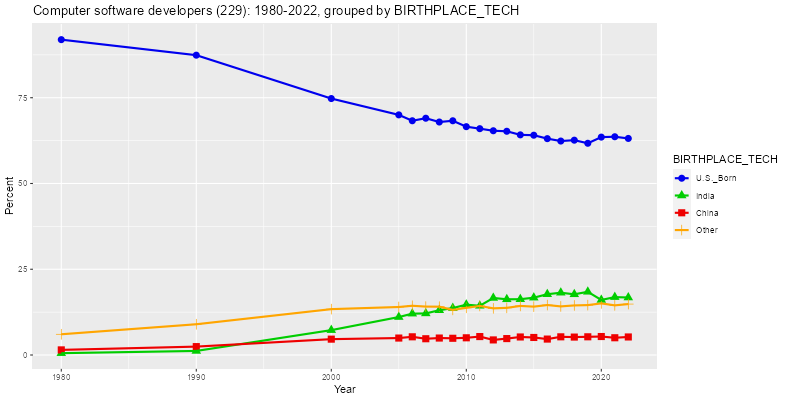
Computer software developers (229): 1980-2022, grouped by BIRTHPLACE_TECH (percent)

   Year     Count U.S._Born India China Other
1  1980   311,180      91.9   0.5   1.5   6.0
2  1990   644,172      87.4   1.2   2.4   9.0
3  2000 1,349,011      74.8   7.2   4.6  13.4
4  2005 1,279,997      70.0  11.1   4.9  14.0
5  2006 1,315,056      68.3  12.1   5.3  14.4
6  2007 1,290,484      69.0  12.1   4.7  14.1
7  2008 1,332,875      67.9  13.0   4.9  14.1
8  2009 1,325,989      68.3  13.7   4.9  13.2
9  2010 1,315,823      66.6  14.7   5.0  13.8
10 2011 1,343,537      66.0  14.3   5.4  14.3
11 2012 1,449,897      65.4  16.6   4.4  13.6
12 2013 1,480,496      65.2  16.2   4.8  13.8
13 2014 1,546,979      64.2  16.3   5.3  14.3
14 2015 1,630,473      64.1  16.7   5.1  14.1
15 2016 1,710,581      63.1  17.7   4.6  14.6
16 2017 1,803,306      62.4  18.2   5.3  14.2
17 2018 1,853,801      62.6  17.7   5.2  14.5
18 2019 2,060,393      61.7  18.4   5.3  14.5
19 2020 2,208,465      63.5  16.1   5.4  15.0
20 2021 2,283,921      63.6  16.9   5.0  14.5
21 2022 2,428,381      63.1  16.8   5.3  14.8

URL parameters (short)=
?minyear=1980&maxyear=2022&STATE=&geo=NATION&occ=Computer%20software%20developers%20(229)&group=BIRTHPLACE_TECH&sortn=5&mincount=1&totrows=50&color=blue2,green3,red2,orange1&geomtype=Line%20Graph
To see an analysis of the demographics of software developers in the United States by citizenship status instead of birthplace, see this link.