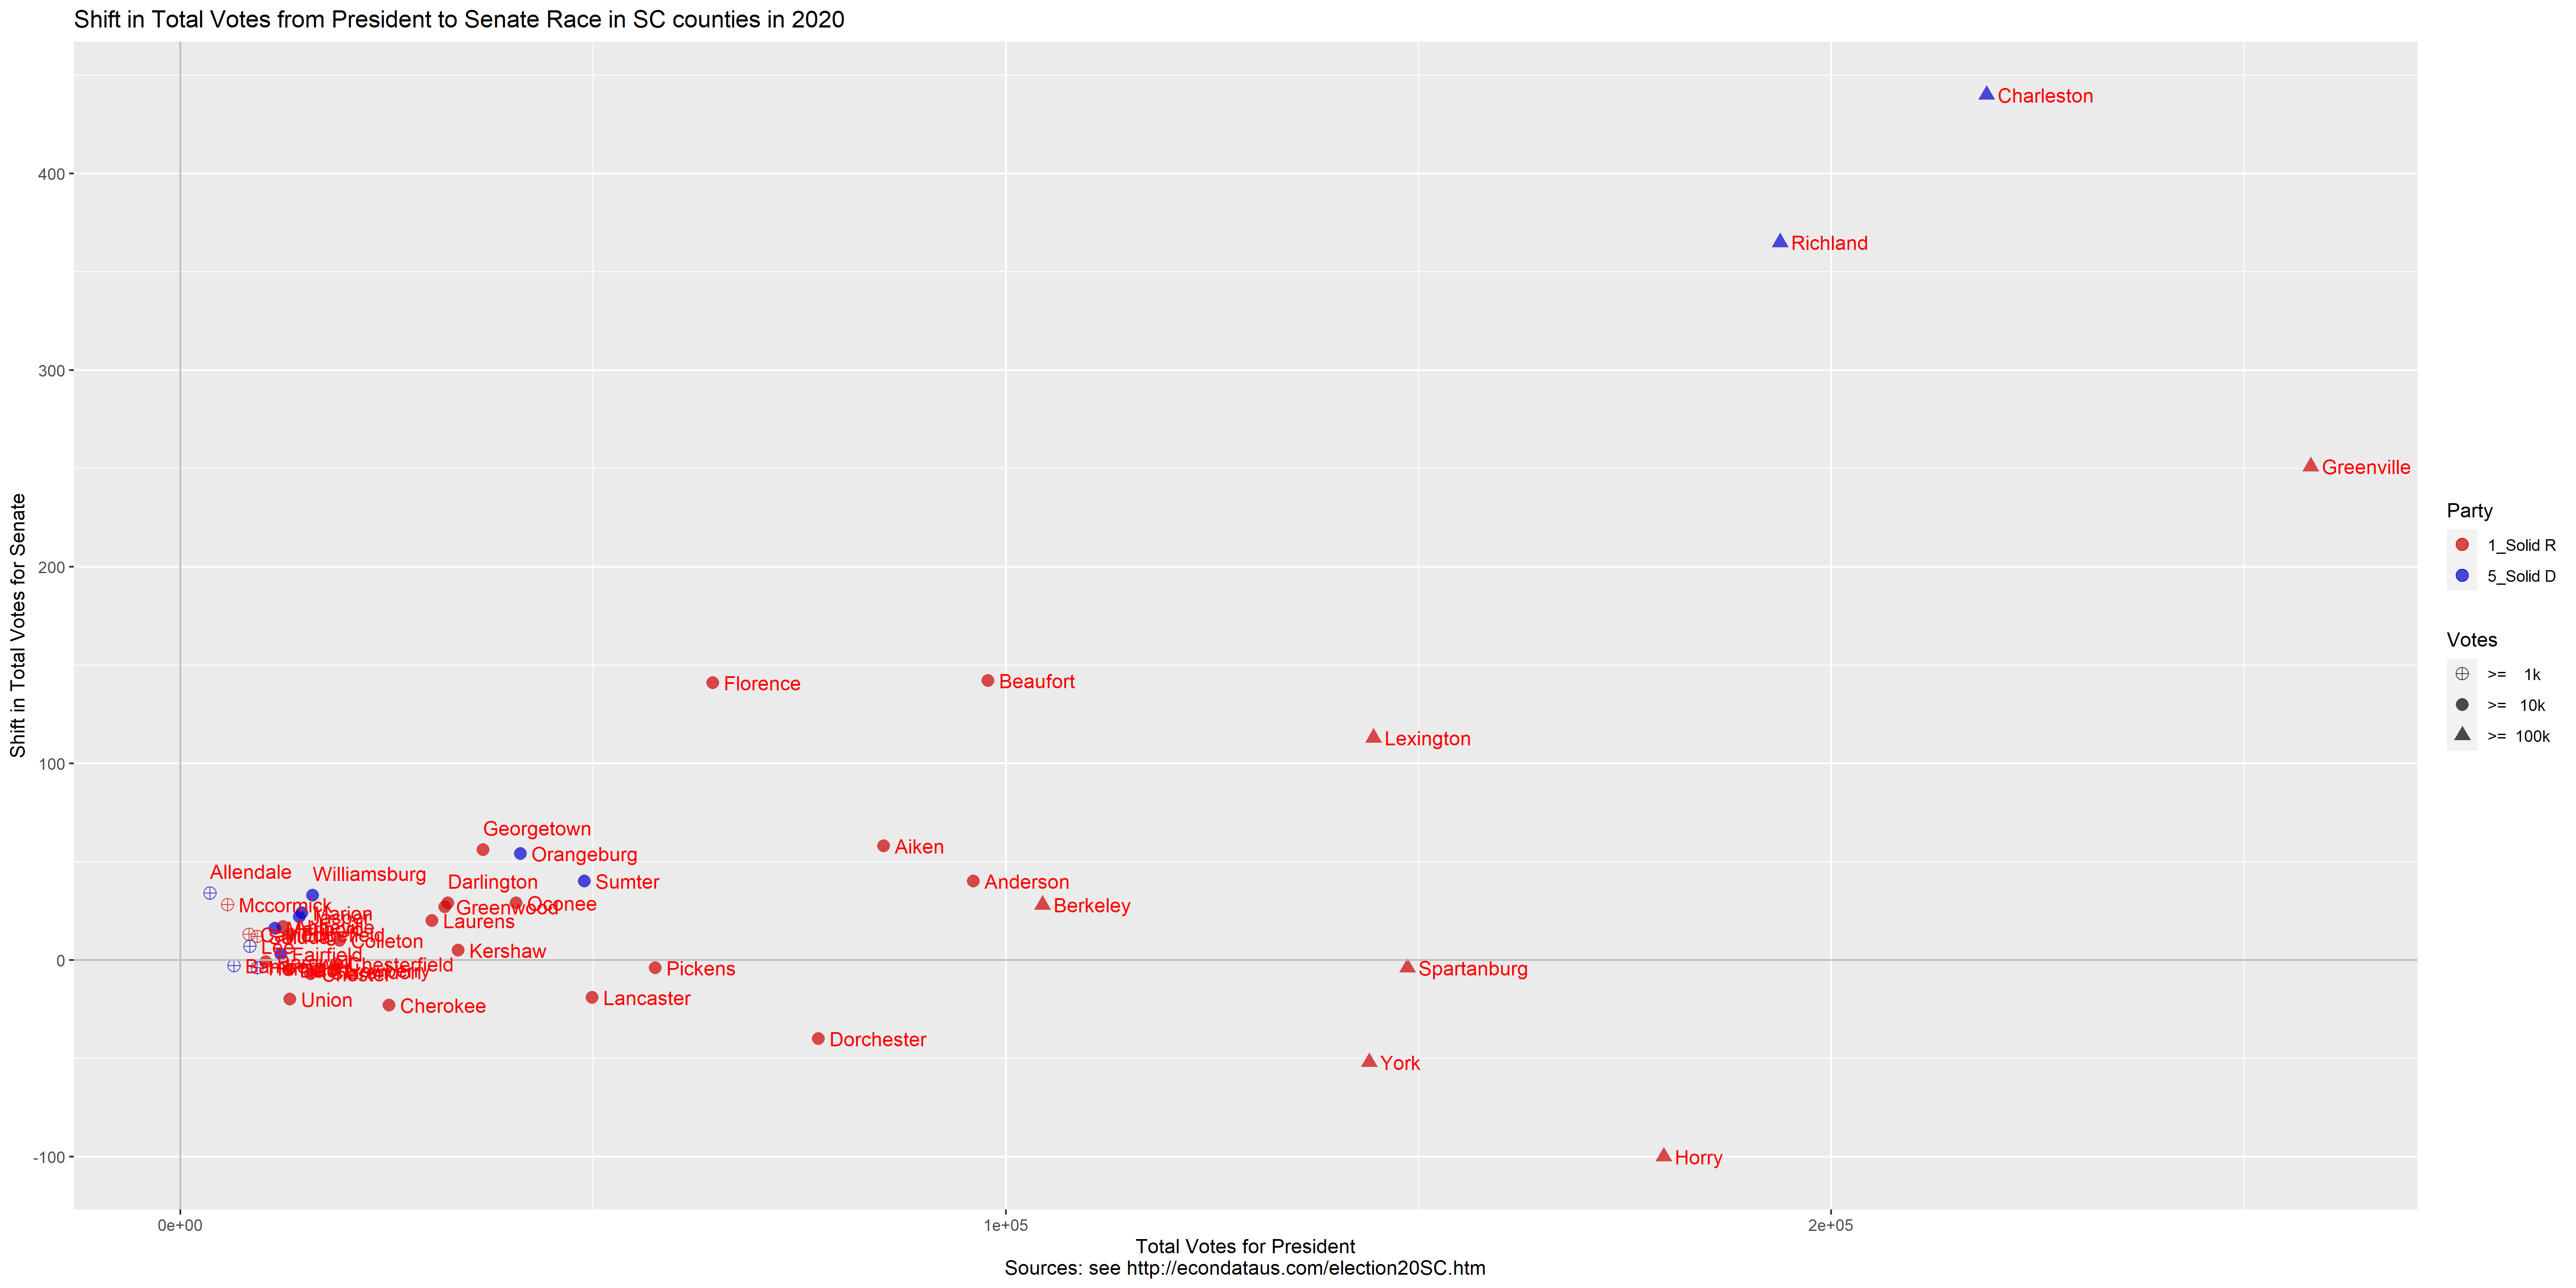
Shift in Votes from President to Senate Race in SC counties in 2020 (Count)

         COUNTY     BIDEN     TRUMP  MARGIN1    TOTAL1  HARRISON    GRAHAM  MARGIN2    TOTAL2 DEM_SH  REP_SH MAR_SH TOT_SH
1     Abbeville     4,101     8,215   -4,114    12,433     4,232     8,025   -3,793    12,450    131    -190    321     17
2         Aiken    32,275    51,589  -19,314    85,185    32,829    51,080  -18,251    85,243    554    -509  1,063     58
3     Allendale     2,718       835    1,883     3,593     2,773       833    1,940     3,627     55      -2     57     34
4      Anderson    27,169    67,565  -40,396    96,093    28,075    66,655  -38,580    96,133    906    -910  1,816     40
5       Bamberg     4,010     2,417    1,593     6,482     4,060     2,373    1,687     6,479     50     -44     94     -3
6      Barnwell     4,720     5,492     -772    10,321     4,806     5,378     -572    10,320     86    -114    200     -1
7      Beaufort    43,419    53,194   -9,775    97,835    43,489    53,575  -10,086    97,977     70     381   -311    142
8      Berkeley    45,223    57,397  -12,174   104,458    46,233    56,358  -10,125   104,486  1,010  -1,039  2,049     28
9       Calhoun     3,905     4,305     -400     8,291     3,975     4,201     -226     8,304     70    -104    174     13
10   Charleston   121,485    93,297   28,188   218,857   121,517    95,401   26,116   219,297     32   2,104 -2,072    440
11     Cherokee     6,983    18,043  -11,060    25,270     7,265    17,481  -10,216    25,247    282    -562    844    -23
12      Chester     6,941     8,660   -1,719    15,757     7,225     8,247   -1,022    15,750    284    -413    697     -7
13 Chesterfield     7,431    11,297   -3,866    18,876     7,706    10,878   -3,172    18,874    275    -419    694     -2
14    Clarendon     8,250     8,361     -111    16,733     8,391     8,141      250    16,727    141    -220    361     -6
15     Colleton     8,602    10,440   -1,838    19,283     8,839    10,068   -1,229    19,293    237    -372    609     10
16   Darlington    15,220    16,832   -1,612    32,417    15,563    16,456     -893    32,446    343    -376    719     29
17       Dillon     6,436     6,582     -146    13,101     6,663     6,297      366    13,096    227    -285    512     -5
18   Dorchester    33,824    41,913   -8,089    77,278    34,616    41,178   -6,562    77,238    792    -735  1,527    -40
19    Edgefield     4,953     8,184   -3,231    13,304     5,104     7,988   -2,884    13,317    151    -196    347     13
20    Fairfield     7,382     4,625    2,757    12,136     7,463     4,556    2,907    12,139     81     -69    150      3
21     Florence    31,153    32,615   -1,462    64,510    31,748    32,217     -469    64,651    595    -398    993    141
22   Georgetown    15,822    20,487   -4,665    36,668    15,867    20,495   -4,628    36,724     45       8     37     56
23   Greenville   103,030   150,021  -46,991   258,155   104,980   149,991  -45,011   258,406  1,950     -30  1,980    251
24    Greenwood    12,145    19,431   -7,286    32,006    12,504    19,017   -6,513    32,033    359    -414    773     27
25      Hampton     5,323     3,906    1,417     9,305     5,459     3,755    1,704     9,301    136    -151    287     -4
26        Horry    59,180   118,821  -59,641   179,744    60,530   116,512  -55,982   179,644  1,350  -2,309  3,659   -100
27       Jasper     7,185     7,078      107    14,394     7,302     6,939      363    14,416    117    -139    256     22
28      Kershaw    12,699    20,471   -7,772    33,629    12,904    20,104   -7,200    33,634    205    -367    572      5
29    Lancaster    18,937    30,312  -11,375    49,868    19,523    29,572  -10,049    49,849    586    -740  1,326    -19
30      Laurens    10,159    20,004   -9,845    30,488    10,498    19,486   -8,988    30,508    339    -518    857     20
31          Lee     5,329     3,008    2,321     8,431     5,426     2,939    2,487     8,438     97     -69    166      7
32    Lexington    49,301    92,817  -43,516   144,568    50,256    91,944  -41,688   144,681    955    -873  1,828    113
33       Marion     8,872     5,711    3,161    14,704     9,034     5,562    3,472    14,728    162    -149    311     24
34     Marlboro     6,290     5,044    1,246    11,446     6,504     4,775    1,729    11,462    214    -269    483     16
35    Mccormick     2,687     2,958     -271     5,697     2,746     2,933     -187     5,725     59     -25     84     28
36     Newberry     6,958    11,443   -4,485    18,631     7,094    11,239   -4,145    18,626    136    -204    340     -5
37       Oconee    10,414    29,698  -19,284    40,668    10,576    29,454  -18,878    40,697    162    -244    406     29
38   Orangeburg    27,295    13,603   13,692    41,205    27,720    13,221   14,499    41,259    425    -382    807     54
39      Pickens    13,645    42,907  -29,262    57,546    14,066    42,505  -28,439    57,542    421    -402    823     -4
40     Richland   132,570    58,313   74,257   193,822   133,642    58,894   74,748   194,187  1,072     581    491    365
41       Saluda     2,963     6,210   -3,247     9,274     3,023     6,107   -3,084     9,286     60    -103    163     12
42  Spartanburg    52,926    93,560  -40,634   148,655    54,475    91,594  -37,119   148,651  1,549  -1,966  3,515     -4
43       Sumter    27,379    21,000    6,379    48,920    27,791    20,524    7,267    48,960    412    -476    888     40
44        Union     4,935     8,183   -3,248    13,257     5,105     7,868   -2,763    13,237    170    -315    485    -20
45 Williamsburg    10,289     5,532    4,757    15,985    10,493     5,409    5,084    16,018    204    -123    327     33
46         York    59,008    82,727  -23,719   144,050    60,738    80,912  -20,174   143,998  1,730  -1,815  3,545    -52
47        TOTAL 1,091,541 1,385,103 -293,562 2,513,329 1,110,828 1,369,137 -258,309 2,515,104 19,287 -15,966 35,253  1,775

Source: South Carolina Election Results, 2020 Statewide General Election - Election Night Reporting, Detail XLS
Shift in Vote Share from President to Senate Race in SC counties in 2020 (Percent)

         COUNTY BIDEN TRUMP MARGIN1 TOTAL1 HARRISON GRAHAM MARGIN2 TOTAL2 DEM_SH REP_SH MAR_SH TOT_SH
1     Abbeville 32.98 66.07  -33.09  99.06    33.99  64.46  -30.47  98.45   1.01  -1.62   2.62  -0.61
2         Aiken 37.89 60.56  -22.67  98.45    38.51  59.92  -21.41  98.44   0.62  -0.64   1.26  -0.01
3     Allendale 75.65 23.24   52.41  98.89    76.45  22.97   53.49  99.42   0.81  -0.27   1.08   0.53
4      Anderson 28.27 70.31  -42.04  98.59    29.20  69.34  -40.13  98.54   0.93  -0.98   1.91  -0.05
5       Bamberg 61.86 37.29   24.58  99.15    62.66  36.63   26.04  99.29   0.80  -0.66   1.46   0.14
6      Barnwell 45.73 53.21   -7.48  98.94    46.57  52.11   -5.54  98.68   0.84  -1.10   1.94  -0.26
7      Beaufort 44.38 54.37   -9.99  98.75    44.39  54.68  -10.29  99.07   0.01   0.31  -0.30   0.32
8      Berkeley 43.29 54.95  -11.65  98.24    44.25  53.94   -9.69  98.19   0.96  -1.01   1.96  -0.05
9       Calhoun 47.10 51.92   -4.82  99.02    47.87  50.59   -2.72  98.46   0.77  -1.33   2.10  -0.56
10   Charleston 55.51 42.63   12.88  98.14    55.41  43.50   11.91  98.92  -0.10   0.87  -0.97   0.78
11     Cherokee 27.63 71.40  -43.77  99.03    28.78  69.24  -40.46  98.02   1.14  -2.16   3.30  -1.02
12      Chester 44.05 54.96  -10.91  99.01    45.87  52.36   -6.49  98.23   1.82  -2.60   4.42  -0.78
13 Chesterfield 39.37 59.85  -20.48  99.22    40.83  57.63  -16.81  98.46   1.46  -2.21   3.67  -0.75
14    Clarendon 49.30 49.97   -0.66  99.27    50.16  48.67    1.49  98.83   0.86  -1.30   2.16  -0.44
15     Colleton 44.61 54.14   -9.53  98.75    45.81  52.18   -6.37  98.00   1.21  -1.96   3.16  -0.75
16   Darlington 46.95 51.92   -4.97  98.87    47.97  50.72   -2.75  98.68   1.02  -1.21   2.22  -0.19
17       Dillon 49.13 50.24   -1.11  99.37    50.88  48.08    2.79  98.96   1.75  -2.16   3.91  -0.40
18   Dorchester 43.77 54.24  -10.47  98.01    44.82  53.31   -8.50  98.13   1.05  -0.92   1.97   0.12
19    Edgefield 37.23 61.52  -24.29  98.74    38.33  59.98  -21.66  98.31   1.10  -1.53   2.63  -0.43
20    Fairfield 60.83 38.11   22.72  98.94    61.48  37.53   23.95  99.01   0.65  -0.58   1.23   0.07
21     Florence 48.29 50.56   -2.27  98.85    49.11  49.83   -0.73  98.94   0.82  -0.73   1.54   0.09
22   Georgetown 43.15 55.87  -12.72  99.02    43.21  55.81  -12.60  99.01   0.06  -0.06   0.12  -0.01
23   Greenville 39.91 58.11  -18.20  98.02    40.63  58.04  -17.42  98.67   0.72  -0.07   0.78   0.65
24    Greenwood 37.95 60.71  -22.76  98.66    39.03  59.37  -20.33  98.40   1.09  -1.34   2.43  -0.25
25      Hampton 57.21 41.98   15.23  99.18    58.69  40.37   18.32  99.06   1.49  -1.61   3.09  -0.12
26        Horry 32.92 66.11  -33.18  99.03    33.69  64.86  -31.16  98.55   0.77  -1.25   2.02  -0.48
27       Jasper 49.92 49.17    0.74  99.09    50.65  48.13    2.52  98.79   0.74  -1.04   1.77  -0.30
28      Kershaw 37.76 60.87  -23.11  98.64    38.37  59.77  -21.41  98.14   0.60  -1.10   1.70  -0.50
29    Lancaster 37.97 60.78  -22.81  98.76    39.16  59.32  -20.16  98.49   1.19  -1.46   2.65  -0.27
30      Laurens 33.32 65.61  -32.29  98.93    34.41  63.87  -29.46  98.28   1.09  -1.74   2.83  -0.65
31          Lee 63.21 35.68   27.53  98.89    64.30  34.83   29.47  99.13   1.10  -0.85   1.94   0.25
32    Lexington 34.10 64.20  -30.10  98.31    34.74  63.55  -28.81  98.29   0.63  -0.65   1.29  -0.02
33       Marion 60.34 38.84   21.50  99.18    61.34  37.76   23.57  99.10   1.00  -1.07   2.08  -0.07
34     Marlboro 54.95 44.07   10.89  99.02    56.74  41.66   15.08  98.40   1.79  -2.41   4.20  -0.62
35    Mccormick 47.17 51.92   -4.76  99.09    47.97  51.23   -3.27  99.20   0.80  -0.69   1.49   0.11
36     Newberry 37.35 61.42  -24.07  98.77    38.09  60.34  -22.25  98.43   0.74  -1.08   1.82  -0.34
37       Oconee 25.61 73.03  -47.42  98.63    25.99  72.37  -46.39  98.36   0.38  -0.65   1.03  -0.27
38   Orangeburg 66.24 33.01   33.23  99.25    67.19  32.04   35.14  99.23   0.94  -0.97   1.91  -0.03
39      Pickens 23.71 74.56  -50.85  98.27    24.44  73.87  -49.42  98.31   0.73  -0.69   1.43   0.04
40     Richland 68.40 30.09   38.31  98.48    68.82  30.33   38.49  99.15   0.42   0.24   0.18   0.67
41       Saluda 31.95 66.96  -35.01  98.91    32.55  65.77  -33.21  98.32   0.60  -1.20   1.80  -0.59
42  Spartanburg 35.60 62.94  -27.33  98.54    36.65  61.62  -24.97  98.26   1.04  -1.32   2.36  -0.28
43       Sumter 55.97 42.93   13.04  98.89    56.76  41.92   14.84  98.68   0.80  -1.01   1.80  -0.21
44        Union 37.23 61.73  -24.50  98.95    38.57  59.44  -20.87  98.01   1.34  -2.29   3.63  -0.95
45 Williamsburg 64.37 34.61   29.76  98.97    65.51  33.77   31.74  99.28   1.14  -0.84   1.98   0.30
46         York 40.96 57.43  -16.47  98.39    42.18  56.19  -14.01  98.37   1.22  -1.24   2.46  -0.02
47        TOTAL 43.43 55.11  -11.68  98.54    44.17  54.44  -10.27  98.60   0.74  -0.67   1.41   0.06

Source: South Carolina Election Results, 2020 Statewide General Election - Election Night Reporting, Detail XLS
Shift in Votes from House to Senate Race in SC counties in 2020 (Count)

         COUNTY      DEM1      REP1     MAR1      TOT1  HARRISON    GRAHAM  MARGIN2    TOTAL2 DEM_SH  REP_SH  MAR_SH TOT_SH
1     Abbeville     3,938     8,437   -4,499    12,387     4,232     8,025   -3,793    12,450    294    -412     706     63
2         Aiken    31,367    52,331  -20,964    85,037    32,829    51,080  -18,251    85,243  1,462  -1,251   2,713    206
3     Allendale     2,778       812    1,966     3,616     2,773       833    1,940     3,627     -5      21     -26     11
4      Anderson    25,106    70,455  -45,349    95,634    28,075    66,655  -38,580    96,133  2,969  -3,800   6,769    499
5       Bamberg     4,159     2,274    1,885     6,480     4,060     2,373    1,687     6,479    -99      99    -198     -1
6      Barnwell     4,807     5,386     -579    10,311     4,806     5,378     -572    10,320     -1      -8       7      9
7      Beaufort    45,179    52,392   -7,213    97,695    43,489    53,575  -10,086    97,977 -1,690   1,183  -2,873    282
8      Berkeley    48,262    55,706   -7,444   104,244    46,233    56,358  -10,125   104,486 -2,029     652  -2,681    242
9       Calhoun     4,016     4,177     -161     8,277     3,975     4,201     -226     8,304    -41      24     -65     27
10   Charleston   127,619    90,365   37,254   218,697   121,517    95,401   26,116   219,297 -6,102   5,036 -11,138    600
11     Cherokee     6,914    18,232  -11,318    25,164     7,265    17,481  -10,216    25,247    351    -751   1,102     83
12      Chester     6,898     8,798   -1,900    15,703     7,225     8,247   -1,022    15,750    327    -551     878     47
13 Chesterfield     7,371    11,456   -4,085    18,837     7,706    10,878   -3,172    18,874    335    -578     913     37
14    Clarendon     8,465     8,110      355    16,697     8,391     8,141      250    16,727    -74      31    -105     30
15     Colleton     8,877    10,117   -1,240    19,248     8,839    10,068   -1,229    19,293    -38     -49      11     45
16   Darlington    14,850    17,502   -2,652    32,379    15,563    16,456     -893    32,446    713  -1,046   1,759     67
17       Dillon     6,337     6,710     -373    13,054     6,663     6,297      366    13,096    326    -413     739     42
18   Dorchester    36,424    40,427   -4,003    77,084    34,616    41,178   -6,562    77,238 -1,808     751  -2,559    154
19    Edgefield     4,859     8,428   -3,569    13,291     5,104     7,988   -2,884    13,317    245    -440     685     26
20    Fairfield     7,315     4,770    2,545    12,097     7,463     4,556    2,907    12,139    148    -214     362     42
21     Florence    30,150    34,310   -4,160    64,549    31,748    32,217     -469    64,651  1,598  -2,093   3,691    102
22   Georgetown    14,812    21,740   -6,928    36,571    15,867    20,495   -4,628    36,724  1,055  -1,245   2,300    153
23   Greenville    96,432   156,913  -60,481   256,622   104,980   149,991  -45,011   258,406  8,548  -6,922  15,470  1,784
24    Greenwood    11,410    20,416   -9,006    31,856    12,504    19,017   -6,513    32,033  1,094  -1,399   2,493    177
25      Hampton     5,513     3,676    1,837     9,266     5,459     3,755    1,704     9,301    -54      79    -133     35
26        Horry    54,244   124,568  -70,324   178,945    60,530   116,512  -55,982   179,644  6,286  -8,056  14,342    699
27       Jasper     7,123     7,059       64    14,334     7,302     6,939      363    14,416    179    -120     299     82
28      Kershaw    12,207    21,212   -9,005    33,443    12,904    20,104   -7,200    33,634    697  -1,108   1,805    191
29    Lancaster    18,161    31,493  -13,332    49,676    19,523    29,572  -10,049    49,849  1,362  -1,921   3,283    173
30      Laurens     9,702    20,692  -10,990    30,428    10,498    19,486   -8,988    30,508    796  -1,206   2,002     80
31          Lee     5,359     3,056    2,303     8,426     5,426     2,939    2,487     8,438     67    -117     184     12
32    Lexington    48,515    92,872  -44,357   144,279    50,256    91,944  -41,688   144,681  1,741    -928   2,669    402
33       Marion     8,617     6,072    2,545    14,694     9,034     5,562    3,472    14,728    417    -510     927     34
34     Marlboro     6,232     5,213    1,019    11,449     6,504     4,775    1,729    11,462    272    -438     710     13
35    Mccormick     2,607     3,092     -485     5,701     2,746     2,933     -187     5,725    139    -159     298     24
36     Newberry     6,618    11,891   -5,273    18,514     7,094    11,239   -4,145    18,626    476    -652   1,128    112
37       Oconee     9,426    30,983  -21,557    40,459    10,576    29,454  -18,878    40,697  1,150  -1,529   2,679    238
38   Orangeburg    27,810    13,105   14,705    41,212    27,720    13,221   14,499    41,259    -90     116    -206     47
39      Pickens    12,416    44,754  -32,338    57,242    14,066    42,505  -28,439    57,542  1,650  -2,249   3,899    300
40     Richland   131,110    59,573   71,537   193,432   133,642    58,894   74,748   194,187  2,532    -679   3,211    755
41       Saluda     2,843     6,376   -3,533     9,224     3,023     6,107   -3,084     9,286    180    -269     449     62
42  Spartanburg    50,963    94,598  -43,635   147,716    54,475    91,594  -37,119   148,651  3,512  -3,004   6,516    935
43       Sumter    27,176    21,570    5,606    48,851    27,791    20,524    7,267    48,960    615  -1,046   1,661    109
44        Union     4,963     8,191   -3,228    13,170     5,105     7,868   -2,763    13,237    142    -323     465     67
45 Williamsburg    10,544     5,330    5,214    15,991    10,493     5,409    5,084    16,018    -51      79    -130     27
46         York    56,305    87,044  -30,739   143,460    60,738    80,912  -20,174   143,998  4,433  -6,132  10,565    538
47        TOTAL 1,076,799 1,412,684 -335,885 2,505,442 1,110,828 1,369,137 -258,309 2,515,104 34,029 -43,547  77,576  9,662

Source: South Carolina Election Results, 2020 Statewide General Election - Election Night Reporting, Detail XLS
Shift in Vote Share from House to Senate Race in SC counties in 2020 (Percent)

         COUNTY  DEM1  REP1   MAR1  TOT1 HARRISON GRAHAM MARGIN2 TOTAL2 DEM_SH REP_SH MAR_SH TOT_SH
1     Abbeville 31.79 68.11 -36.32 99.90    33.99  64.46  -30.47  98.45   2.20  -3.65   5.85  -1.45
2         Aiken 36.89 61.54 -24.65 98.43    38.51  59.92  -21.41  98.44   1.63  -1.62   3.24   0.01
3     Allendale 76.83 22.46  54.37 99.28    76.45  22.97   53.49  99.42  -0.37   0.51  -0.88   0.14
4      Anderson 26.25 73.67 -47.42 99.92    29.20  69.34  -40.13  98.54   2.95  -4.34   7.29  -1.38
5       Bamberg 64.18 35.09  29.09 99.27    62.66  36.63   26.04  99.29  -1.52   1.53  -3.05   0.02
6      Barnwell 46.62 52.24  -5.62 98.86    46.57  52.11   -5.54  98.68  -0.05  -0.12   0.07  -0.17
7      Beaufort 46.24 53.63  -7.38 99.87    44.39  54.68  -10.29  99.07  -1.86   1.05  -2.91  -0.80
8      Berkeley 46.30 53.44  -7.14 99.74    44.25  53.94   -9.69  98.19  -2.05   0.50  -2.55  -1.55
9       Calhoun 48.52 50.47  -1.95 98.99    47.87  50.59   -2.72  98.46  -0.65   0.12  -0.78  -0.53
10   Charleston 58.35 41.32  17.03 99.67    55.41  43.50   11.91  98.92  -2.94   2.18  -5.13  -0.76
11     Cherokee 27.48 72.45 -44.98 99.93    28.78  69.24  -40.46  98.02   1.30  -3.21   4.51  -1.91
12      Chester 43.93 56.03 -12.10 99.96    45.87  52.36   -6.49  98.23   1.95  -3.67   5.61  -1.72
13 Chesterfield 39.13 60.82 -21.69 99.95    40.83  57.63  -16.81  98.46   1.70  -3.18   4.88  -1.48
14    Clarendon 50.70 48.57   2.13 99.27    50.16  48.67    1.49  98.83  -0.53   0.10  -0.63  -0.44
15     Colleton 46.12 52.56  -6.44 98.68    45.81  52.18   -6.37  98.00  -0.30  -0.38   0.07  -0.68
16   Darlington 45.86 54.05  -8.19 99.92    47.97  50.72   -2.75  98.68   2.10  -3.34   5.44  -1.23
17       Dillon 48.54 51.40  -2.86 99.95    50.88  48.08    2.79  98.96   2.33  -3.32   5.65  -0.98
18   Dorchester 47.25 52.45  -5.19 99.70    44.82  53.31   -8.50  98.13  -2.44   0.87  -3.30  -1.57
19    Edgefield 36.56 63.41 -26.85 99.97    38.33  59.98  -21.66  98.31   1.77  -3.43   5.20  -1.66
20    Fairfield 60.47 39.43  21.04 99.90    61.48  37.53   23.95  99.01   1.01  -1.90   2.91  -0.89
21     Florence 46.71 53.15  -6.44 99.86    49.11  49.83   -0.73  98.94   2.40  -3.32   5.72  -0.92
22   Georgetown 40.50 59.45 -18.94 99.95    43.21  55.81  -12.60  99.01   2.70  -3.64   6.34  -0.93
23   Greenville 37.58 61.15 -23.57 98.72    40.63  58.04  -17.42  98.67   3.05  -3.10   6.15  -0.05
24    Greenwood 35.82 64.09 -28.27 99.91    39.03  59.37  -20.33  98.40   3.22  -4.72   7.94  -1.50
25      Hampton 59.50 39.67  19.83 99.17    58.69  40.37   18.32  99.06  -0.80   0.70  -1.50  -0.10
26        Horry 30.31 69.61 -39.30 99.93    33.69  64.86  -31.16  98.55   3.38  -4.76   8.14  -1.37
27       Jasper 49.69 49.25   0.45 98.94    50.65  48.13    2.52  98.79   0.96  -1.11   2.07  -0.15
28      Kershaw 36.50 63.43 -26.93 99.93    38.37  59.77  -21.41  98.14   1.87  -3.65   5.52  -1.79
29    Lancaster 36.56 63.40 -26.84 99.96    39.16  59.32  -20.16  98.49   2.61  -4.07   6.68  -1.47
30      Laurens 31.89 68.00 -36.12 99.89    34.41  63.87  -29.46  98.28   2.53  -4.13   6.66  -1.61
31          Lee 63.60 36.27  27.33 99.87    64.30  34.83   29.47  99.13   0.70  -1.44   2.14  -0.73
32    Lexington 33.63 64.37 -30.74 98.00    34.74  63.55  -28.81  98.29   1.11  -0.82   1.93   0.29
33       Marion 58.64 41.32  17.32 99.97    61.34  37.76   23.57  99.10   2.70  -3.56   6.25  -0.86
34     Marlboro 54.43 45.53   8.90 99.97    56.74  41.66   15.08  98.40   2.31  -3.87   6.18  -1.56
35    Mccormick 45.73 54.24  -8.51 99.96    47.97  51.23   -3.27  99.20   2.24  -3.00   5.24  -0.77
36     Newberry 35.75 64.23 -28.48 99.97    38.09  60.34  -22.25  98.43   2.34  -3.89   6.23  -1.55
37       Oconee 23.30 76.58 -53.28 99.88    25.99  72.37  -46.39  98.36   2.69  -4.20   6.89  -1.52
38   Orangeburg 67.48 31.80  35.68 99.28    67.19  32.04   35.14  99.23  -0.30   0.24  -0.54  -0.05
39      Pickens 21.69 78.18 -56.49 99.87    24.44  73.87  -49.42  98.31   2.75  -4.32   7.07  -1.56
40     Richland 67.78 30.80  36.98 98.58    68.82  30.33   38.49  99.15   1.04  -0.47   1.51   0.57
41       Saluda 30.82 69.12 -38.30 99.95    32.55  65.77  -33.21  98.32   1.73  -3.36   5.09  -1.63
42  Spartanburg 34.50 64.04 -29.54 98.54    36.65  61.62  -24.97  98.26   2.15  -2.42   4.57  -0.28
43       Sumter 55.63 44.15  11.48 99.79    56.76  41.92   14.84  98.68   1.13  -2.23   3.37  -1.10
44        Union 37.68 62.19 -24.51 99.88    38.57  59.44  -20.87  98.01   0.88  -2.75   3.64  -1.87
45 Williamsburg 65.94 33.33  32.61 99.27    65.51  33.77   31.74  99.28  -0.43   0.44  -0.87   0.01
46         York 39.25 60.67 -21.43 99.92    42.18  56.19  -14.01  98.37   2.93  -4.49   7.42  -1.55
47        TOTAL 42.98 56.38 -13.41 99.36    44.17  54.44  -10.27  98.60   1.19  -1.95   3.14  -0.76

Source: South Carolina Election Results, 2020 Statewide General Election - Election Night Reporting, Detail XLS