Comparing the 2024 Senate and Presidential Races by County and Precinct
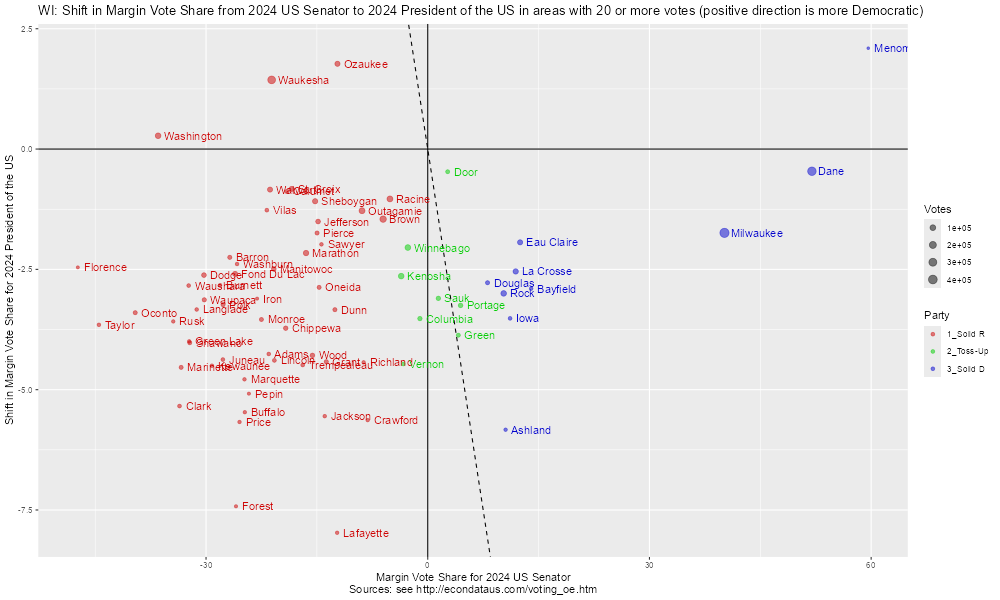
According to Wikipedia, Republican Donald Trump defeated Democrat Kamala Harris by 29,397 votes in the 2024 Presidential race in Wisconsin. However, according to Wikipedia, Democrat Tammy Baldwin defeated Republican Eric Hovde by 28,781 votes in the 2024 Senate race in Wisconsin. The following graph shows the shift in the margin vote share from the Senate race to the Presidential race by county. The positive direction is more Democratic along both axes in this graph. Hence, all but 4 counties had higher vote margins for Trump than for Hovde.
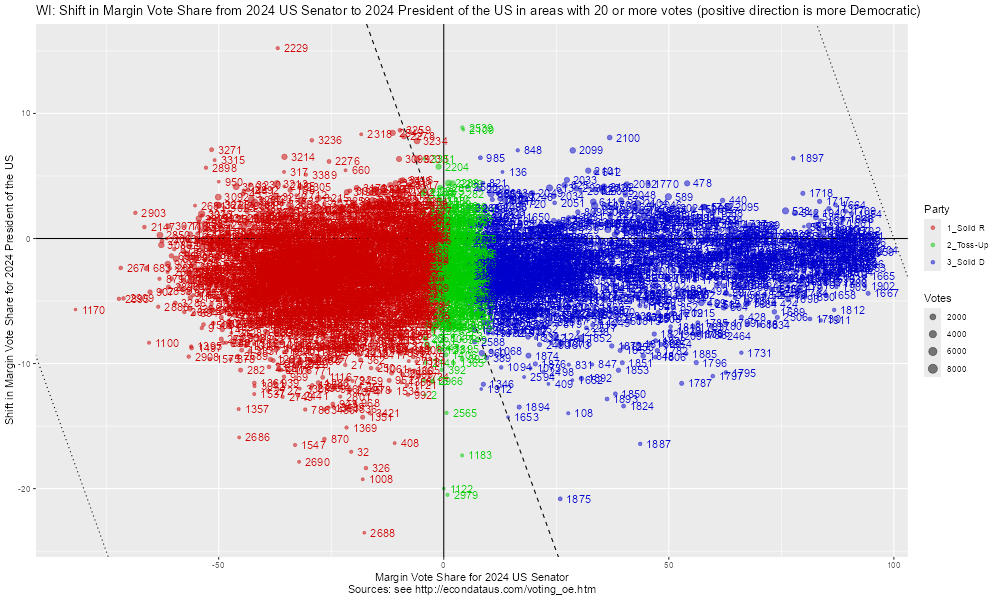
The following graph shows the same shift but by precinct instead of county. By eye, it appears that the precincts shifted Republican on average from an average of about 4 percent for the solid Republican precincts on the far left of the graph to about 2 percent for the solid Democrat precincts on the far right of the graph.
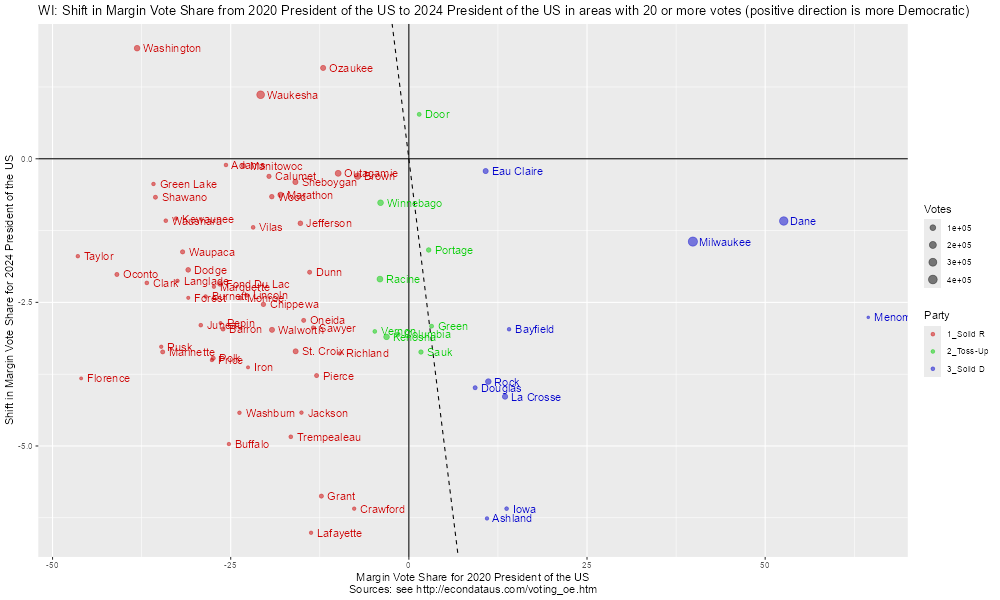
In the same way, it's possible to compare the 2020 and 2024 presidential races by county and precinct. As mentioned above, Wikipedia shows Republican Donald Trump defeating Democrat Kamala Harris by 29,397 votes in the 2024 Presidential race in Wisconsin. However, Wikipedia shows Democrat Joe Biden defeating Republican Donald Trump by 20,682 votes in the 2020 Presidential race in Wisconsin. The following graph shows the shift in the margin vote share from the Presidential race in 2020 to the Presidential race in 2024 by county. The positive direction is more Democratic along both axes in this graph. Hence, all but 4 counties had higher vote margins for Biden in 2020 than for Harris in 2024.
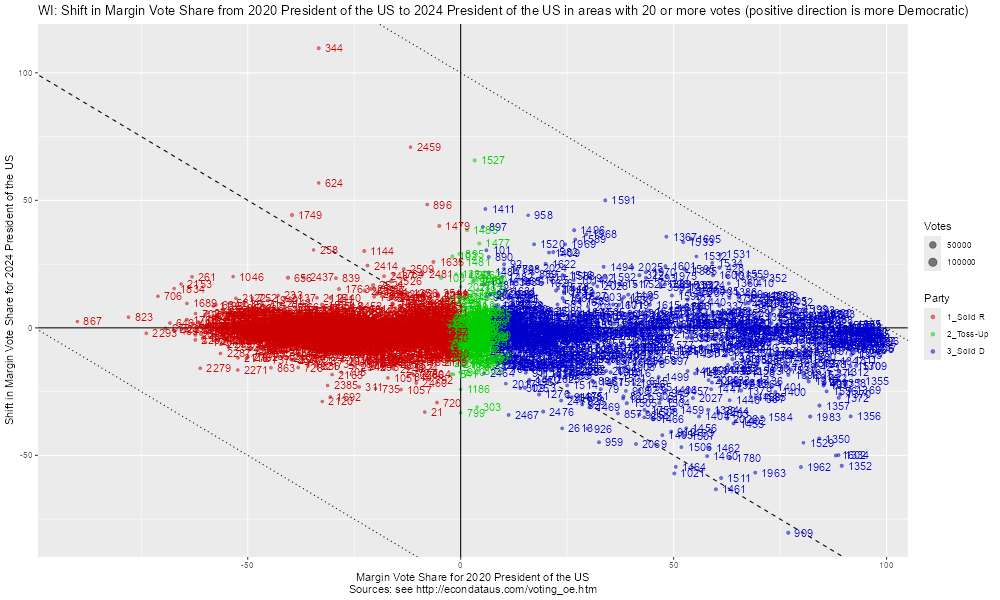
The following graph shows the same shift but by precinct instead of county. By eye, it appears that the solid Republican precincts did not shift on average but that the solid Democrat precincts did shift slightly Republican on average due to a relatively large number of Democrat precincts that shifted Republican by 25 percent or more.
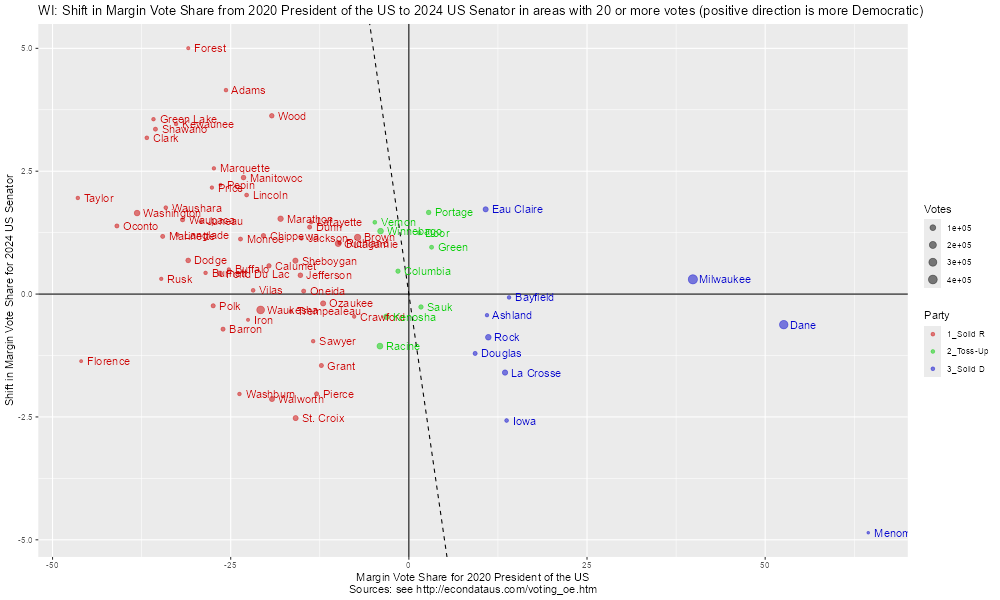
Since Biden won by 20,682 votes in the 2020 Presidential race in Wisconsin and Democrat Tammy Baldwin won by 28,781 votes in the 2024 Senate race in Wisconsin, it might be interesting to compare those two races. The following graph shows the shift in the margin vote share from the Presidential race in 2020 to the Senate race in 2024 by county. The shift in margin vote shares appear to be fairly balanced on average with about about half the counties (or slightly more) shifting more Democrat and about half the counties (or slightly less) shifting more Republican.
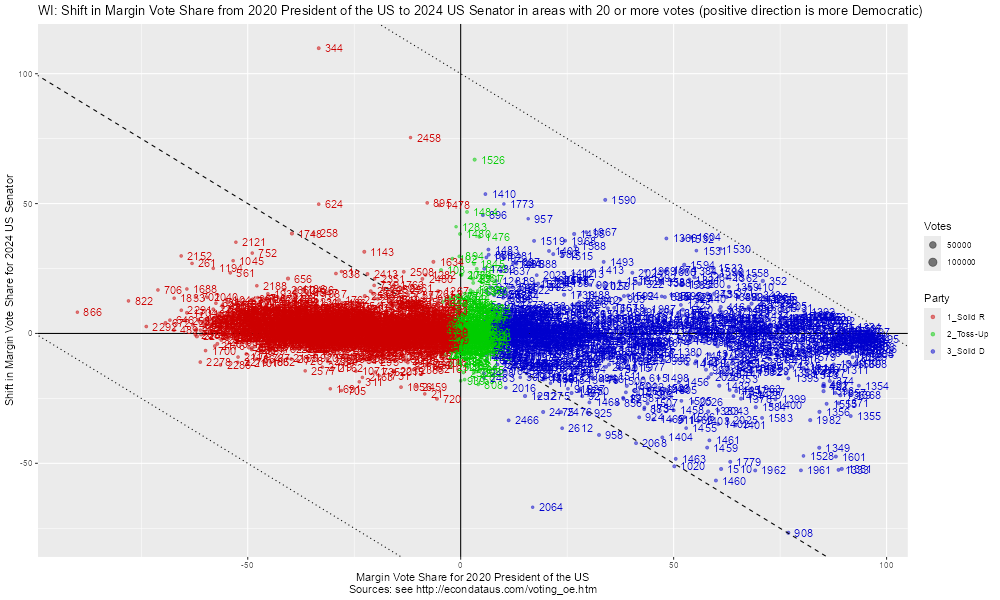
The following graph shows the same shift but by precinct instead of county. By eye, it appears that the solid Republican precincts did shift slightly Republican on average but that this was offset by the solid Democrat precincts which did shift slightly Republican on average due to a relatively large number of Democrat precincts that shifted Republican by 20 percent or more.
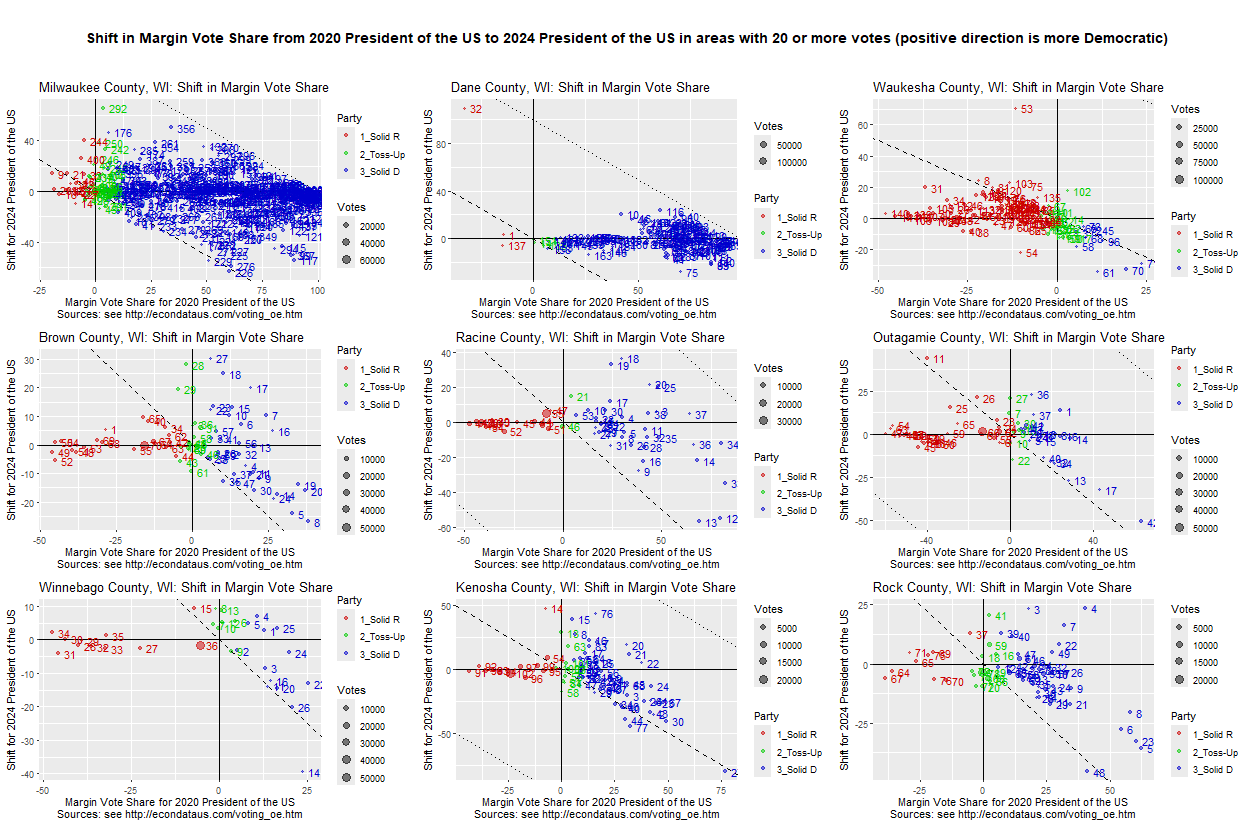
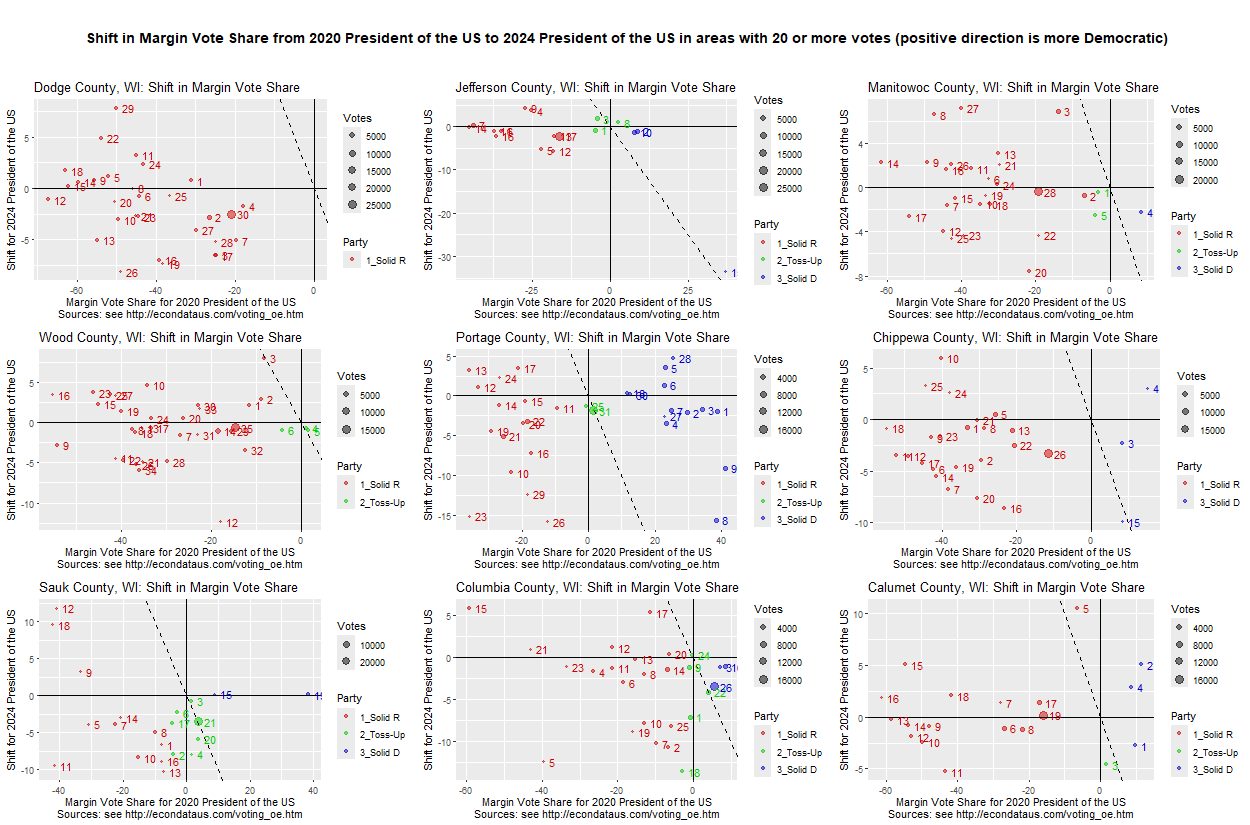
The following 9 graphs show the shift in the margin vote share from the Presidential race in 2020 to the Presidential race in 2024 in the 9 most populous Wisconsin counties according to this page showing Wisconsin counties by population in 2025.
Except for Dane County, all counties seem to show a pattern by which the solid Republican precincts shifted little on average but that the Democrat precincts shifted Republican on average. The odd thing is that there appears to be something of a sharp turn toward an increasing Republican shift starting right at the solid Democrat precincts (or sometimes the toss-up precincts). It would seem easier to explain an increasing Republican shift from left to right as there are more Democrat voters to shift. But it's hard to think of any reason that the shift would occur right at the point that the precinct become Democrat (or toss-ups). In addition, many of the shifts seem to stay just above the diagonal dashed line. This means that those precincts shift in the Republican direction but remain Democrat-leaning.
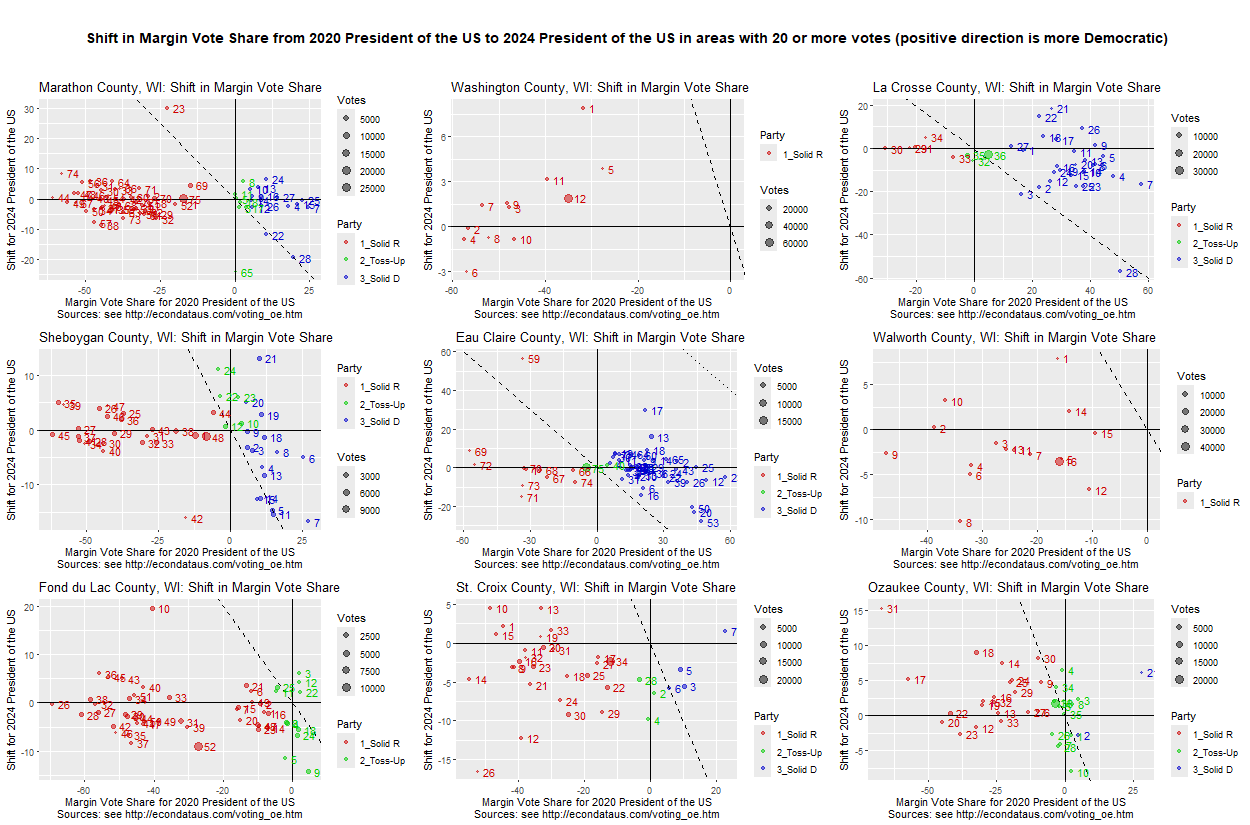
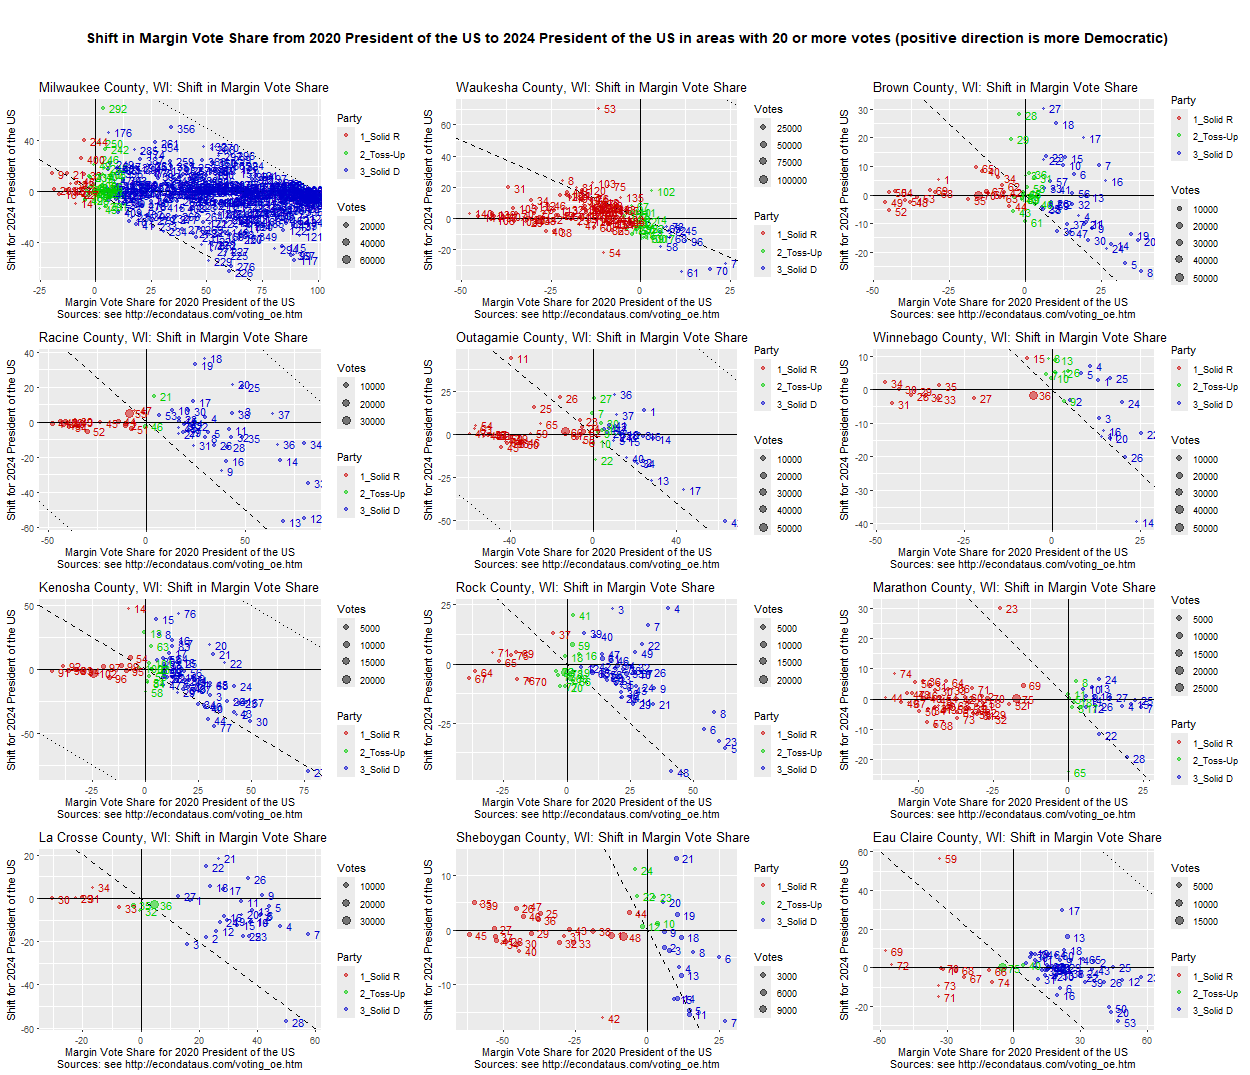
The following 9 graphs show the shift in the next 9 most populous Wisconsin counties:
Here the pattern seems somewhat discernible in Marathon, La Crosse, Sheboygan, and Eau Claire Counties, most notably in Sheboygan County. It does not appear discernible in the other counties, perhaps chiefly due to the fact that they contain few solid Democrat precincts.
The following 9 graphs show the shift in the next 9 most populous Wisconsin counties:
Here the pattern does not seem discernible in any of the counties. Again this may be chiefly due to the fact that most contain few solid Democrat precincts.
In summary, following are the 12 Wisconsin counties where the pattern described in the prior section seems somewhat discernible:
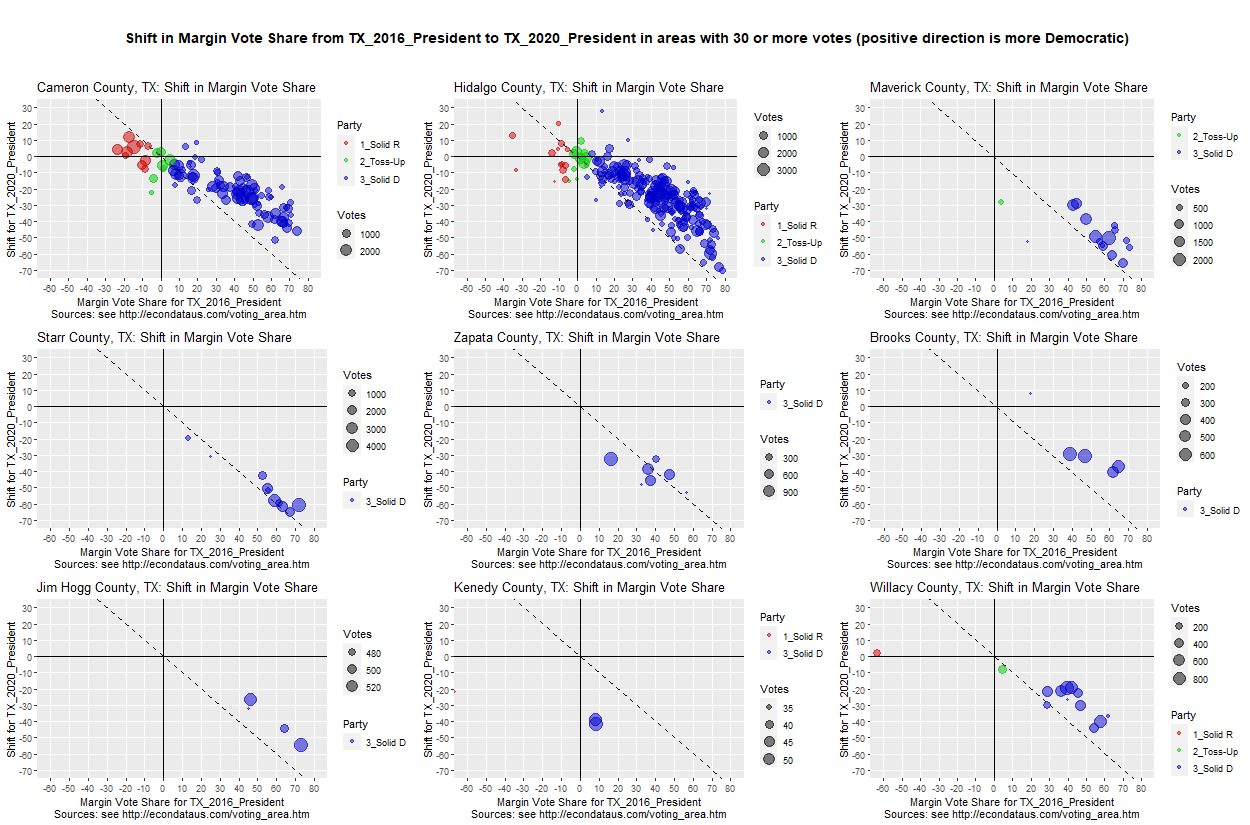
This pattern is reminiscent of a pattern seen in comparing the 2016 and 2020 presidential races in Texas as seen in the following 9 graphs from this page.
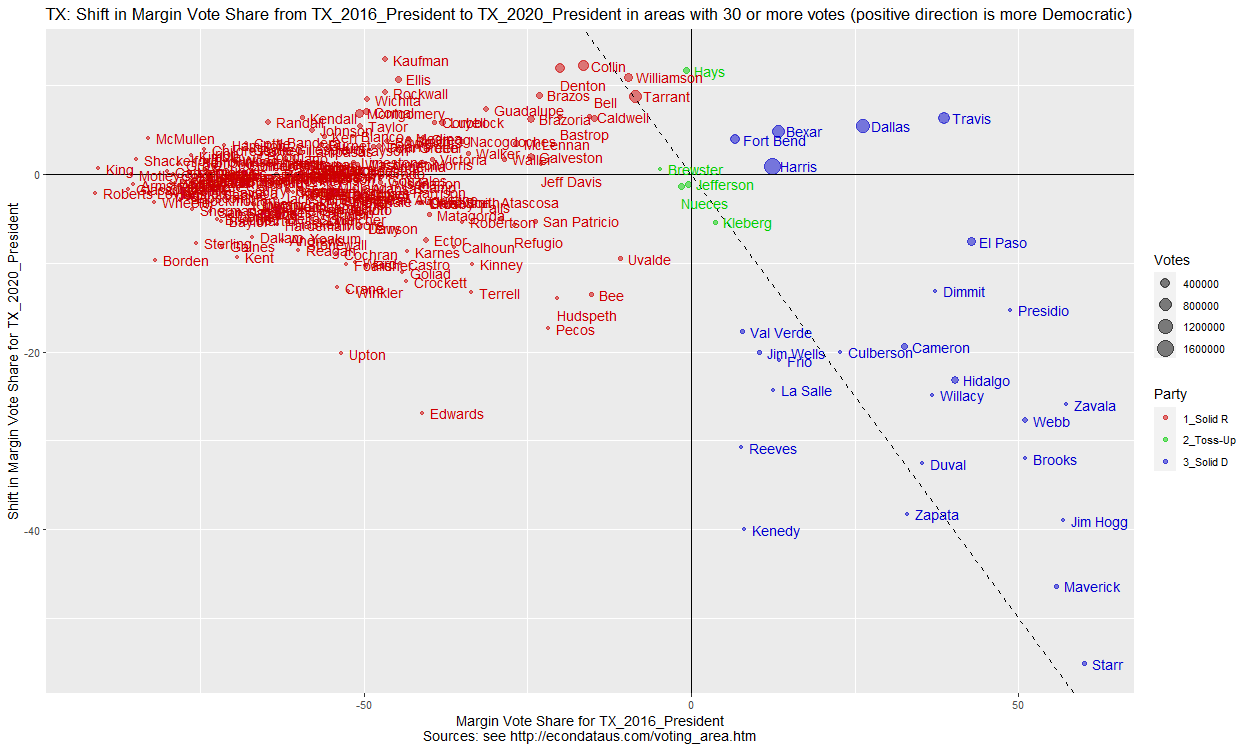
The above 9 counties consist of the 8 southernmost counties in Texas, plus Maverick County. The pattern differs a little bit from the pattern seen in Wisconsin in that the Texas counties contain few Republican precincts. However, the pattern can also be seen in the following graph of the shift in Texas counties from that page.
As mentioned in the prior section, the odd thing is that there appears to be something of a sharp turn toward an increasing Republican shift starting right at the solid Democrat precincts (or the toss-up precincts). It would seem easier to explain an increasing Republican shift from left to right as there are more Democrat voters to shift. But it's hard to think of any reason that the shift would occur right at the point that the precinct become Democrat (or toss-ups). It would seem that this pattern very much merits futher investigation.
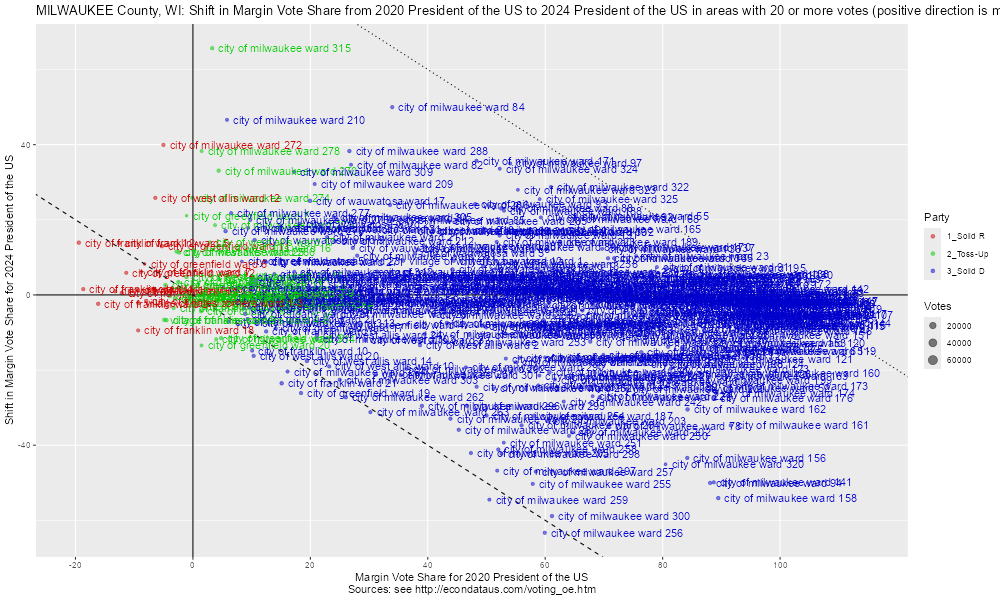
Because Milwaukee contains so many more precincts than other Wisconsin counties, the following graph shows more details.
The above graph gives indexes for the precincts that can be identified in a table. The following graph shows the actual precinct names:
Comparing the 2020 and 2024 Presidential Races by County and Precinct
Comparing the 2020 Presidential and 2024 Senate Races by County and Precinct
Comparing the 2020 and 2024 Presidential Races by Precinct in the Most Populous Counties
Comparing the Pattern seen in Wisconsin in 2024 with the Pattern seen in Texas in 2020
Comparing the 2020 and 2024 Presidential Races by Precinct in Milwaukee

Data Sources
2020 Fall General Election Results:
2024 Election